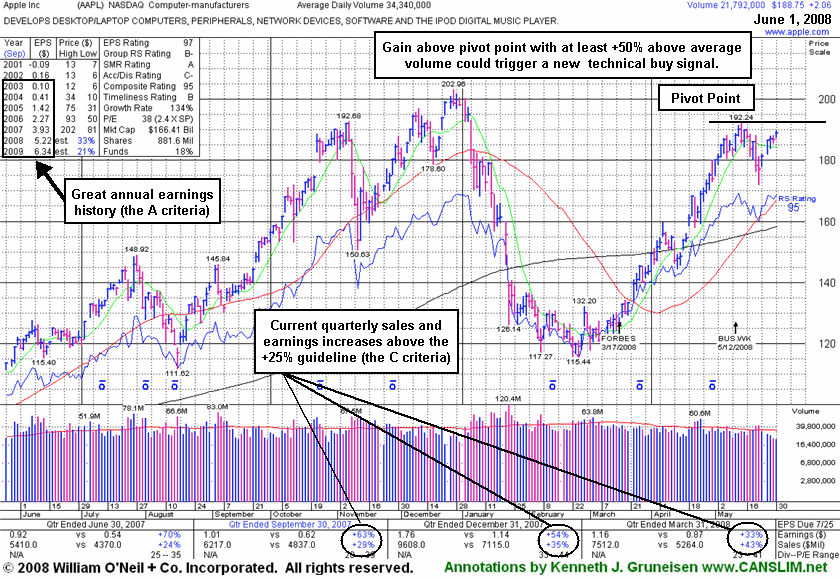
Deep Cup Pattern Reminiscent of Some Past Tech Greats
Sunday, June 01, 2008 CANSLIM.net

|
Apple Inc. |
- Kenneth J. Gruneisen |
|
Ticker Symbol: AAPL (NASDAQ) |
Industry Group: Computer-Manufacturers |
Shares Outstanding: 881,600,000 |
|
Price: $188.75 5/30/08 close |
Day's Volume: 21,792,225 5/30/08 |
Shares in Float: 872,800,000 |
|
52 Week High: $202.96 12/27/07 |
50-Day Average Volume: 34,341,473 |
Up/Down Volume Ratio: 2.2 |
|
Pivot Point: $192.34 5/14/08 high plus .10 |
Pivot Point +5% = Max Buy Price: $201.96 |
Web Address: http://www.apple.com/
|
C A N S L I M | StockTalk | News | Chart | SEC | Zacks Reports | 


View all notes | Alert me of new notes | CANSLIM.net Company Profile
CANSLIM.net Company Profile: Apple, Inc. designs, manufactures, and sells personal computers, portable digital music players, and mobile communication devices, as well as related software, services, peripherals, and networking solutions worldwide. The company's products include desktop and notebook computers, server and storage products, and related devices and peripherals; Mac OS X operating system; and iLife, a suite of software for creation and management of digital photography, music, movies, DVDs, and Web site. The company also provides Internet software and services comprising Safari, a web browser; QuickTime, a multimedia software; Mac, a suite of Internet services. In addition, it offers wireless connectivity and networking services. It was founded in 1976 and was formerly known as Apple Computer, Inc. before changing its name to Apple, Inc. in January 2007. The company is headquartered in Cupertino, California. As of March 29, 2008, the company had 208 retail stores. Apple sports a strong Earnings Per Share (EPS) rating of a 97 and a very healthy Relative Strength (RS) rating of 95. The company has a great annual earnings track record (good A criteria) and also has managed to increase its sales revenues and earnings per share by above the +25% guideline in each of the past three quarterly comparisons (solidly meeting the C criteria) versus the year earlier. AAPL resides in the Computer-Manufacturers group which is currently ranked 85th out of the 197 Industry Groups covered in the paper, placing it outside the top quartile. However, current leadership from other big-cap tech stocks is a helpful reassurance concerning the L criteria.
What to Look For and What to Look Out For: Look for AAPL to trigger a fresh technical buy signal, which could come if it rallies and closes above its pivot point with gains backed by volume of at least 52.5 million shares. Volume needs to be at least +50% above average when the stock manages to close above its pivot point in order to trigger a proper technical buy signal - the high volume behind a breakout's gains is a critical sign of institutional buying demand (the I criteria) . It would be very encouraging to see AAPL trigger a technical buy signal and continue rallying to fresh highs after a sound follow-through day is produced. However, if volume fails to meet the minimum guidelines then a proper technical buy signal would not be triggered. Avoid chasing this issue above its maximum buy price of $201.96, where it would be too extended from a sound price base. As always, it is of the utmost importance to sell a stock if it drops 7-8% below your purchase price.
Technical Analysis: Apple is currently building a very deep cup-with-handle formation that is 5 months long. There have been other cases where stocks fell by as much as 50% during their cup, especially in several tech stocks in the 1990's that traced out this type of pattern (including America Online, which was halved and quickly repaired the damage in the course of a few months during a better than 4-fold rise). The fact that the Nasdaq Composite briefly slid into bear market territory at the beginning of the year is a large part of the explanation why one could allow for such a deep cup to have formed during this period. The stock is currently building the handle portion of this pattern with a pivot point of $192.34. The stock has performed well over the past few months as the major averages, and other stocks in this group, have moved sideways. This is best illustrated by the stock's 95 Relative Strength rating. A look at its weekly chart shows limited downward action with volume in recent months, as it has not encountered distributional pressure.