You are not logged in.
This means you
CAN ONLY VIEW reports that were published prior to Sunday, March 30, 2025.
You
MUST UPGRADE YOUR MEMBERSHIP if you want to see any current reports.
AFTER MARKET UPDATE - FRIDAY, JUNE 18TH, 2010
Previous After Market Report Next After Market Report >>>
|
|
|
|
DOW |
+16.47 |
10,450.64 |
+0.16% |
|
Volume |
1,766,013,100 |
+53% |
|
Volume |
1,921,102,550 |
+11% |
|
NASDAQ |
+2.64 |
2,309.80 |
+0.11% |
|
Advancers |
1,690 |
54% |
|
Advancers |
1,444 |
52% |
|
S&P 500 |
+1.47 |
1,117.51 |
+0.13% |
|
Decliners |
1,351 |
43% |
|
Decliners |
1,232 |
44% |
|
Russell 2000 |
+1.07 |
666.92 |
+0.16% |
|
52 Wk Highs |
59 |
|
|
52 Wk Highs |
55 |
|
|
S&P 600 |
+0.32 |
355.07 |
+0.09% |
|
52 Wk Lows |
14 |
|
|
52 Wk Lows |
31 |
|
|
 |
Major Averages Finish Positive Week After Beginning New Confirmed Rally
Adam Sarhan, Contributing Writer,
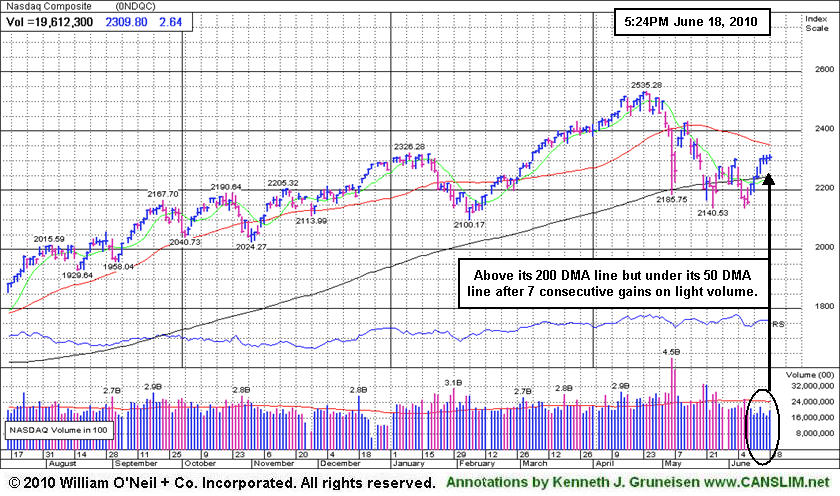
Stocks ended higher this week, confirmed their latest rally attempt, and the benchmark S&P 500 index and the Dow Jones Industrial Average both closed above their respective 200-day moving average (DMA) lines which is an encouraging sign. Volume totals were reported higher on both major exchanges due to Friday's quadruple witching day. Advancers led decliners by a slim margin on the NYSE and on the Nasdaq exchange as the major averages continued consolidating recent gains. There were 33 high-ranked companies from the CANSLIM.net Leaders List that made a new 52-week high and appeared on the CANSLIM.net BreakOuts Page, higher than the 22 issues that appeared on the prior session. New 52-week highs outnumbered new 52-week lows on the NYSE and on the Nasdaq exchange.
On Monday, the major averages ended mixed but near their intra-day lows after Greece's Debt was downgraded by Moody's. However, instead of the usual sell-off, the bulls promptly showed up on Tuesday and helped the major averages score a proper follow-through day (FTD) which confirmed their latest rally attempt. It was equally impressive to see stocks rally and close above their respective 200 DMA lines which has served as formidable resistance over the past 5 weeks. Stocks caught a bid after a New York manufacturing report suggested the global economy remains solid. The Federal Reserve Bank of New York’s general economic index, which measures economic activity in the NY area, rose for an 11th consecutive month which helped offset European Debt woes. In addition, the US dollar continued its two week sell off which helped a slew of dollar denominated assets rally.
Stocks closed mixed, but near their intra-day highs, after retesting the 200 DMA line on Wednesday. Investors digested the latest round of lukewarm economic data and BP (+0.16%) said it plans to create a $20 billion fund to pay for damages from the oil spill. Before Wednesday's opening bell, the Commerce Department said housing starts slid -10%, the largest decline since March 2009, to a 593,000 annual rate. This was lower from a revised 659,000 pace in April and was less than analyst estimates. Meanwhile, building permits, a sign of future construction, unexpectedly fell to a one-year low and single-family starts suffered the largest decline since 1991. The weaker than expected housing data coupled with the sharp two month sell-off in many housing names raises the likelihood of a double dip decline in the ailing housing market. Separately, Fannie Mae (FNM -18.41%)and Freddie Mac (FRE -21.51%) plunged after their regulator told the two mortgage-finance companies to delist their stock from the New York Stock Exchange. Finally, the produce price index (PPI) was released on Wednesday, and it did not spook investors. It is usually an encouraging sign when the market is resilient enough to shrug off disappointing headlines.
Thursday was another relatively quiet day on Wall Street as stocks continued consolidating Tuesday's robust move. Before Thursday's opening bell, the Labor Department said US jobless claims rose to 472,000 last week, and the consumer price index (CPI) slid, which helped allay inflation woes. The Federal Reserve Bank of Philadelphia’s general economic index fell to a 10-month low of 8, less than half the median estimate of Wall Street economists and the Conference Board's index of leading indicators in April edged down -0.1%, following a +1.3% increase in the prior month. Stocks edged higher on Friday as a series of options expired.
Now that the major averages confirmed their latest rally attempt on Tuesday, June 15, 2010, the window is open for disciplined investors to begin carefully buying high-ranked stocks again. Technically, it was encouraging to also see the Dow Jones Industrial Average and the benchmark S&P 500 Index rally above their respective 200-day moving average (DMA) lines. Looking forward, the 200 DMA line should now act as support as this market continues advancing, while any reversal below that key technical level would be a worrisome sign.
Remember to remain very selective because all of the major averages are still trading below their downward sloping 50 DMA lines. It was somewhat disconcerting to see volume remain light (below average) behind the confirming gains. It is important to note that approximately 75% of FTDs lead to new sustained rallies, while 25% fail. In addition, every major rally in market history has begun with a FTD, but not every FTD leads to a new rally. Trade accordingly.
Are You Ready For This NEW Confirmed Rally?
Inquire Today About Our Professional Money Management Services:
If your portfolio is greater than $100,000 and you need assistance, click here to get connected with one of our portfolio managers. ** Serious inquires only, please.
PICTURED: The Nasdaq Composite Index is above its 200 DMA line but under its 50 DMA line after 7 consecutive gains on light volume.
|
|
|
 |
Healthcare Group Getting Into Healthier Shape
Kenneth J. Gruneisen - Passed the CAN SLIM® Master's Exam
Gains in commodity-linked areas helped the Gold & Silver Index ($XAU +1.78%), Integrated Oil Index ($XOI +0.84%), and Oil Services Index ($OSX +1.77%) rise on Friday. The Biotechnology Index ($BTK +1.11%) also rose while the Networking Index ($NWX +0.51%) and Internet Index ($IIX +0.18%) posted smaller gains, yet the Semiconductor Index ($SOX -0.32%) ended with a small loss. A modest gain for the Bank Index ($BKX +0.77%) also helped underpin the major averages' gains, but the Broker/Dealer Index ($XBD +0.06%) ended virtually flat and the Retail Index ($RLX -0.22%) edged lower.
Charts courtesy www.stockcharts.com
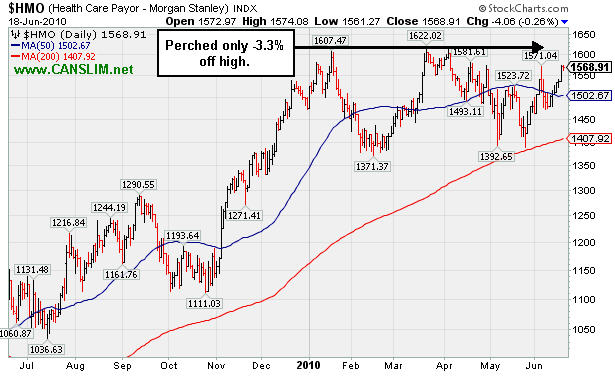
PICTURED: The Healthcare Index ($HMO -0.26%) edged lower on Friday. It has been getting into healthier shape, and closed just -3.3% off its high.
| Oil Services |
$OSX |
183.63 |
+3.19 |
+1.77% |
-5.79% |
| Healthcare |
$HMO |
1,568.91 |
-4.06 |
-0.26% |
+6.52% |
| Integrated Oil |
$XOI |
977.58 |
+8.18 |
+0.84% |
-8.48% |
| Semiconductor |
$SOX |
371.21 |
-1.18 |
-0.32% |
+3.14% |
| Networking |
$NWX |
238.95 |
+1.22 |
+0.51% |
+3.42% |
| Internet |
$IIX |
244.09 |
+0.43 |
+0.18% |
+4.37% |
| Broker/Dealer |
$XBD |
106.19 |
+0.06 |
+0.06% |
-7.70% |
| Retail |
$RLX |
431.79 |
-0.95 |
-0.22% |
+5.03% |
| Gold & Silver |
$XAU |
185.62 |
+3.24 |
+1.78% |
+10.32% |
| Bank |
$BKX |
50.05 |
+0.38 |
+0.77% |
+17.19% |
| Biotech |
$BTK |
1,098.45 |
+12.09 |
+1.11% |
+16.59% |
|
|
|
 |
Strength Helps Insurance Firm Return To Featured Stocks List
Kenneth J. Gruneisen - Passed the CAN SLIM® Master's Exam
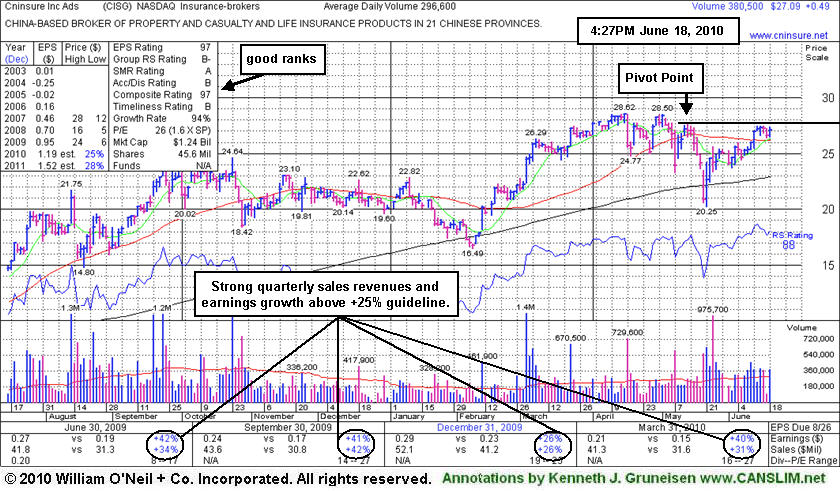
Cninsure Inc (CISG +$0.49 or +1.84% to $27.09) posted a gain with above average volume to end the week reassuringly, closing just -5% off its 52-week high. It is consolidating above its 50-day moving average (DMA) line after recent gains above that important short-term average helped its outlook improve, technically. Disciplined investors may be wise to continue waiting until a fresh technical buy signal occurs. It was featured again in yellow in the 6/16/10 mid-day report (read here) with new pivot point cited based upon its 5/13/10 high. Based on weak action it was previously dropped from the Featured Stocks list on 5/19/10.
This China-based insurance broker has shown strong earnings and sales growth above the +25% guideline. It traded up as much as +17.4% higher after it rose from a 20-week double bottom base with 8 times average volume and was in the 3/03/10 mid-day report (read here). The lack of any other high-ranked leadership in the Insurance-Brokers industry group also remains a concern with respect to the investment system's L criteria.
|
|
|
Color Codes Explained :
Y - Better candidates highlighted by our
staff of experts.
G - Previously featured
in past reports as yellow but may no longer be buyable under the
guidelines.
***Last / Change / Volume data in this table is the closing quote data***
Symbol/Exchange
Company Name
Industry Group |
PRICE |
CHANGE
(%Change) |
Day High |
Volume
(% DAV)
(% 50 day avg vol) |
52 Wk Hi
% From Hi |
Featured
Date |
Price
Featured |
Pivot Featured |
|
Max Buy |
AAPL
-
NASDAQ
Apple Inc
COMPUTER HARDWARE - Personal Computers
|
$274.07
|
+2.20
0.81% |
$275.00
|
27,989,709
104.80% of 50 DAV
50 DAV is 26,707,100
|
$272.90
0.43%
|
6/17/2010
|
$270.95
|
PP = $272.56
|
|
MB = $286.19
|
 Most Recent Note - 6/18/2010 4:17:02 PM
Y - Gain today with average volume was its 7th consecutive gain as it marked a new all-time high. In the 6/17/10 mid-day report (read here) it was featured again in yellow with a new pivot point cited based upon its all-time high plus ten cents while "working on the right side of a choppy 9-week consolidation marked by heavy distribution."
>>> The latest Featured Stock Update with an annotated graph appeared on 6/17/2010. Click here.
View all notes |
Alert me of new notes |
CANSLIM.net Company Profile |
SEC |
Zacks Reports |
StockTalk |
News |
Chart |
Request a new note
C
A N
S L
I M


|
APEI
-
NASDAQ
American Public Educ Inc
DIVERSIFIED SERVICES - Education and Training Services
|
$47.99
|
+0.65
1.37% |
$48.49
|
308,356
186.77% of 50 DAV
50 DAV is 165,100
|
$48.26
-0.56%
|
6/7/2010
|
$46.60
|
PP = $46.29
|
|
MB = $48.60
|
Most Recent Note - 6/18/2010 4:19:30 PM
Y - Today's gain with +85% above average volume helped it hit a new 52-week high, reconfirming its recently noted technical buy signal. Recently slumped near its 50 DMA line, then positively reversed and closed with a solid gain.
>>> The latest Featured Stock Update with an annotated graph appeared on 6/14/2010. Click here.
View all notes |
Alert me of new notes |
CANSLIM.net Company Profile |
SEC |
Zacks Reports |
StockTalk |
News |
Chart |
Request a new note
C
A N
S L
I M
|
BIDU
-
NASDAQ
Baidu Inc Ads
INTERNET - Internet Information Providers
|
$74.09
|
+1.62
2.23% |
$74.88
|
12,002,179
79.18% of 50 DAV
50 DAV is 15,157,800
|
$82.29
-9.96%
|
1/13/2010
|
$43.13
|
PP = $42.68
|
|
MB = $44.81
|
Most Recent Note - 6/18/2010 4:21:05 PM
G - Finished a quiet week of consolidating above its 50 DMA line just -10% below its 52-week high. A worrisome negative reversal from its all-time high on 5/13/10 followed a 10:1 stock split.
>>> The latest Featured Stock Update with an annotated graph appeared on 6/1/2010. Click here.
View all notes |
Alert me of new notes |
CANSLIM.net Company Profile |
SEC |
Zacks Reports |
StockTalk |
News |
Chart |
Request a new note
C
A N
S L
I M
|
BRLI
-
NASDAQ
Bio Reference Labs Inc
HEALTH SERVICES - Medical Laboratories and Researc
|
$23.34
|
+0.13
0.56% |
$23.87
|
345,699
183.30% of 50 DAV
50 DAV is 188,600
|
$24.67
-5.40%
|
6/15/2010
|
$23.57
|
PP = $24.77
|
|
MB = $26.01
|
Most Recent Note - 6/18/2010 4:24:57 PM
Y - Volume was above average behind a small gain today. It has been consolidating very near its 50 DMA line for the past month.
>>> The latest Featured Stock Update with an annotated graph appeared on 6/15/2010. Click here.
View all notes |
Alert me of new notes |
CANSLIM.net Company Profile |
SEC |
Zacks Reports |
StockTalk |
News |
Chart |
Request a new note
C
A N
S L
I M
|
CISG
-
NASDAQ
Cninsure Inc Ads
INSURANCE - Insurance Brokers
|
$27.09
|
+0.49
1.84% |
$27.39
|
380,553
127.83% of 50 DAV
50 DAV is 297,700
|
$28.62
-5.35%
|
6/16/2010
|
$27.20
|
PP = $27.75
|
|
MB = $29.14
|
Most Recent Note - 6/18/2010 4:34:32 PM
Y - Gain today with above average volume while consolidating above its 50 DMA line. Featured again in yellow in the 6/16/10 mid-day report (read here) with new pivot point cited based upon its 5/13/10 high. Based on weak action it was previously dropped from the Featured Stocks list on 5/19/10.
>>> The latest Featured Stock Update with an annotated graph appeared on 6/18/2010. Click here.
View all notes |
Alert me of new notes |
CANSLIM.net Company Profile |
SEC |
Zacks Reports |
StockTalk |
News |
Chart |
Request a new note
C
A N
S L
I M
|
Symbol/Exchange
Company Name
Industry Group |
PRICE |
CHANGE
(%Change) |
Day High |
Volume
(% DAV)
(% 50 day avg vol) |
52 Wk Hi
% From Hi |
Featured
Date |
Price
Featured |
Pivot Featured |
|
Max Buy |
CRM
-
NYSE
Salesforce.Com Inc
INTERNET - Internet Software and Services
|
$95.72
|
-1.38
-1.42% |
$97.00
|
2,513,840
96.03% of 50 DAV
50 DAV is 2,617,900
|
$97.58
-1.91%
|
6/2/2010
|
$88.44
|
PP = $89.60
|
|
MB = $94.08
|
Most Recent Note - 6/18/2010 4:54:57 PM
G - Technically it ended down slightly for the week on higher volume, hovering near its all-time high, extended from its latest sound base. Prior highs in the $89 area are an important support level to watch above its 50 DMA line.
>>> The latest Featured Stock Update with an annotated graph appeared on 6/2/2010. Click here.
View all notes |
Alert me of new notes |
CANSLIM.net Company Profile |
SEC |
Zacks Reports |
StockTalk |
News |
Chart |
Request a new note
C
A N
S L
I M
|
DECK
-
NASDAQ
Deckers Outdoor Corp
CONSUMER NON-DURABLES - Textile - Apparel Footwear
|
$164.92
|
+2.13
1.31% |
$166.73
|
378,555
73.68% of 50 DAV
50 DAV is 513,800
|
$167.49
-1.53%
|
6/11/2010
|
$157.34
|
PP = $158.57
|
|
MB = $166.50
|
Most Recent Note - 6/18/2010 5:08:08 PM
Y - Closed at a new high after 4 consecutive weekly gains. Prior chart highs may now serve as initial support on pullbacks.
>>> The latest Featured Stock Update with an annotated graph appeared on 6/11/2010. Click here.
View all notes |
Alert me of new notes |
CANSLIM.net Company Profile |
SEC |
Zacks Reports |
StockTalk |
News |
Chart |
Request a new note
C
A N
S L
I M
|
FFIV
-
NASDAQ
F 5 Networks Inc
INTERNET - Internet Software and Services
|
$73.81
|
+0.39
0.53% |
$74.62
|
1,591,163
98.84% of 50 DAV
50 DAV is 1,609,900
|
$75.93
-2.79%
|
6/16/2010
|
$74.50
|
PP = $74.10
|
|
MB = $77.81
|
Most Recent Note - 6/18/2010 5:12:49 PM
Y - Held its ground with a gain on light volume. Gain on 6/16/10 with +55% above average volume helped it trigger a technical buy signal with its breakout from a flat base of about 5-weeks. Featured in the 6/16/10 mid-day report (read here) as its color code was changed to yellow with a pivot point based upon its 5/13/10 high plus ten cents.
>>> The latest Featured Stock Update with an annotated graph appeared on 6/16/2010. Click here.
View all notes |
Alert me of new notes |
CANSLIM.net Company Profile |
SEC |
Zacks Reports |
StockTalk |
News |
Chart |
Request a new note
C
A N
S L
I M
|
MELI
-
NASDAQ
Mercadolibre Inc
INTERNET - Internet Software and; Services
|
$59.23
|
-1.52
-2.50% |
$60.99
|
986,218
130.99% of 50 DAV
50 DAV is 752,900
|
$62.14
-4.68%
|
5/13/2010
|
$54.21
|
PP = $55.85
|
|
MB = $58.64
|
Most Recent Note - 6/18/2010 5:15:47 PM
G - Loss today on higher volume ended a streak of 8 consecutive gains. Extended from its prior base, its prior chart highs in the $55 area may act as an initial support level on pullbacks.
>>> The latest Featured Stock Update with an annotated graph appeared on 6/10/2010. Click here.
View all notes |
Alert me of new notes |
CANSLIM.net Company Profile |
SEC |
Zacks Reports |
StockTalk |
News |
Chart |
Request a new note
C
A N
S L
I M
|
ROVI
-
NASDAQ
Rovi Corp
COMPUTER SOFTWARE andamp; SERVICES - Security Software andamp; Services
|
$37.38
|
-1.00
-2.61% |
$38.36
|
1,403,136
106.22% of 50 DAV
50 DAV is 1,321,000
|
$40.06
-6.69%
|
6/3/2010
|
$38.70
|
PP = $40.16
|
|
MB = $42.17
|
Most Recent Note - 6/18/2010 5:18:07 PM
G - Loss today led to a close under its 50 DMA line again, raising concerns. Recently found support near prior lows in the $35 area, and stayed above its October 2009 chart high.
>>> The latest Featured Stock Update with an annotated graph appeared on 6/9/2010. Click here.
View all notes |
Alert me of new notes |
CANSLIM.net Company Profile |
SEC |
Zacks Reports |
StockTalk |
News |
Chart |
Request a new note
C
A N
S L
I M
|
Symbol/Exchange
Company Name
Industry Group |
PRICE |
CHANGE
(%Change) |
Day High |
Volume
(% DAV)
(% 50 day avg vol) |
52 Wk Hi
% From Hi |
Featured
Date |
Price
Featured |
Pivot Featured |
|
Max Buy |
SUMR
-
NASDAQ
Summer Infant Inc
CONSUMER NON-DURABLES - Personal Products
|
$7.28
|
+0.02
0.28% |
$7.38
|
32,597
41.05% of 50 DAV
50 DAV is 79,400
|
$8.42
-13.54%
|
5/4/2010
|
$6.85
|
PP = $7.09
|
|
MB = $7.44
|
Most Recent Note - 6/18/2010 5:19:53 PM
G - Today marked its 6th consecutive gain on light volume. It has rallied back above its 50 DMA line and prior chart highs in the $7 area, technically improving its outlook. Recent chart lows in the $6.25 area define important support to watch now.
>>> The latest Featured Stock Update with an annotated graph appeared on 6/8/2010. Click here.
View all notes |
Alert me of new notes |
CANSLIM.net Company Profile |
SEC |
Zacks Reports |
StockTalk |
News |
Chart |
Request a new note
C
A N
S L
I M
|
THOR
-
NASDAQ
Thoratec Corp
HEALTH SERVICES - Medical Instruments and Supplies
|
$46.30
|
+0.18
0.39% |
$47.30
|
850,708
91.68% of 50 DAV
50 DAV is 927,900
|
$47.93
-3.40%
|
6/3/2010
|
$44.38
|
PP = $45.35
|
|
MB = $47.62
|
Most Recent Note - 6/18/2010 5:21:25 PM
Y- Consolidating above its pivot point and below its "max buy" level. No resistance remains due to overhead supply, and it could produce more climactic gains.
>>> The latest Featured Stock Update with an annotated graph appeared on 6/3/2010. Click here.
View all notes |
Alert me of new notes |
CANSLIM.net Company Profile |
SEC |
Zacks Reports |
StockTalk |
News |
Chart |
Request a new note
C
A N
S L
I M
|
ULTA
-
NASDAQ
Ulta Salon Cosm & Frag
SPECIALTY RETAIL - Specialty Retail, Other
|
$26.18
|
+0.38
1.47% |
$26.49
|
781,751
135.91% of 50 DAV
50 DAV is 575,200
|
$26.50
-1.21%
|
5/28/2010
|
$25.58
|
PP = $25.86
|
|
MB = $27.15
|
Most Recent Note - 6/18/2010 5:23:26 PM
Y - Gain today with above average volume for another new high close above its pivot point yet below its "max buy" level. No overhead supply remains to act as resistance, however, on 6/11/10 it completed a Secondary Offering which may hinder upward price progress for the near-term.
>>> The latest Featured Stock Update with an annotated graph appeared on 6/7/2010. Click here.
View all notes |
Alert me of new notes |
CANSLIM.net Company Profile |
SEC |
Zacks Reports |
StockTalk |
News |
Chart |
Request a new note
C
A N
S L
I M
|
|
|
|
THESE ARE NOT BUY RECOMMENDATIONS!
Comments contained in the body of this report are technical
opinions only. The material herein has been obtained
from sources believed to be reliable and accurate, however,
its accuracy and completeness cannot be guaranteed.
This site is not an investment advisor, hence it does
not endorse or recommend any securities or other investments.
Any recommendation contained in this report may not
be suitable for all investors and it is not to be deemed
an offer or solicitation on our part with respect to
the purchase or sale of any securities. All trademarks,
service marks and trade names appearing in this report
are the property of their respective owners, and are
likewise used for identification purposes only.
This report is a service available
only to active Paid Premium Members.
You may opt-out of receiving report notifications
at any time. Questions or comments may be submitted
by writing to Premium Membership Services 665 S.E. 10 Street, Suite 201 Deerfield Beach, FL 33441-5634 or by calling 1-800-965-8307
or 954-785-1121.
|
|
|


