You are not logged in.
This means you
CAN ONLY VIEW reports that were published prior to Monday, May 27, 2024.
You
MUST UPGRADE YOUR MEMBERSHIP if you want to see any current reports.
AFTER MARKET UPDATE - WEDNESDAY, JUNE 1ST, 2022
Previous After Market Report Next After Market Report >>>
|
|
|
|
DOW |
-176.89 |
32,813.23 |
-0.54% |
|
Volume |
997,249,793 |
-56% |
|
Volume |
4,681,944,600 |
-21% |
|
NASDAQ |
-86.93 |
11,994.46 |
-0.72% |
|
Advancers |
1,270 |
40% |
|
Advancers |
1,598 |
37% |
|
S&P 500 |
-30.92 |
4,101.23 |
-0.75% |
|
Decliners |
1,880 |
60% |
|
Decliners |
2,697 |
63% |
|
Russell 2000 |
-9.22 |
1,854.82 |
-0.49% |
|
52 Wk Highs |
52 |
|
|
52 Wk Highs |
30 |
|
|
S&P 600 |
-4.10 |
1,231.51 |
-0.33% |
|
52 Wk Lows |
52 |
|
|
52 Wk Lows |
190 |
|
|
Lower volume on the NYSE suggested that both Thursday and Friday's solid gains for the Dow Jones Industrial Average and the S&P 500 Index were not the result of increasing institutional buying demand. The market remains in a correction (M criteria) as arguably the rally still needs a solid confirmation. An opportunity for a valid follow-through day remains open unless the recent lows or May 20th lows are violated.
|
 |
Major Indices Fell With Lighter Volume Totals
Kenneth J. Gruneisen - Passed the CAN SLIM® Master's Exam
The Dow trimmed a more than 350 point decline to finish 176 points lower. The S&P 500 fell 0.8%, while the Nasdaq Composite retreated 0.7%. Volume totals reported were lighter than the prior session on the NYSE and on the Nasdaq exchange, indicative of a decrease in institutional selling. Breadth was negative as decliners led advancers by a 3-2 margin on the NYSE and by a 5-3 margin on the Nasdaq exchange. There were 39 high-ranked companies from the Leaders List that hit new 52-week highs and were listed on the BreakOuts Page, versus the total of 42 on the prior session. New 52-week highs matched new 52-week lows on the NYSE while new lows still outnumbered new 52-week highs on the Nasdaq exchange. The major indices have been in a noted market correction (M criteria). Sources at the newspaper, following Thursday's session, relabeled it a "confirmed uptrend" despite flaws noted in our market commentaries. Followers of the fact-based investment system know to watch for a follow-through day backed by higher volume which could signal a new confirmed uptrend.
Chart courtesy of www.stockcharts.com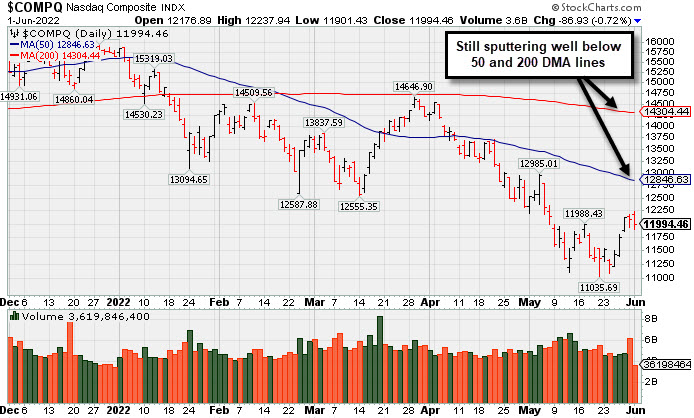 PICTURED: The Nasdaq Composite Index is still sputtering well below its 50-day and 200-day moving average (DMA) lines.
Lower volume on the NYSE on prior sessions suggested that both Thursday and Friday's solid gains for the Dow Jones Industrial Average and the S&P 500 Index were not the result of truly increasing institutional buying demand. Arguably, the rally still needs confirmation, and an opportunity for a valid follow-through day remains open unless the recent lows or May 20th lows are violated.
U.S. stocks finished lower on Wednesday as Wall Street deliberated the implications for monetary policy following upbeat economic data updates. Volatility remained elevated, with the major averages paring intraday losses of more than 1%.
On the data front, the Institute for Supply Management (ISM) revealed U.S. manufacturing sector growth unexpectedly accelerated in May, with the purchasing managers’ index (PMI) advancing to 56.1 from April’s 55.4 print. The update underscored solid demand as the new orders component advanced to the highest level in three months. Meanwhile, the measure of employment moved into contraction territory. Separately, the Jobs Opening and Labor Turnover Survey (JOLTS) revealed job openings declined modestly to 11.4 million in April from March’s upwardly revised record 11.9 million open positions. In central bank news, the Federal Reserve’s (Fed) Beige Book indicated economic growth in four out of its 12 regions slowed since the prior period. Treasuries weakened, with the yield on the 10-year note rising five basis points (0.05%) to 2.92%. The more Fed sensitive two-year note yield spiked eight basis points (0.08%) to 2.65%.
Ten of 11 S&P 500 sectors finished in negative territory with Financials leading laggards. The Energy group was the lone advancer as the Organization of the Petroleum Exporting Countries (OPEC) and its allies forecasted further tightening of global oil supplies. In earnings, software maker Salesforce Inc. (CRM +9.88) rose after raising its full-year annual profit forecast.
|
 Kenneth J. Gruneisen started out as a licensed stockbroker in August 1987, a couple of months prior to the historic stock market crash that took the Dow Jones Industrial Average down -22.6% in a single day. He has published daily fact-based fundamental and technical analysis on high-ranked stocks online for two decades. Through FACTBASEDINVESTING.COM, Kenneth provides educational articles, news, market commentary, and other information regarding proven investment systems that work in good times and bad.
Comments contained in the body of this report are technical opinions only and are not necessarily those of Gruneisen Growth Corp. The material herein has been obtained from sources believed to be reliable and accurate, however, its accuracy and completeness cannot be guaranteed. Our firm, employees, and customers may effect transactions, including transactions contrary to any recommendation herein, or have positions in the securities mentioned herein or options with respect thereto. Any recommendation contained in this report may not be suitable for all investors and it is not to be deemed an offer or solicitation on our part with respect to the purchase or sale of any securities. |
|
 |
Commodity-Linked Groups Had a Positive Bias
Kenneth J. Gruneisen - Passed the CAN SLIM® Master's Exam
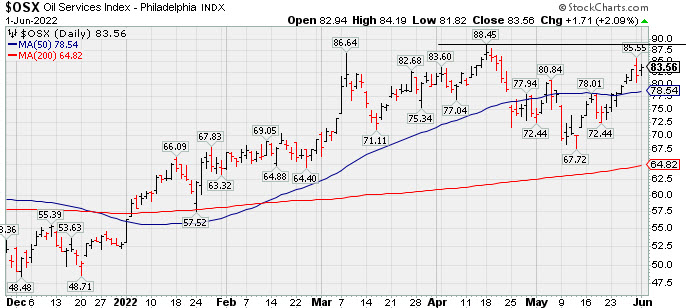
Commodity-linked groups had a positive bias as the Oil Services Index ($OSX +2.09%), Integrated Oil Index ($XOI +1.65%), and Gold & Silver Index ($XAU +0.80%) each notched gains. The Broker/Dealer Index ($XBD -1.64%) and Bank Index ($BKX -1.97%) both created a drag on the major averages. The Retail Index ($RLX -0.23%) also edged lower. The Semiconductor Index ($SOX -1.60%) and Biotech Index ($BTK -1.04%) both lost ground, meanwhile the Networking Index ($NWX +0.15%) inched higher.
PICTURED: The Oil Services Index ($OSX +2.09%) is consolidating above its 50-day moving average line after recently rebounding toward its April high.
| Oil Services |
$OSX |
83.56 |
+1.71 |
+2.09% |
+58.49% |
| Integrated Oil |
$XOI |
1,819.90 |
+29.50 |
+1.65% |
+54.46% |
| Semiconductor |
$SOX |
3,049.03 |
-49.66 |
-1.60% |
-22.73% |
| Networking |
$NWX |
748.81 |
+1.09 |
+0.15% |
-22.89% |
| Broker/Dealer |
$XBD |
412.71 |
-6.88 |
-1.64% |
-15.23% |
| Retail |
$RLX |
3,149.40 |
-7.34 |
-0.23% |
-25.48% |
| Gold & Silver |
$XAU |
129.79 |
+1.03 |
+0.80% |
-2.01% |
| Bank |
$BKX |
114.24 |
-2.30 |
-1.97% |
-13.60% |
| Biotech |
$BTK |
4,553.15 |
-48.03 |
-1.04% |
-17.49% |
|
|
|
 |
Big Volume-Driven Gain Helped Technical Stance Improve
Kenneth J. Gruneisen - Passed the CAN SLIM® Master's Exam
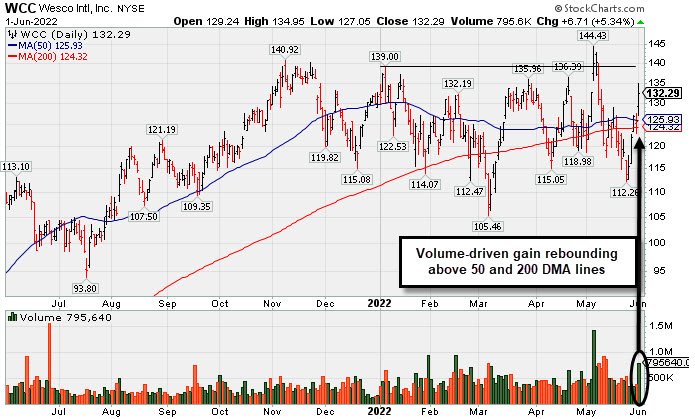
Wesco International Inc (WCC +$6.71 or +5.34% to $132.29) was highlighted in yellow in the earlier mid-day report (read here) after rebounding above its 50 and 200 DMA lines with gains lacking great volume but helping its outlook improve. Subsequent gains for a new high close backed by at least +40% above average volume would be a reassuring sign of fresh institutional buying demand which could lead to a meaningful price advance.
WCC was last shown in this FSU section on 5/17/22 with an annotated graph under the headline, "Stalled After Recent Breakout But Remains Near High". The Electronic - Parts firm sputtered but showed resilience since it was dropped from the Featured Stocks list on 5/20/22.
Fundamentals remain strong after it reported Mar '22 quarterly earnings +154% on +22% sales revenues versus the year ago period. It reported strong Mar, Jun, Sep, and Dec '21 quarterly results versus the year ago periods, well above the +25% minimum guideline. Annual earnings growth has been steady. It has an Earnings Per Share Rating of 97.
There is a small supply of only 50.7 million shares outstanding (S criteria) which can contribute to greater price volatility in the event of institutional buying or selling. The number of top-rated funds owning its shares rose from 489 in Jun '21 to 546 in Mar '22, a reassuring sign concerning the I criteria. Its current Up/Down Volume Ratio of 0.9 is an unbiased indication of slightly distributional action over the past 50 days.
|
|
|
Color Codes Explained :
Y - Better candidates highlighted by our
staff of experts.
G - Previously featured
in past reports as yellow but may no longer be buyable under the
guidelines.
***Last / Change / Volume data in this table is the closing quote data***
Symbol/Exchange
Company Name
Industry Group |
PRICE |
CHANGE
(%Change) |
Day High |
Volume
(% DAV)
(% 50 day avg vol) |
52 Wk Hi
% From Hi |
Featured
Date |
Price
Featured |
Pivot Featured |
|
Max Buy |
 CI
-
NYSE
CI
-
NYSE
Cigna Corp
Medical-Managed Care
|
$264.58
|
-3.71
-1.38% |
$271.58
|
2,612,357
177.23% of 50 DAV
50 DAV is 1,474,000
|
$272.97
-3.07%
|
5/6/2022
|
$263.52
|
PP = $269.97
|
|
MB = $283.47
|
 Most Recent Note - 6/1/2022 6:29:35 PM
Y - Pulled back for a 2nd volume-driven loss today following a "negative reversal" on the prior session after touching a new all-time high. Its 50 DMA line ($255.61) defines near-term support to watch. Subsequent gains above the pivot point backed by at least +40% above average volume may trigger a technical buy signal. Fundamentals remain strong.
>>> FEATURED STOCK ARTICLE : Consolidating Above 50-Day Moving Average Near All-Time High - 5/25/2022 |
View all notes |
Set NEW NOTE alert |
Company Profile |
SEC
News |
Chart |
Request a new note
C
A
S
I |
PAG
-
NYSE
Penske Automotive Grp
Retail/Whlsle-Automobile
|
$116.23
|
+1.09
0.95% |
$117.08
|
377,507
110.06% of 50 DAV
50 DAV is 343,000
|
$119.47
-2.71%
|
5/13/2022
|
$114.88
|
PP = $114.57
|
|
MB = $120.30
|
Most Recent Note - 6/1/2022 6:31:46 PM
Y - Posted a small gain today with near average volume. Rebounded back above the previously cited pivot point following a recent pullback. Its 50 DMA line ($104.22) defines important near term support to watch.
>>> FEATURED STOCK ARTICLE : Breakout With Volume-Driven Gain to New High - 5/13/2022 |
View all notes |
Set NEW NOTE alert |
Company Profile |
SEC
News |
Chart |
Request a new note
C
A
S
I |
LLY
-
NYSE
Eli Lilly & Co
Medical-Diversified
|
$311.08
|
-2.36
-0.75% |
$313.90
|
2,728,187
91.15% of 50 DAV
50 DAV is 2,993,000
|
$324.08
-4.01%
|
5/16/2022
|
$302.46
|
PP = $314.10
|
|
MB = $329.81
|
Most Recent Note - 6/1/2022 6:30:45 PM
Y - Pulled back with lighter volume today. Its 50 DMA line ($296) recently acted as support. Pivot point cited was based on its 4/07/22 high plus 10 cents. Subsequent gains above the pivot point backed by at least +40% above average volume may trigger a convincing technical buy signal. Fundamentals remain strong.
>>> FEATURED STOCK ARTICLE : Eli Lilly & Co Challenges All-Time High - 5/16/2022 |
View all notes |
Set NEW NOTE alert |
Company Profile |
SEC
News |
Chart |
Request a new note
C
A
S
I |
WCC
-
NYSE
Wesco International Inc
WHOLESALE - Electronics Wholesale
|
$132.29
|
+6.71
5.34% |
$134.95
|
795,639
171.84% of 50 DAV
50 DAV is 463,000
|
$144.43
-8.41%
|
6/1/2022
|
$128.79
|
PP = $139.10
|
|
MB = $146.06
|
Most Recent Note - 6/1/2022 6:28:23 PM
Y - Posted a solid gain today and was highlighted in yellow in the earlier mid-day report after rebounding above its 50 and 200 DMA lines. The gain backed by great volume helped its outlook improve. Subsequent gains for a new high close backed by at least +40% above average volume may indicate fresh institutional buying demand. Fundamentals remain strong after it reported Mar '22 quarterly earnings +154% on +22% sales revenues versus the year ago period. See the latest FSU analysis for more details and a new annotated graph.
>>> FEATURED STOCK ARTICLE : Big Volume-Driven Gain Helped Technical Stance Improve - 6/1/2022 |
View all notes |
Set NEW NOTE alert |
Company Profile |
SEC
News |
Chart |
Request a new note
C
A
S
I |
|
|
|
THESE ARE NOT BUY RECOMMENDATIONS!
Comments contained in the body of this report are technical
opinions only. The material herein has been obtained
from sources believed to be reliable and accurate, however,
its accuracy and completeness cannot be guaranteed.
This site is not an investment advisor, hence it does
not endorse or recommend any securities or other investments.
Any recommendation contained in this report may not
be suitable for all investors and it is not to be deemed
an offer or solicitation on our part with respect to
the purchase or sale of any securities. All trademarks,
service marks and trade names appearing in this report
are the property of their respective owners, and are
likewise used for identification purposes only.
This report is a service available
only to active Paid Premium Members.
You may opt-out of receiving report notifications
at any time. Questions or comments may be submitted
by writing to Premium Membership Services 665 S.E. 10 Street, Suite 201 Deerfield Beach, FL 33441-5634 or by calling 1-800-965-8307
or 954-785-1121.
|
|
|