You are not logged in.
This means you
CAN ONLY VIEW reports that were published prior to Tuesday, April 8, 2025.
You
MUST UPGRADE YOUR MEMBERSHIP if you want to see any current reports.
AFTER MARKET UPDATE - TUESDAY, MAY 31ST, 2022
Previous After Market Report Next After Market Report >>>
|
|
|
|
DOW |
-222.84 |
32,990.12 |
-0.67% |
|
Volume |
2,287,385,330 |
+148% |
|
Volume |
5,941,974,000 |
+25% |
|
NASDAQ |
-49.74 |
12,081.39 |
-0.41% |
|
Advancers |
1,093 |
35% |
|
Advancers |
1,893 |
42% |
|
S&P 500 |
-25.77 |
4,132.47 |
-0.62% |
|
Decliners |
2,015 |
65% |
|
Decliners |
2,657 |
58% |
|
Russell 2000 |
-15.35 |
1,872.55 |
-0.81% |
|
52 Wk Highs |
105 |
|
|
52 Wk Highs |
64 |
|
|
S&P 600 |
-13.33 |
1,235.61 |
-1.07% |
|
52 Wk Lows |
33 |
|
|
52 Wk Lows |
116 |
|
|
Lower volume on the NYSE suggested that both Thursday and Friday's solid gains for the Dow Jones Industrial Average and the S&P 500 Index were not the result of increasing institutional buying demand. The market remains in a correction (M criteria) as arguably the rally still needs a solid confirmation. An opportunity for a valid follow-through day remains open unless the recent lows or May 20th lows are violated.
|
 |
Major Averages Fell With Higher Volume Totals
Kenneth J. Gruneisen - Passed the CAN SLIM® Master's Exam
The Dow slid 222 points, snapping a six-day winning streak but still eking out monthly gain of less than 0.1%. The S&P 500 lost 0.6%, finishing little changed in May. The Nasdaq Composite fell 0.4% extending its monthly decline to 2.1%. Volume totals reported were higher than the prior session on the NYSE and on the Nasdaq exchange, indicative of an increase in institutional selling termed "distribution". Breadth was clearly negative as decliners led advancers by almost a 2-1 margin on the NYSE and by a 3-2 margin on the Nasdaq exchange. There were 42 high-ranked companies from the Leaders List that hit new 52-week highs and were listed on the BreakOuts Page, versus the total of 46 on the prior session. New 52-week highs outnumbered new 52-week lows on the NYSE while new lows still outnumbered new 52-week highs on the Nasdaq exchange. The major indices have been in a noted market correction (M criteria). Sources at the newspaper, following Thursday's session, relabeled it a "confirmed uptrend" despite flaws noted in our market commentaries. Followers of the fact-based investment system know to watch for a follow-through day backed by higher volume which could signal a new confirmed uptrend.
Chart courtesy of www.stockcharts.com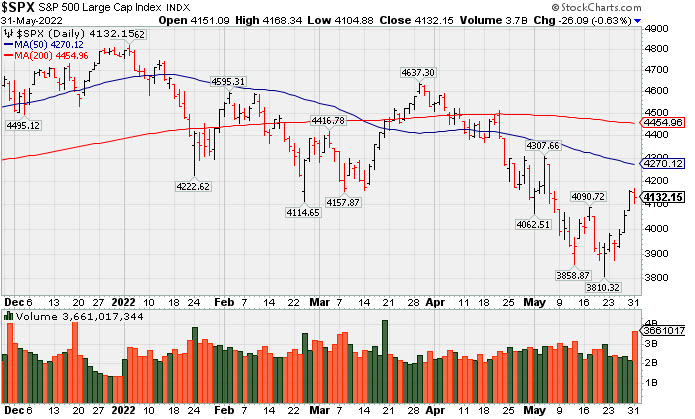 PICTURED: The S&P 500 Index churned heavier volume Tuesday following Monday's closure in observance of Memorial Day, ending virtually unchanged for the month of May.
Lower volume on the NYSE on prior sessions suggested that both Thursday and Friday's solid gains for the Dow Jones Industrial Average and the S&P 500 Index were not the result of truly increasing institutional buying demand. Arguably, the rally still needs confirmation, and an opportunity for a valid follow-through day remains open unless the recent lows or May 20th lows are violated.
U.S. equities resumed their downward trajectory on Tuesday as investors took stock of a volatile month and assessed renewed worries that persistent inflation could dampen economic growth. An update showed consumer prices in Europe surged a record 8.1% year-over-year in May. Meanwhile, oil prices held near their highest level in 12-weeks after the European Union said they would place a partial ban on Russian crude imports.
Treasuries weakened following hawkish comments from Federal Reserve (Fed) Governor Christopher Waller. He voiced support for raising rates by 0.50% at the next several policy meetings until inflation comes down closer to the Fed’s 2% target. The yield on the 10-year note spiked 13 basis points (0.13%) to 2.87%, though shed five basis points (0.05%) in May. On the data front, the Conference Board’s gauge of consumer confidence fell to 106.4 in May from last month’s upwardly revised 108.6 print. Separately, the S&P CoreLogic Case-Shiller 20-city index showed home prices jump 21.2% year-over-year in March. Meanwhile, the Dallas Fed’s index of general business activity unexpectedly fell into negative territory for the first time since July 2020.
Nine of 11 S&P 500 sectors finished in negative territory. The Consumer Discretionary group outperformed after shares of Amazon.com, Inc (AMZN +4.40%) rose. In corporate news, Unilever PLC (UL +9.89%) rose after the company named an activist investor to its board.
|
 Kenneth J. Gruneisen started out as a licensed stockbroker in August 1987, a couple of months prior to the historic stock market crash that took the Dow Jones Industrial Average down -22.6% in a single day. He has published daily fact-based fundamental and technical analysis on high-ranked stocks online for two decades. Through FACTBASEDINVESTING.COM, Kenneth provides educational articles, news, market commentary, and other information regarding proven investment systems that work in good times and bad.
Comments contained in the body of this report are technical opinions only and are not necessarily those of Gruneisen Growth Corp. The material herein has been obtained from sources believed to be reliable and accurate, however, its accuracy and completeness cannot be guaranteed. Our firm, employees, and customers may effect transactions, including transactions contrary to any recommendation herein, or have positions in the securities mentioned herein or options with respect thereto. Any recommendation contained in this report may not be suitable for all investors and it is not to be deemed an offer or solicitation on our part with respect to the purchase or sale of any securities. |
|
 |
Tech and Commodity-Linked Groups Fell
Kenneth J. Gruneisen - Passed the CAN SLIM® Master's Exam
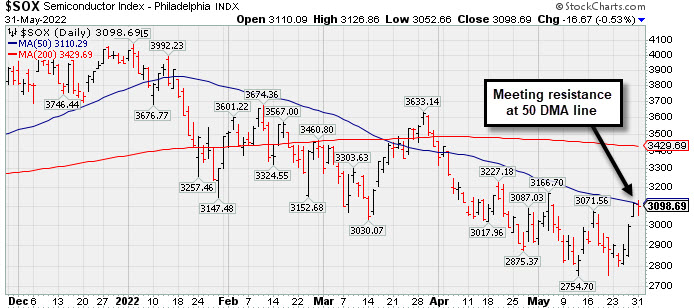
The Retail Index ($RLX +1.21%) posted an influential gain while the Bank Index ($BKX +0.22%) edged higher but the Broker/Dealer Index ($XBD -0.88%) fell. The Biotech Index ($BTK -2.73%) led the tech sector lower while the Networking Index ($NWX -1.76%) also slumped, and the Semiconductor Index ($SOX -0.53%) edged lower. Commodity-linked groups also had a negative bias as the Gold & Silver Index ($XAU -2.52%) outpaced the Oil Services Index ($OSX -1.60%) and Integrated Oil Index ($XOI -0.86%) to the downside.
PICTURED: The Semiconductor Index ($SOX -0.53%) has been meeting resistance at its 50-day moving average line while rebounding from the recent low.
| Oil Services |
$OSX |
81.84 |
-1.33 |
-1.60% |
+55.24% |
| Integrated Oil |
$XOI |
1,790.48 |
-15.44 |
-0.86% |
+51.97% |
| Semiconductor |
$SOX |
3,098.69 |
-16.67 |
-0.53% |
-21.48% |
| Networking |
$NWX |
747.71 |
-13.36 |
-1.76% |
-23.00% |
| Broker/Dealer |
$XBD |
419.54 |
-3.74 |
-0.88% |
-13.83% |
| Retail |
$RLX |
3,156.74 |
+37.67 |
+1.21% |
-25.31% |
| Gold & Silver |
$XAU |
128.76 |
-3.32 |
-2.52% |
-2.78% |
| Bank |
$BKX |
116.54 |
+0.26 |
+0.22% |
-11.86% |
| Biotech |
$BTK |
4,602.01 |
-128.95 |
-2.73% |
-16.61% |
|
|
|
 |
Featured Stocks
Kenneth J. Gruneisen - Passed the CAN SLIM® Master's Exam
|
|
|
Color Codes Explained :
Y - Better candidates highlighted by our
staff of experts.
G - Previously featured
in past reports as yellow but may no longer be buyable under the
guidelines.
***Last / Change / Volume data in this table is the closing quote data***
Symbol/Exchange
Company Name
Industry Group |
PRICE |
CHANGE
(%Change) |
Day High |
Volume
(% DAV)
(% 50 day avg vol) |
52 Wk Hi
% From Hi |
Featured
Date |
Price
Featured |
Pivot Featured |
|
Max Buy |
 CI
-
NYSE
CI
-
NYSE
Cigna Corp
Medical-Managed Care
|
$268.29
|
-4.11
-1.51% |
$273.58
|
3,226,506
219.19% of 50 DAV
50 DAV is 1,472,000
|
$272.97
-1.71%
|
5/6/2022
|
$263.52
|
PP = $269.97
|
|
MB = $283.47
|
 Most Recent Note - 5/31/2022 4:54:50 PM
Y - Touched a new al-time high today but reversed into the red for a volume-driven loss, breaking a streak of 6 consecutive small gains with lighter and below average volume. Its 50 DMA line ($255) defines near-term support to watch. Subsequent gains above the pivot point backed by at least +40% above average volume may trigger a technical buy signal. Fundamentals remain strong.
>>> FEATURED STOCK ARTICLE : Consolidating Above 50-Day Moving Average Near All-Time High - 5/25/2022 |
View all notes |
Set NEW NOTE alert |
Company Profile |
SEC
News |
Chart |
Request a new note
C
A
S
I |
PAG
-
NYSE
Penske Automotive Grp
Retail/Whlsle-Automobile
|
$115.14
|
-1.46
-1.25% |
$117.11
|
269,372
78.08% of 50 DAV
50 DAV is 345,000
|
$119.47
-3.62%
|
5/13/2022
|
$114.88
|
PP = $114.57
|
|
MB = $120.30
|
Most Recent Note - 5/31/2022 4:58:32 PM
Y - Pulled back today with lighter volume following 5 consecutive gains with near average volume. Rebounded back above the previously cited pivot point following a recent pullback. Its 50 DMA line ($104) defines important near term support to watch.
>>> FEATURED STOCK ARTICLE : Breakout With Volume-Driven Gain to New High - 5/13/2022 |
View all notes |
Set NEW NOTE alert |
Company Profile |
SEC
News |
Chart |
Request a new note
C
A
S
I |
LLY
-
NYSE
Eli Lilly & Co
Medical-Diversified
|
$313.26
|
-10.22
-3.16% |
$318.46
|
3,299,134
111.53% of 50 DAV
50 DAV is 2,958,000
|
$324.08
-3.34%
|
5/16/2022
|
$302.46
|
PP = $314.10
|
|
MB = $329.81
|
Most Recent Note - 5/31/2022 4:56:44 PM
Y - Pulled back today with heavy volume, retreating from a new 52-week high following 6 consecutive gains backed by lackluster volume. Its 50 DMA line ($295) recently acted as support. Pivot point cited was based on its 4/07/22 high plus 10 cents. Subsequent gains above the pivot point backed by at least +40% above average volume may trigger a convincing technical buy signal. Fundamentals remain strong.
>>> FEATURED STOCK ARTICLE : Eli Lilly & Co Challenges All-Time High - 5/16/2022 |
View all notes |
Set NEW NOTE alert |
Company Profile |
SEC
News |
Chart |
Request a new note
C
A
S
I |
|
|
|
THESE ARE NOT BUY RECOMMENDATIONS!
Comments contained in the body of this report are technical
opinions only. The material herein has been obtained
from sources believed to be reliable and accurate, however,
its accuracy and completeness cannot be guaranteed.
This site is not an investment advisor, hence it does
not endorse or recommend any securities or other investments.
Any recommendation contained in this report may not
be suitable for all investors and it is not to be deemed
an offer or solicitation on our part with respect to
the purchase or sale of any securities. All trademarks,
service marks and trade names appearing in this report
are the property of their respective owners, and are
likewise used for identification purposes only.
This report is a service available
only to active Paid Premium Members.
You may opt-out of receiving report notifications
at any time. Questions or comments may be submitted
by writing to Premium Membership Services 665 S.E. 10 Street, Suite 201 Deerfield Beach, FL 33441-5634 or by calling 1-800-965-8307
or 954-785-1121.
|
|
|