You are not logged in.
This means you
CAN ONLY VIEW reports that were published prior to Tuesday, April 15, 2025.
You
MUST UPGRADE YOUR MEMBERSHIP if you want to see any current reports.
AFTER MARKET UPDATE - THURSDAY, SEPTEMBER 1ST, 2011
Previous After Market Report Next After Market Report >>>
|
|
|
|
DOW |
-116.02 |
11,497.51 |
-1.00% |
|
Volume |
1,017,925,610 |
-20% |
|
Volume |
1,708,621,930 |
-13% |
|
NASDAQ |
-33.42 |
2,546.04 |
-1.30% |
|
Advancers |
780 |
25% |
|
Advancers |
513 |
19% |
|
S&P 500 |
-14.15 |
1,204.74 |
-1.16% |
|
Decliners |
2,247 |
72% |
|
Decliners |
2,030 |
77% |
|
Russell 2000 |
-17.90 |
708.91 |
-2.46% |
|
52 Wk Highs |
38 |
|
|
52 Wk Highs |
16 |
|
|
S&P 600 |
-8.86 |
387.84 |
-2.23% |
|
52 Wk Lows |
7 |
|
|
52 Wk Lows |
31 |
|
|
 |
Major Averages Fall With Lighter Volume
Kenneth J. Gruneisen - Passed the CAN SLIM® Master's Exam
The Dow Jones Industrial Average, S&P 500 Index, and Nasdaq Composite Index lost ground. Thursday's reported volume totals were light on the NYSE and on the Nasdaq exchange, near the lowest volume totals of the year, as if the institutional crowd had already headed out for the Labor Day weekend. Decliners led advancers by nearly 3-1 on the NYSE and nearly 4-1 on the Nasdaq exchange. On the NYSE new 52-week highs still outnumbered new 52-week lows, but new lows outnumbered new highs on the Nasdaq exchange. There were 14 high-ranked companies from the CANSLIM.net Leaders List that made new 52-week highs and appeared on the CANSLIM.net BreakOuts Page, down from the prior session total of 21 stocks. Any sustainable rally requires a healthy crop of strong leaders hitting new 52-week highs, so we will be watching for further expansion in the new highs list as a reassuring sign of heartier leadership. There were gains for only 3 of the 7 high-ranked leaders currently included on the Featured Stocks Page.
The audience began to decrease ahead of the holiday weekend, however some traders will stick around to pay respect to Friday's report on August jobs. The street welcomed with relief news that the ISM factory index for August declined to 50.6 from 50.9 in July. Analysts were worried the number would drop below 50, signaling a contraction. Instead, it marked the 25th straight month of growth.
Other economic reports gave little reason for optimism. Initial jobless claims declined 12,000 to 409,000 but remain above the threshold that would suggest improvement in the employment market. Productivity of U.S. workers fell more than previously estimated in the second quarter, pushing up labor costs after a record drop in 2010. Treasuries advanced before a government report tomorrow forecast to show the pace of growth in non-farm payrolls is slowing, adding to the trend of weakening economic data.
Retail sales held up pretty well in August. Macy's Inc (M +2.08%) reported better-than-expected results for the month in spite of closings forced by Hurricane Irene. Results at Kohl's Corp (KSS -2.05%) and JC Penney Inc (JCP -1.39%) missed forecasts. U.S. auto sales at General Motors Company (GM -4.16%) topped estimates in August, but shares swerved lower. Sales at Ford Motor Co (F -2.43%) came in below estimates.
Financial and industrial sectors led losses. The Goldman Sachs Group Inc (GS -3.49%) agreed to pay future Federal Reserve penalties and write down $53 million in mortgage loans to gain approval for its sale of Litton Loan Servicing.
The market environment (M criteria) is currently in a confirmed uptrend, which means disciplined investors may carefully consider new buying efforts when all key criteria are satisfied. New leadership has been gradually improving, however volume totals have been quiet behind recent gains, and trading volumes may likely remain subdued until after the upcoming Labor Day weekend. As previously repeated, the indices also remain well below their respective 200-day moving average (DMA) lines, and to be considered truly "healthy" they would need to rebound above their long-term averages.
The September 2011 issue of CANSLIM.net News will be available soon. The Q3 2011 Webcast has also been scheduled for Wednesday, September 28th at 8PM EST. Links to all prior reports and webcasts are available on the Premium Member Homepage.
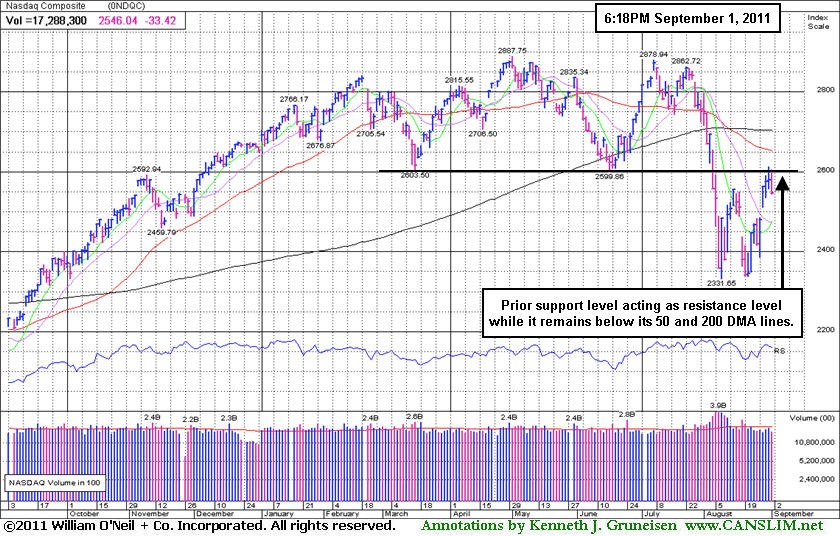
PICTURED: The Nasdaq Composite Index's prior support level near 2,600 is now a likely resistance level. It remains below its 50-day and 200-day moving average (DMA) lines. Subsequent gains above these levels would be an encouraging sign that the market may be capable of a more meaningful advance to and beyond the 2011 highs.
|
 Kenneth J. Gruneisen started out as a licensed stockbroker in August 1987, a couple of months prior to the historic stock market crash that took the Dow Jones Industrial Average down -22.6% in a single day. He has published daily fact-based fundamental and technical analysis on high-ranked stocks online for two decades. Through FACTBASEDINVESTING.COM, Kenneth provides educational articles, news, market commentary, and other information regarding proven investment systems that work in good times and bad.
Comments contained in the body of this report are technical opinions only and are not necessarily those of Gruneisen Growth Corp. The material herein has been obtained from sources believed to be reliable and accurate, however, its accuracy and completeness cannot be guaranteed. Our firm, employees, and customers may effect transactions, including transactions contrary to any recommendation herein, or have positions in the securities mentioned herein or options with respect thereto. Any recommendation contained in this report may not be suitable for all investors and it is not to be deemed an offer or solicitation on our part with respect to the purchase or sale of any securities. |
|
 |
Financial Groups Led Decliners
Kenneth J. Gruneisen - Passed the CAN SLIM® Master's Exam
The Bank Index ($BKX -3.03%) and Broker/Dealer Index ($XBD -2.89%) created the largest drag on the major indices on Thursday. The tech sector faced pressure as the Biotechnology Index ($BTK -2.02%), Semiconductor Index ($SOX -1.67%), Internet Index ($IIX -1.08%), and Networking Index ($NWX -0.44%) ended unanimously lower. Weakness in energy-related shares pushed the Oil Services Index ($OSX -1.03%) and Integrated Oil Index ($XOI -0.87%) lower. The Retail Index ($RLX -1.19%) and Healthcare Index ($HMO -1.10%) also suffered losses, meanwhile the Gold & Silver Index ($XAU +0.61%) was a standout gainer.
Charts courtesy www.stockcharts.com
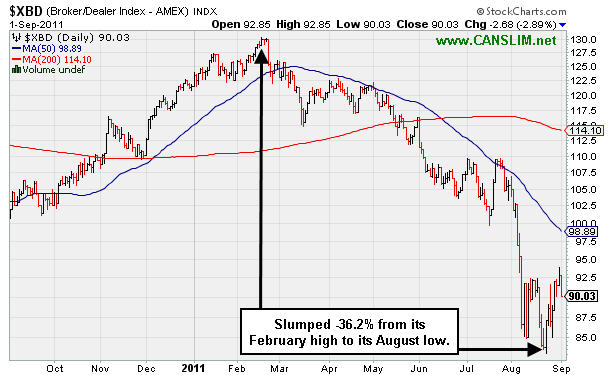
PICTURED: The Broker/Dealer Index ($XBD -2.89%) slumped -36.2% from its February high to its August low. Its 50-day moving average (DMA) line (the blue line) acted as a resistance level in past months when it tried to rally.
| Oil Services |
$OSX |
234.32 |
-2.45 |
-1.03% |
-4.41% |
| Healthcare |
$HMO |
2,059.97 |
-22.83 |
-1.10% |
+21.75% |
| Integrated Oil |
$XOI |
1,154.13 |
-10.13 |
-0.87% |
-4.87% |
| Semiconductor |
$SOX |
349.85 |
-5.94 |
-1.67% |
-15.05% |
| Networking |
$NWX |
238.77 |
-1.06 |
-0.44% |
-14.89% |
| Internet |
$IIX |
284.84 |
-3.11 |
-1.08% |
-7.44% |
| Broker/Dealer |
$XBD |
90.03 |
-2.68 |
-2.89% |
-25.91% |
| Retail |
$RLX |
509.16 |
-6.11 |
-1.19% |
+0.15% |
| Gold & Silver |
$XAU |
219.29 |
+1.33 |
+0.61% |
-3.22% |
| Bank |
$BKX |
38.74 |
-1.21 |
-3.03% |
-25.80% |
| Biotech |
$BTK |
1,170.16 |
-24.08 |
-2.02% |
-9.82% |
|
|
|
 |
Technical Failure Came Before Fundamental Disappointment
Kenneth J. Gruneisen - Passed the CAN SLIM® Master's Exam
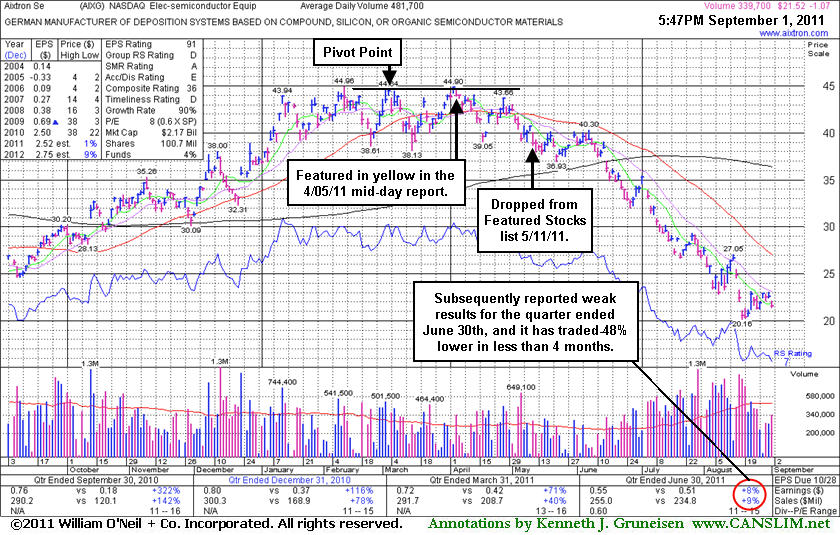
When the number of stocks included on the Featured Stocks page is low, and those currently listed have all received recent analysis in this FSU section, we occasionally go back to revisit a previously featured stock that was dropped. Today we will have another look at a stock that was dropped from the Featured Stocks list back on
Aixtron Se (AIXG $21.52) failed to produce the necessary volume-driven gains above its pivot point to trigger a proper technical buy signal after it was featured back on 4/05/11. It had some explosive characteristics, but as we have often reminded folks, disciplined investors watch for proof of institutional buying demand and avoid the urge to get in "early". In this case, the stock soon slumped under its 50-day moving average line and prior lows triggering technical sell signals, and concerns were noted before and as it was dropped from the Featured Stocks list on 5/11/11. Its last appearance in this FSU section was on 5/06/11 with an annotated graph under the headline, "Relative Strength Waning; Breakout Never Materialized". Cautionary remarks in that report warned - "Quarterly sales and earnings results in recent comparisons have been strong enough to satisfy the C criteria but showing sequential deceleration. Consensus earnings estimates calling for FY '11 earnings to grow by only +4% are also cause for some concern."
This serves as a reminder to all members to wait for proper buy signals before taking action. Also, recognize sell signals and be sure to limit losses whenever any stock falls 7-8% from your purchase price! After AIXG was dropped from the Featured Stocks list it later reported earnings +8% on +9% sales revenues for the quarter ended June 30, 2011 versus the year ago period. Those results were well below the +25% guidelines of the fact-based investment system. As we have often seen, the technical action revealed a problem well before weaker fundamentals became a problem.
|
|
|
Color Codes Explained :
Y - Better candidates highlighted by our
staff of experts.
G - Previously featured
in past reports as yellow but may no longer be buyable under the
guidelines.
***Last / Change / Volume data in this table is the closing quote data***
Symbol/Exchange
Company Name
Industry Group |
PRICE |
CHANGE
(%Change) |
Day High |
Volume
(% DAV)
(% 50 day avg vol) |
52 Wk Hi
% From Hi |
Featured
Date |
Price
Featured |
Pivot Featured |
|
Max Buy |
EXLS
-
NASDAQ
Exlservice Holdings Inc
DIVERSIFIED SERVICES - Business/Management Services
|
$25.97
|
+0.02
0.08% |
$26.31
|
101,121
109.20% of 50 DAV
50 DAV is 92,600
|
$26.46
-1.85%
|
8/2/2011
|
$24.85
|
PP = $24.85
|
|
MB = $26.09
|
Most Recent Note - 8/31/2011 6:42:40 PM
Y - Gain today with above average volume led to a finish 3 cents below its best close of 2011, adding to a recent spurt of volume-driven gains and approaching its "max buy" level. Its 50 DMA line defines important chart support to watch on pullbacks.
>>> The latest Featured Stock Update with an annotated graph appeared on 8/25/2011. Click here.
View all notes |
Alert me of new notes |
CANSLIM.net Company Profile |
SEC |
Zacks Reports |
StockTalk |
News |
Chart |
Request a new note
C
A N
S L
I M


|
FCFS
-
NASDAQ
First Cash Financial Svs
SPECIALTY RETAIL - Specialty Retail, Other
|
$47.32
|
+0.60
1.28% |
$47.99
|
435,019
129.78% of 50 DAV
50 DAV is 335,200
|
$48.19
-1.81%
|
5/31/2011
|
$42.00
|
PP = $40.23
|
|
MB = $42.24
|
 Most Recent Note - 9/1/2011 5:28:14 PM
G - Posted a gain today with above average volume for a new high close. It has not formed a sound new base pattern. Its 50 DMA line defines supports to watch.
>>> The latest Featured Stock Update with an annotated graph appeared on 8/22/2011. Click here.
View all notes |
Alert me of new notes |
CANSLIM.net Company Profile |
SEC |
Zacks Reports |
StockTalk |
News |
Chart |
Request a new note
C
A N
S L
I M
|
JCOM
-
NASDAQ
J 2 Global Communication
INTERNET - Internet Software and Services
|
$31.63
|
-0.32
-1.00% |
$32.50
|
408,351
110.39% of 50 DAV
50 DAV is 369,900
|
$32.64
-3.09%
|
8/8/2011
|
$30.38
|
PP = $29.31
|
|
MB = $30.78
|
Most Recent Note - 8/31/2011 12:48:08 PM
G - Holding its ground today near its 52-week high after a solid volume-driven gain to new highs on the prior session indicative of institutional accumulation. Previous highs in the $30-31 area now define initial chart support on pullbacks.
>>> The latest Featured Stock Update with an annotated graph appeared on 8/29/2011. Click here.
View all notes |
Alert me of new notes |
CANSLIM.net Company Profile |
SEC |
Zacks Reports |
StockTalk |
News |
Chart |
Request a new note
C
A N
S L
I M
|
MA
-
NYSE
Mastercard Inc Cl A
DIVERSIFIED SERVICES - Business/Management Services
|
$330.06
|
+0.35
0.11% |
$335.17
|
1,055,517
69.57% of 50 DAV
50 DAV is 1,517,200
|
$340.42
-3.04%
|
8/3/2011
|
$324.82
|
PP = $322.38
|
|
MB = $338.50
|
Most Recent Note - 8/31/2011 6:45:10 PM
Y - Still perched -3.1% off its 8/03/11 all-time high, quietly consolidating with light volume since recently finding support near its 50 DMA line.
>>> The latest Featured Stock Update with an annotated graph appeared on 8/26/2011. Click here.
View all notes |
Alert me of new notes |
CANSLIM.net Company Profile |
SEC |
Zacks Reports |
StockTalk |
News |
Chart |
Request a new note
C
A N
S L
I M
|
MG
-
NYSE
Mistras Group Inc
DIVERSIFIED SERVICES - Bulding and Faci;ity Management Services
|
$19.36
|
-0.84
-4.16% |
$20.27
|
359,801
230.49% of 50 DAV
50 DAV is 156,100
|
$20.82
-7.01%
|
8/10/2011
|
$17.89
|
PP = $17.58
|
|
MB = $18.46
|
Most Recent Note - 9/1/2011 5:31:32 PM
G - Down today for a second consecutive loss with above average volume indicative of distributional pressure. Previous resistance in the $17-18 area defines important chart support to watch on pullbacks.
>>> The latest Featured Stock Update with an annotated graph appeared on 8/24/2011. Click here.
View all notes |
Alert me of new notes |
CANSLIM.net Company Profile |
SEC |
Zacks Reports |
StockTalk |
News |
Chart |
Request a new note
C
A N
S L
I M
|
Symbol/Exchange
Company Name
Industry Group |
PRICE |
CHANGE
(%Change) |
Day High |
Volume
(% DAV)
(% 50 day avg vol) |
52 Wk Hi
% From Hi |
Featured
Date |
Price
Featured |
Pivot Featured |
|
Max Buy |
MKTX
-
NASDAQ
Marketaxess Holdings Inc
FINANCIAL SERVICES - Investment Brokerage - Nationa
|
$29.35
|
-0.13
-0.44% |
$30.08
|
200,113
80.76% of 50 DAV
50 DAV is 247,800
|
$30.95
-5.17%
|
7/29/2011
|
$25.87
|
PP = $26.35
|
|
MB = $27.67
|
Most Recent Note - 9/1/2011 5:33:21 PM
G - Hovering near its all-time high, holding its ground following a negative reversal on Tuesday after reaching a new high. It is extended from its prior base. Prior resistance in the $25-26 area defines chart support to watch.
>>> The latest Featured Stock Update with an annotated graph appeared on 8/23/2011. Click here.
View all notes |
Alert me of new notes |
CANSLIM.net Company Profile |
SEC |
Zacks Reports |
StockTalk |
News |
Chart |
Request a new note
C
A N
S L
I M
|
PSMT
-
NASDAQ
Pricesmart Inc
RETAIL - Drug Stores
|
$64.38
|
-1.08
-1.65% |
$68.05
|
523,601
197.14% of 50 DAV
50 DAV is 265,600
|
$66.66
-3.42%
|
8/30/2011
|
$63.01
|
PP = $62.37
|
|
MB = $65.49
|
Most Recent Note - 9/1/2011 5:38:09 PM
Y - After hitting another new 52-week high today there was a negative reversal and it closed near the session low with a loss on higher above average volume. It slumped below its "max buy" level and its color code is changed to yellow. Prior highs near $62 define initial chart support to watch.
>>> The latest Featured Stock Update with an annotated graph appeared on 8/30/2011. Click here.
View all notes |
Alert me of new notes |
CANSLIM.net Company Profile |
SEC |
Zacks Reports |
StockTalk |
News |
Chart |
Request a new note
C
A N
S L
I M
|
|
|
|
THESE ARE NOT BUY RECOMMENDATIONS!
Comments contained in the body of this report are technical
opinions only. The material herein has been obtained
from sources believed to be reliable and accurate, however,
its accuracy and completeness cannot be guaranteed.
This site is not an investment advisor, hence it does
not endorse or recommend any securities or other investments.
Any recommendation contained in this report may not
be suitable for all investors and it is not to be deemed
an offer or solicitation on our part with respect to
the purchase or sale of any securities. All trademarks,
service marks and trade names appearing in this report
are the property of their respective owners, and are
likewise used for identification purposes only.
This report is a service available
only to active Paid Premium Members.
You may opt-out of receiving report notifications
at any time. Questions or comments may be submitted
by writing to Premium Membership Services 665 S.E. 10 Street, Suite 201 Deerfield Beach, FL 33441-5634 or by calling 1-800-965-8307
or 954-785-1121.
|
|
|

