You are not logged in.
This means you
CAN ONLY VIEW reports that were published prior to Tuesday, April 15, 2025.
You
MUST UPGRADE YOUR MEMBERSHIP if you want to see any current reports.
AFTER MARKET UPDATE - FRIDAY, SEPTEMBER 2ND, 2011
Previous After Market Report Next After Market Report >>>
|
|
|
|
DOW |
-253.31 |
11,240.26 |
-2.20% |
|
Volume |
975,155,080 |
-4% |
|
Volume |
1,546,771,760 |
-9% |
|
NASDAQ |
-65.71 |
2,480.33 |
-2.58% |
|
Advancers |
440 |
14% |
|
Advancers |
380 |
14% |
|
S&P 500 |
-30.45 |
1,173.97 |
-2.53% |
|
Decliners |
2,598 |
84% |
|
Decliners |
2,186 |
83% |
|
Russell 2000 |
-25.56 |
683.36 |
-3.61% |
|
52 Wk Highs |
10 |
|
|
52 Wk Highs |
10 |
|
|
S&P 600 |
-13.99 |
374.05 |
-3.61% |
|
52 Wk Lows |
40 |
|
|
52 Wk Lows |
107 |
|
|
 |
Breadth Was Poor and Leadership Waned Ahead of Labor Day Weekend
Kenneth J. Gruneisen - Passed the CAN SLIM® Master's Exam
It has been a rough start to September on Wall Street. The major averages sold off deeply at the open and remained sharply lower throughout Friday's session. For the week, the Dow Jones Industrial Average fell -0.4%, S&P 500 Index lost -0.2%, and the Nasdaq Composite Index finished marginally above unchanged. Friday's reported volume totals were lighter on the NYSE and on the Nasdaq exchange, as expected ahead of the Labor Day weekend, with the market to remain closed on Monday. Winners were few as declining issues buried advancers by nearly 6-1 on the NYSE and on the Nasdaq exchange. New 52-week lows expanded and substantially outnumbered new 52-week highs on both major exchanges. There were 6 high-ranked companies from the CANSLIM.net Leaders List that made new 52-week highs and appeared on the CANSLIM.net BreakOuts Page, down from the prior session total of 14 stocks. Any sustainable rally requires a healthy crop of strong leaders hitting new 52-week highs, as this commentary has repeated! The contraction in leadership raises some questions about the current rally's strength and its ability to be sustained for a meaningful advance. There were losses for all of the 7 high-ranked leaders currently included on the Featured Stocks Page.
Stocks were sharply lower after the weakest government reading on jobs in almost a year. The Labor Department said payrolls were unchanged in August, worse than even the meager gain of about 65,000 that analysts were projecting. Hourly earnings and hours worked both declined, while the August unemployment rate remained at 9.1%.
European markets weakened as snags re-emerged in the continent’s crisis management effort. The DAX in Germany fell -3.4%. Italian bond yields rose for the tenth day as that nation's austerity package appeared to unravel. Major US banks including Bank of America Corp (BAC -8.43%), Citigroup Inc (C -5.33%), and JP Morgan Chase & Co (JPM -4.36%) faced additional pressure on the heels of a published report saying federal lawsuits are pending over the quality of mortgage securities. The suits will reportedly seek billions of dollars in compensation.
Netflix Inc (NFLX -8.64%) fell hard after the premium cable channel Starz said it would not renew its closely-watched distribution deal with the company. Gold mining stocks including Barrick Gold Corp (ABX +2.32%) and Newmont Mining Corp (NEM +3.20%) were among the few left standing at Friday's end as gold prices jumped the most in four weeks. Meanwhile, the 10-year Treasury note rallied more than a full point to yield 2.00%.
The market environment (M criteria) is currently in a confirmed uptrend, which means disciplined investors may carefully consider new buying efforts when all key criteria are satisfied. As previously repeated, the indices also remain well below their respective 200-day moving average (DMA) lines, and to be considered truly "healthy" they would need to rebound above their long-term averages.
The September 2011 issue of CANSLIM.net News will be available soon. The Q3 2011 Webcast has also been scheduled for Wednesday, September 28th at 8PM EST. Links to all prior reports and webcasts are available on the Premium Member Homepage.
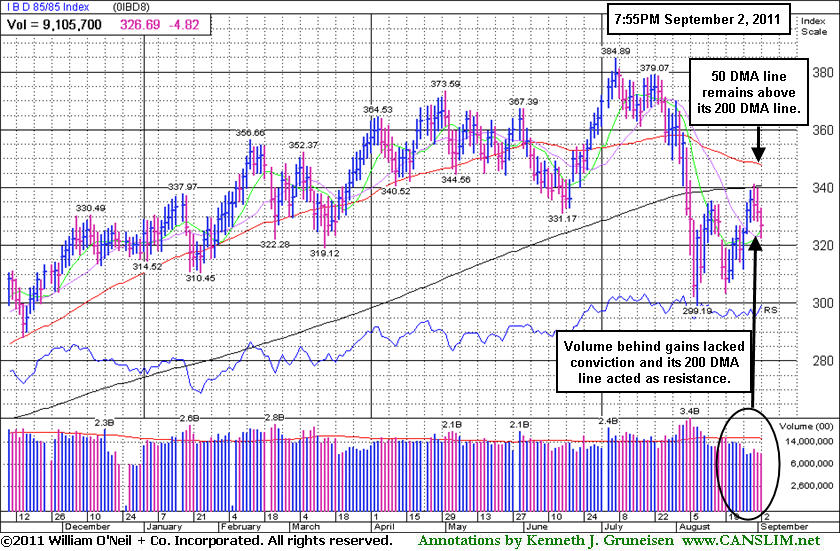
PICTURED: The IBD 85-85 Index of high-ranked stocks ran into resistance near its 200 DMA line after recent gains lacking great volume conviction. Its 50 DMA line remains above its 200 DMA line. This distinction suggests that fundamentally superior stocks may, on average, be recently outperforming other stocks which make up the market's popular major indices. That characteristic stands in contrast with the Dow Jones Industrial Average, S&P 500 Index, and the Nasdaq Composite Index at present. As a result of the recent market correction, the three major averages each has seen its 50 DMA converge and cross below its respective 200 DMA line, ominously termed a "death cross" by technicians.
|
 Kenneth J. Gruneisen started out as a licensed stockbroker in August 1987, a couple of months prior to the historic stock market crash that took the Dow Jones Industrial Average down -22.6% in a single day. He has published daily fact-based fundamental and technical analysis on high-ranked stocks online for two decades. Through FACTBASEDINVESTING.COM, Kenneth provides educational articles, news, market commentary, and other information regarding proven investment systems that work in good times and bad.
Comments contained in the body of this report are technical opinions only and are not necessarily those of Gruneisen Growth Corp. The material herein has been obtained from sources believed to be reliable and accurate, however, its accuracy and completeness cannot be guaranteed. Our firm, employees, and customers may effect transactions, including transactions contrary to any recommendation herein, or have positions in the securities mentioned herein or options with respect thereto. Any recommendation contained in this report may not be suitable for all investors and it is not to be deemed an offer or solicitation on our part with respect to the purchase or sale of any securities. |
|
 |
Leadership From "Defensive" Mining - Gold/Silver/Gems Group
Kenneth J. Gruneisen - Passed the CAN SLIM® Master's Exam
The financial group poisoned the market again as the Bank Index ($BKX -4.49%) and Broker/Dealer Index ($XBD -4.10%) suffered large losses. The tech sector slumped as the Networking Index ($NWX -4.08%), Internet Index ($IIX -2.88%), Semiconductor Index ($SOX -2.40%), and Biotechnology Index ($BTK -1.91% ) suffered unanimous losses. Energy-related shares were also weak as the Oil Services Index ($OSX -3.33%) and Integrated Oil Index ($XOI -2.67%) sank. The Retail Index ($RLX -2.45%) and Healthcare Index ($HMO -3.01%) rounded out Friday's widely negative session, meanwhile the Gold & Silver Index ($XAU +1.60%) was a standout gainer.
Charts courtesy www.stockcharts.com
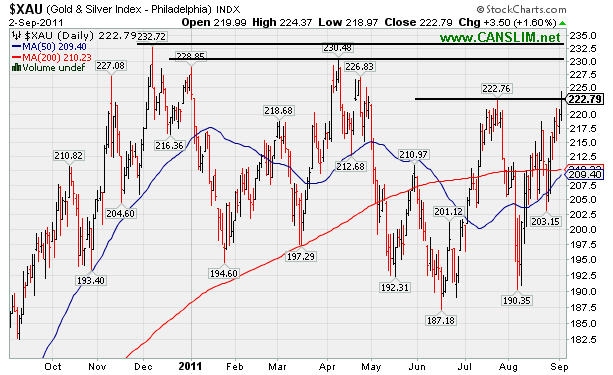
PICTURED: The Gold & Silver Index ($XAU +1.60%) has rallied into an area where this year, and in late 2010, it encountered resistance. Regular readers may have likely noticed the increasing number of companies from the Mining - Gold/Silver Gems shares group noted in the routine screenings for the CANSLIM.net Mid-Day BreakOuts Report. Most companies have been noted for flaws in the earnings histories which make them questionable candidates for disciplined followers of the fact-based investment system.
| Oil Services |
$OSX |
226.52 |
-7.80 |
-3.33% |
-7.59% |
| Healthcare |
$HMO |
1,997.92 |
-62.05 |
-3.01% |
+18.08% |
| Integrated Oil |
$XOI |
1,123.37 |
-30.76 |
-2.67% |
-7.40% |
| Semiconductor |
$SOX |
341.46 |
-8.39 |
-2.40% |
-17.09% |
| Networking |
$NWX |
229.02 |
-9.75 |
-4.08% |
-18.37% |
| Internet |
$IIX |
276.65 |
-8.19 |
-2.88% |
-10.10% |
| Broker/Dealer |
$XBD |
86.35 |
-3.69 |
-4.10% |
-28.94% |
| Retail |
$RLX |
496.67 |
-12.49 |
-2.45% |
-2.30% |
| Gold & Silver |
$XAU |
222.79 |
+3.50 |
+1.60% |
-1.67% |
| Bank |
$BKX |
37.00 |
-1.74 |
-4.49% |
-29.13% |
| Biotech |
$BTK |
1,147.81 |
-22.35 |
-1.91% |
-11.55% |
|
|
|
 |
Volume Totals Cooling While Hovering Near Highs
Kenneth J. Gruneisen - Passed the CAN SLIM® Master's Exam
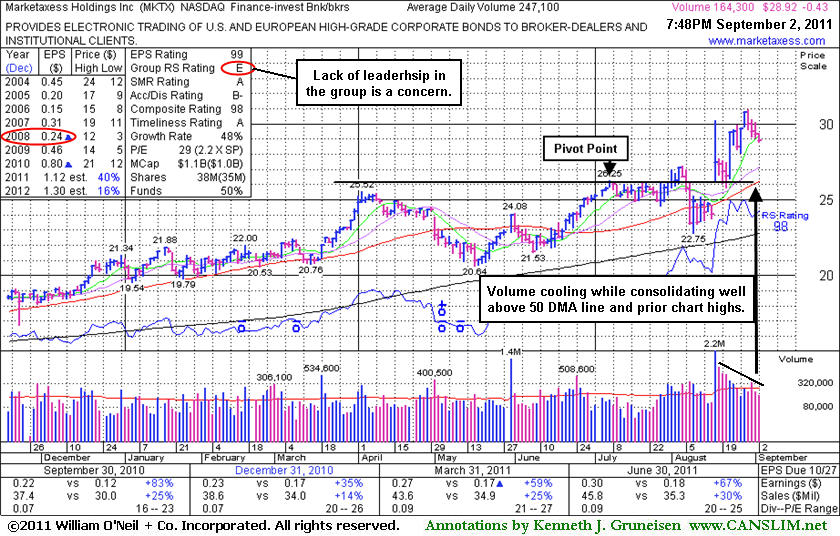
Marketaxess Holdings Inc's (MKTX -$0.43 or -1.47% to $28.92) daily volume totals have been cooling while hovering near its all-time high. Its last appearance was in this FSU section was on 8/23/11 with an annotated graph under the headline, "Outlier's Gains Have Distanced It From Prior Base". It has been holding its ground stubbornly following a negative reversal on 8/30/11 after reaching a new high. It is extended from its prior base. Meanwhile, prior resistance in the $25-26 area defines chart support to watch along with its 50-day moving average (DMA) line. It proved resilient near that short-term average in the past after undercutting it, and it stayed above its longer-term 200 DMA line. MKTX has earned high ranks and reasonably satisfies the guidelines concerning quarterly and annual earnings (C and A criteria), however a downturn in FY '08 (see red oval) was previously noted as a flaw. Additionally, the Finance - Investment Bankers industry group currently has a Relative Strength rating of E which indicates the group has been a poor performer rather than a strong leader (L criteria). The number of top-rated funds owning its shares rose from 195 in Dec '10 to 229 in Jun '11, a reassuring sign concerning the I criteria.
All prior notes can be reviewed on the Company Profile page under the "View All Notes" tab. The "Featured Articles and Daily Graphs" tab on the Company Profile page allows members to view all of the previous detailed analysis and annotated graphs published on any stocks we have covered.
|
|
|
Color Codes Explained :
Y - Better candidates highlighted by our
staff of experts.
G - Previously featured
in past reports as yellow but may no longer be buyable under the
guidelines.
***Last / Change / Volume data in this table is the closing quote data***
Symbol/Exchange
Company Name
Industry Group |
PRICE |
CHANGE
(%Change) |
Day High |
Volume
(% DAV)
(% 50 day avg vol) |
52 Wk Hi
% From Hi |
Featured
Date |
Price
Featured |
Pivot Featured |
|
Max Buy |
EXLS
-
NASDAQ
Exlservice Holdings Inc
DIVERSIFIED SERVICES - Business/Management Services
|
$25.55
|
-0.42
-1.62% |
$26.05
|
93,603
99.79% of 50 DAV
50 DAV is 93,800
|
$26.46
-3.44%
|
8/2/2011
|
$24.85
|
PP = $24.85
|
|
MB = $26.09
|
 Most Recent Note - 9/2/2011 7:29:27 PM
Y - Quietly finished the week near its 2011 high, holding its ground just under its "max buy" level after a spurt of volume-driven gains. Its 50 DMA line defines important chart support to watch on pullbacks.
>>> The latest Featured Stock Update with an annotated graph appeared on 8/25/2011. Click here.
View all notes |
Alert me of new notes |
CANSLIM.net Company Profile |
SEC |
Zacks Reports |
StockTalk |
News |
Chart |
Request a new note
C
A N
S L
I M


|
FCFS
-
NASDAQ
First Cash Financial Svs
SPECIALTY RETAIL - Specialty Retail, Other
|
$46.15
|
-1.17
-2.47% |
$47.17
|
353,888
103.75% of 50 DAV
50 DAV is 341,100
|
$48.19
-4.23%
|
5/31/2011
|
$42.00
|
PP = $40.23
|
|
MB = $42.24
|
Most Recent Note - 9/2/2011 7:31:04 PM
G - Quietly ended the week near its all-time high after gains with above average volume. It has not formed a sound new base pattern. Its 50 DMA line defines supports to watch.
>>> The latest Featured Stock Update with an annotated graph appeared on 8/22/2011. Click here.
View all notes |
Alert me of new notes |
CANSLIM.net Company Profile |
SEC |
Zacks Reports |
StockTalk |
News |
Chart |
Request a new note
C
A N
S L
I M
|
JCOM
-
NASDAQ
J 2 Global Communication
INTERNET - Internet Software and Services
|
$31.02
|
-0.61
-1.93% |
$31.57
|
516,488
137.91% of 50 DAV
50 DAV is 374,500
|
$32.64
-4.96%
|
8/8/2011
|
$30.38
|
PP = $29.31
|
|
MB = $30.78
|
Most Recent Note - 9/2/2011 7:32:51 PM
G - Pulled back today for its 3rd consecutive loss after reaching a new 52-week high this week with a solid volume-driven gain on 8/30/11 indicative of institutional accumulation. Previous highs in the $30-31 area now define initial chart support on pullbacks.
>>> The latest Featured Stock Update with an annotated graph appeared on 8/29/2011. Click here.
View all notes |
Alert me of new notes |
CANSLIM.net Company Profile |
SEC |
Zacks Reports |
StockTalk |
News |
Chart |
Request a new note
C
A N
S L
I M
|
MA
-
NYSE
Mastercard Inc Cl A
DIVERSIFIED SERVICES - Business/Management Services
|
$320.68
|
-9.38
-2.84% |
$326.62
|
872,186
57.10% of 50 DAV
50 DAV is 1,527,500
|
$340.42
-5.80%
|
8/3/2011
|
$324.82
|
PP = $322.38
|
|
MB = $338.50
|
Most Recent Note - 9/2/2011 7:34:45 PM
Y - Still perched -5.8% off its 8/03/11 all-time high, quietly consolidating with volume totals cooling. Support to watch is its 50 DMA line ($312).
>>> The latest Featured Stock Update with an annotated graph appeared on 8/26/2011. Click here.
View all notes |
Alert me of new notes |
CANSLIM.net Company Profile |
SEC |
Zacks Reports |
StockTalk |
News |
Chart |
Request a new note
C
A N
S L
I M
|
MG
-
NYSE
Mistras Group Inc
DIVERSIFIED SERVICES - Bulding and Faci;ity Management Services
|
$19.15
|
-1.05
-5.20% |
$19.53
|
199,817
123.34% of 50 DAV
50 DAV is 162,000
|
$20.82
-8.02%
|
8/10/2011
|
$17.89
|
PP = $17.58
|
|
MB = $18.46
|
Most Recent Note - 9/2/2011 7:36:33 PM
G - Finished in the upper half of its intra-day range today, but ended with its 3rd consecutive loss with above average volume, action indicative of distributional pressure. Previous resistance in the $17-18 area defines important chart support to watch on pullbacks.
>>> The latest Featured Stock Update with an annotated graph appeared on 8/24/2011. Click here.
View all notes |
Alert me of new notes |
CANSLIM.net Company Profile |
SEC |
Zacks Reports |
StockTalk |
News |
Chart |
Request a new note
C
A N
S L
I M
|
Symbol/Exchange
Company Name
Industry Group |
PRICE |
CHANGE
(%Change) |
Day High |
Volume
(% DAV)
(% 50 day avg vol) |
52 Wk Hi
% From Hi |
Featured
Date |
Price
Featured |
Pivot Featured |
|
Max Buy |
MKTX
-
NASDAQ
Marketaxess Holdings Inc
FINANCIAL SERVICES - Investment Brokerage - Nationa
|
$28.92
|
-0.43
-1.47% |
$29.37
|
174,063
70.44% of 50 DAV
50 DAV is 247,100
|
$30.95
-6.56%
|
7/29/2011
|
$25.87
|
PP = $26.35
|
|
MB = $27.67
|
Most Recent Note - 9/2/2011 7:38:21 PM
G - Volume totals have been cooling while hovering near its all-time high. Holding its ground stubbornly following a negative reversal on 8/30/11 after reaching a new high. It is extended from its prior base. Prior resistance in the $25-26 area defines chart support to watch.
>>> The latest Featured Stock Update with an annotated graph appeared on 9/2/2011. Click here.
View all notes |
Alert me of new notes |
CANSLIM.net Company Profile |
SEC |
Zacks Reports |
StockTalk |
News |
Chart |
Request a new note
C
A N
S L
I M
|
PSMT
-
NASDAQ
Pricesmart Inc
RETAIL - Drug Stores
|
$62.81
|
-1.57
-2.44% |
$63.81
|
359,507
131.54% of 50 DAV
50 DAV is 273,300
|
$68.05
-7.70%
|
8/30/2011
|
$63.01
|
PP = $62.37
|
|
MB = $65.49
|
Most Recent Note - 9/2/2011 7:43:01 PM
Y - After its negative reversal on 9/01/11 it gapped down today, testing its prior highs near $62 previously noted as defining initial chart support to watch. A subsequent close under its old high close ($61.54 on 8/03/11) would completely negate the recent technical breakout.
>>> The latest Featured Stock Update with an annotated graph appeared on 8/30/2011. Click here.
View all notes |
Alert me of new notes |
CANSLIM.net Company Profile |
SEC |
Zacks Reports |
StockTalk |
News |
Chart |
Request a new note
C
A N
S L
I M
|
|
|
|
THESE ARE NOT BUY RECOMMENDATIONS!
Comments contained in the body of this report are technical
opinions only. The material herein has been obtained
from sources believed to be reliable and accurate, however,
its accuracy and completeness cannot be guaranteed.
This site is not an investment advisor, hence it does
not endorse or recommend any securities or other investments.
Any recommendation contained in this report may not
be suitable for all investors and it is not to be deemed
an offer or solicitation on our part with respect to
the purchase or sale of any securities. All trademarks,
service marks and trade names appearing in this report
are the property of their respective owners, and are
likewise used for identification purposes only.
This report is a service available
only to active Paid Premium Members.
You may opt-out of receiving report notifications
at any time. Questions or comments may be submitted
by writing to Premium Membership Services 665 S.E. 10 Street, Suite 201 Deerfield Beach, FL 33441-5634 or by calling 1-800-965-8307
or 954-785-1121.
|
|
|

