You are not logged in.
This means you
CAN ONLY VIEW reports that were published prior to Tuesday, April 15, 2025.
You
MUST UPGRADE YOUR MEMBERSHIP if you want to see any current reports.
AFTER MARKET UPDATE - WEDNESDAY, AUGUST 31ST, 2011
Previous After Market Report Next After Market Report >>>
|
|
|
|
DOW |
+53.58 |
11,613.53 |
+0.46% |
|
Volume |
1,265,132,000 |
+24% |
|
Volume |
1,957,326,810 |
+7% |
|
NASDAQ |
+3.35 |
2,579.46 |
+0.13% |
|
Advancers |
1,962 |
63% |
|
Advancers |
1,271 |
48% |
|
S&P 500 |
+5.97 |
1,218.89 |
+0.49% |
|
Decliners |
1,075 |
34% |
|
Decliners |
1,290 |
48% |
|
Russell 2000 |
-1.28 |
726.80 |
-0.18% |
|
52 Wk Highs |
43 |
|
|
52 Wk Highs |
23 |
|
|
S&P 600 |
-0.35 |
396.70 |
-0.09% |
|
52 Wk Lows |
6 |
|
|
52 Wk Lows |
13 |
|
|
 |
Resilient Indices Rise Again With Slightly Higher Volume
Kenneth J. Gruneisen - Passed the CAN SLIM® Master's Exam
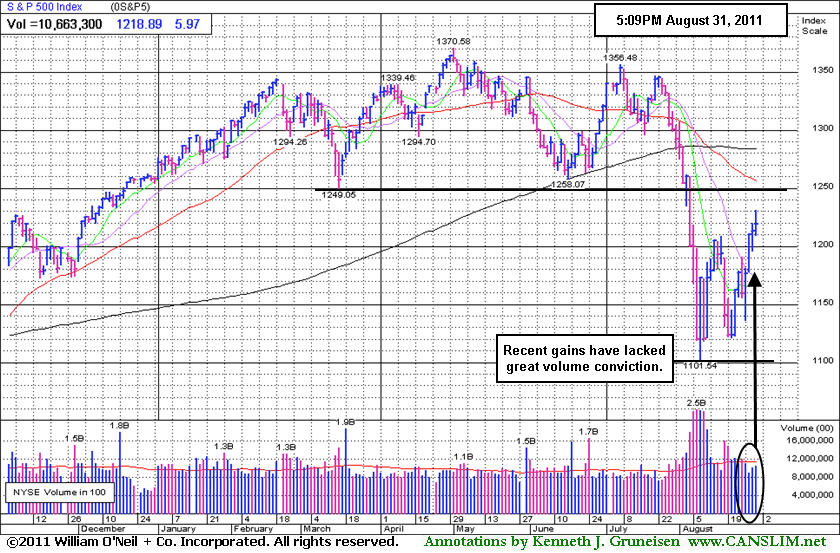
Early gains for the Dow Jones Industrial Average, S&P 500 Index, and Nasdaq Composite Index evaporated and the indices slumped into the red before a late surge on Wall Street, led by some influential financial stocks, rescued the market from an up-and-down session. Wednesday's volume totals were reported slightly higher on the NYSE and on the Nasdaq exchange, again revealing better buying conviction coming from the institutional crowd. Advancing issues led decliners by nearly 2-1 on the NYSE, however decliners narrowly led advancers on the Nasdaq exchange. On the NYSE and on the Nasdaq exchange new 52-week highs outnumbered new 52-week lows again, after the prior session marked the first time since July 25th that new 52-week highs outnumbered the new 52-week lows on both major stock exchanges. There were 21 high-ranked companies from the CANSLIM.net Leaders List that made new 52-week highs and appeared on the CANSLIM.net BreakOuts Page, down from the prior session total of 27 stocks. Any sustainable rally requires a healthy crop of strong leaders hitting new 52-week highs, so we will be watching for further expansion in the new highs list as a reassuring sign of heartier leadership. In contrast with the market's better breadth, however, there were gains for only 2 of the 7 high-ranked leaders currently included on the Featured Stocks Page.
The Dow was up as many as 152 points in early trading, and although it closed with only a 53 point gain, it managed to erase its loss for the year. The Justice Department sued to block AT&T Inc's (T -3.85%) $39 billion acquisition of mobile competitor T-Mobile USA. Shares of Sprint Nextel Corp (S +5.92%) rose as some analysts speculated that Sprint could make a bid for T-Mobile if AT&T abandons the deal. Shares of Joy Global Inc (JOYG +1.32%) rose after the company raised its full year earnings forecast, but it ended well off the session highs.
The market reacted well to economic releases. July factory orders rose +2.4%, the most in four months, boosted by demand for motor vehicles and aircraft. The Chicago purchasing managers index showed business activity is expanding at a slower pace, but the result was still better than expected. ADP's measure of U.S. job growth in August was slightly weaker than forecast, but appeared to reassure investors that the economy is not sinking into recession.
Strong European markets set the early tone on Wall Street. The benchmark index in Germany climbed +2.5% after the German Cabinet approved an increase in the European bank rescue fund. However, the market remains sensitive to developments in Europe, and a worrisome forecast out of Greece presented a late hurdle for the market. The Greek parliament said the deepening recession in that country will weigh on sovereign debt.
The market environment (M criteria) is currently in a confirmed uptrend, which means disciplined investors may carefully consider new buying efforts when all key criteria are satisfied. New leadership has been gradually improving, however volume totals have been quiet behind recent gains, and trading volumes may likely remain subdued until after the upcoming Labor Day weekend. As previously repeated, the indices also remain well below their respective 200-day moving average (DMA) lines, and to be considered truly "healthy" they would need to rebound above their long-term averages.
The September 2011 issue of CANSLIM.net News will be available soon. The Q3 2011 Webcast has also been scheduled for Wednesday, September 28th at 8PM EST. Links to all prior reports and webcasts are available on the Premium Member Homepage.
PICTURED: The S&P 500 Index finished well up from the month's low, but it was down about -5.8% for the month of August, extending its losing streak to 4 consecutive months.
|
 Kenneth J. Gruneisen started out as a licensed stockbroker in August 1987, a couple of months prior to the historic stock market crash that took the Dow Jones Industrial Average down -22.6% in a single day. He has published daily fact-based fundamental and technical analysis on high-ranked stocks online for two decades. Through FACTBASEDINVESTING.COM, Kenneth provides educational articles, news, market commentary, and other information regarding proven investment systems that work in good times and bad.
Comments contained in the body of this report are technical opinions only and are not necessarily those of Gruneisen Growth Corp. The material herein has been obtained from sources believed to be reliable and accurate, however, its accuracy and completeness cannot be guaranteed. Our firm, employees, and customers may effect transactions, including transactions contrary to any recommendation herein, or have positions in the securities mentioned herein or options with respect thereto. Any recommendation contained in this report may not be suitable for all investors and it is not to be deemed an offer or solicitation on our part with respect to the purchase or sale of any securities. |
|
 |
Financial Groups Gave Major Averages a Boost
Kenneth J. Gruneisen - Passed the CAN SLIM® Master's Exam
Positive action in the Bank Index ($BKX +1.22%) and Broker/Dealer Index ($XBD +1.36%) underpinned the major averages' gains on Wednesday. Weakness in the Semiconductor Index ($SOX -0.68%) and Networking Index ($NWX -0.56%) was mostly offset by modest gains from the Biotechnology Index ($BTK +0.17%) and Internet Index ($IIX +0.60%). Gains from the Retail Index ($RLX +0.42%) and a modestly positive bias for energy--related shares helped the Oil Services Index ($OSX +0.52%) and Integrated Oil Index ($XOI +1.07%) rise. Defensive groups were on the quiet side and mixed as the Healthcare Index ($HMO +0.28%) edged higher while the Gold & Silver Index ($XAU -0.25%) edged lower.
Charts courtesy www.stockcharts.com
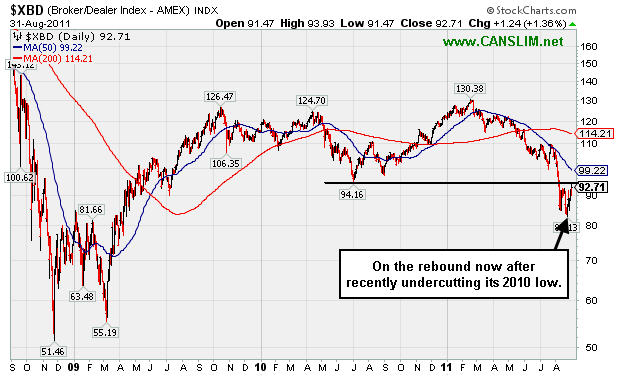
PICTURED: The 3-year chart of the Broker/Dealer Index ($XBD +1.36%) shows that it has recently been rebounding after undercutting its 2010 lows.
| Oil Services |
$OSX |
236.77 |
+1.22 |
+0.52% |
-3.41% |
| Healthcare |
$HMO |
2,082.79 |
+5.82 |
+0.28% |
+23.10% |
| Integrated Oil |
$XOI |
1,164.26 |
+12.31 |
+1.07% |
-4.03% |
| Semiconductor |
$SOX |
355.79 |
-2.44 |
-0.68% |
-13.61% |
| Networking |
$NWX |
239.83 |
-1.35 |
-0.56% |
-14.52% |
| Internet |
$IIX |
287.95 |
+1.71 |
+0.60% |
-6.43% |
| Broker/Dealer |
$XBD |
92.71 |
+1.24 |
+1.36% |
-23.70% |
| Retail |
$RLX |
515.27 |
+2.17 |
+0.42% |
+1.36% |
| Gold & Silver |
$XAU |
217.96 |
-0.55 |
-0.25% |
-3.80% |
| Bank |
$BKX |
39.95 |
+0.48 |
+1.22% |
-23.48% |
| Biotech |
$BTK |
1,194.24 |
+1.98 |
+0.17% |
-7.97% |
|
|
|
 |
Damaging Losses Violated 200 DMA Line Since Dropped 5 Weeks Ago
Kenneth J. Gruneisen - Passed the CAN SLIM® Master's Exam
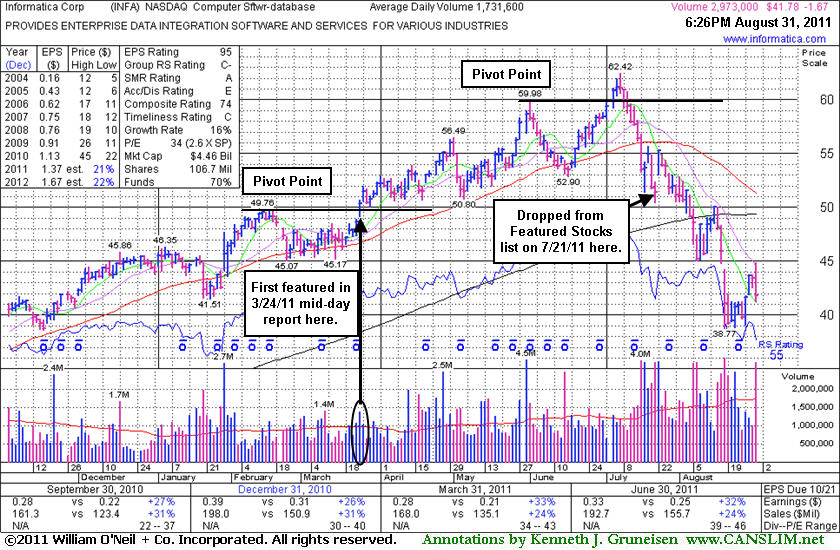
When the number of stocks included on the Featured Stocks page is low, and those currently listed have all received recent analysis in this FSU section, we occasionally go back to revisit a previously featured stock that was dropped. Today we will have another look at a stock that was dropped from the Featured Stocks list back on July 21, 2011.
Informatica Corp. (INFA $41.78) was last noted 7/21/2011 3:07:54 PM - "Due to report earnings following today's close. Losses with above average volume have raised more concerns after its 50 DMA line acted as resistance. Based on recent technical weakness it will be dropped from the Featured Stocks list tonight." Then it reported +32% earnings on +24% sales revenues for the quarter ended June 30, 2011 versus the year ago period. Its apparently strong fundamentals failed to prevent a subsequent slide from $51.40 to as low as $38.77 in recent weeks, a -24.6% decline from when it was dropped less than 5 weeks ago. This serves as a reminder to all members to recognize sell signals and be sure to lock in profits, and also cut losses whenever any stock falls 7-8% from your purchase price!
INFA's last appearance in this FSU section was on 7/12/11 under the headline, "Falling Under New Pivot Point Without Triggering Fresh Buy Signal", as it was pulling back, consolidating below a new pivot point. This high-ranked Computer Software - Database firm faced no resistance due to overhead supply then, and it had been doing well after an earlier breakout. On July 1st its color code was changed to yellow as a new pivot point was cited based on a new short flat base pattern. Although it quietly wedged above the pivot point, it was noted that the gains came without sufficient volume to trigger a new (or add-on) technical buy signal. Disciplined investors know to always watch for a volume-driven breakout gain above the pivot point with a minimum of at least +40-50% above average volume to trigger a convincing technical buy signal before taking action.
From the stock's Company Profile page members can review all prior notes and analysis. After the 3/24/11 mid-day report (read here) first highlighted INFA in yellow at $50.04 it had traded as much as +24.7% higher. Quarterly earnings increases (C criteria) were all above the +25% minimum guidelines and it also maintained a steady annual earnings (A criteria) history. Disciplined investors know, however, that even if earnings are good, the technical action is what dictates sound decision making. There is a large amount of overhead supply that will act as resistance while it is now -33% off its high. The number of top-rated funds owning its shares rose from 652 in Dec '10 to 764 in Jun '11, a reassuring sign concerning the I criteria. However, its current Up/Down Volume Ratio of 0.6 is an unbiased indication that it has been recently enduring distributional pressure, suggesting that future data may reveal waning ownership by top-rated funds.
|
|
|
Color Codes Explained :
Y - Better candidates highlighted by our
staff of experts.
G - Previously featured
in past reports as yellow but may no longer be buyable under the
guidelines.
***Last / Change / Volume data in this table is the closing quote data***
Symbol/Exchange
Company Name
Industry Group |
PRICE |
CHANGE
(%Change) |
Day High |
Volume
(% DAV)
(% 50 day avg vol) |
52 Wk Hi
% From Hi |
Featured
Date |
Price
Featured |
Pivot Featured |
|
Max Buy |
EXLS
-
NASDAQ
Exlservice Holdings Inc
DIVERSIFIED SERVICES - Business/Management Services
|
$25.95
|
+0.15
0.58% |
$26.15
|
152,917
169.34% of 50 DAV
50 DAV is 90,300
|
$26.46
-1.93%
|
8/2/2011
|
$24.85
|
PP = $24.85
|
|
MB = $26.09
|
 Most Recent Note - 8/31/2011 6:42:40 PM
Y - Gain today with above average volume led to a finish 3 cents below its best close of 2011, adding to a recent spurt of volume-driven gains and approaching its "max buy" level. Its 50 DMA line defines important chart support to watch on pullbacks.
>>> The latest Featured Stock Update with an annotated graph appeared on 8/25/2011. Click here.
View all notes |
Alert me of new notes |
CANSLIM.net Company Profile |
SEC |
Zacks Reports |
StockTalk |
News |
Chart |
Request a new note
C
A N
S L
I M


|
FCFS
-
NASDAQ
First Cash Financial Svs
SPECIALTY RETAIL - Specialty Retail, Other
|
$46.72
|
-0.22
-0.47% |
$48.19
|
493,976
150.19% of 50 DAV
50 DAV is 328,900
|
$47.80
-2.26%
|
5/31/2011
|
$42.00
|
PP = $40.23
|
|
MB = $42.24
|
Most Recent Note - 8/31/2011 12:32:07 PM
G - Touched a new 52-week high with today's early gain then reversed into the red. It has not formed a sound new base pattern. Recently found support near its 50 DMA line. Prior lows near $37-38 define additional chart support to watch.
>>> The latest Featured Stock Update with an annotated graph appeared on 8/22/2011. Click here.
View all notes |
Alert me of new notes |
CANSLIM.net Company Profile |
SEC |
Zacks Reports |
StockTalk |
News |
Chart |
Request a new note
C
A N
S L
I M
|
JCOM
-
NASDAQ
J 2 Global Communication
INTERNET - Internet Software and Services
|
$31.95
|
-0.05
-0.16% |
$32.32
|
743,866
206.80% of 50 DAV
50 DAV is 359,700
|
$32.64
-2.11%
|
8/8/2011
|
$30.38
|
PP = $29.31
|
|
MB = $30.78
|
Most Recent Note - 8/31/2011 12:48:08 PM
G - Holding its ground today near its 52-week high after a solid volume-driven gain to new highs on the prior session indicative of institutional accumulation. Previous highs in the $30-31 area now define initial chart support on pullbacks.
>>> The latest Featured Stock Update with an annotated graph appeared on 8/29/2011. Click here.
View all notes |
Alert me of new notes |
CANSLIM.net Company Profile |
SEC |
Zacks Reports |
StockTalk |
News |
Chart |
Request a new note
C
A N
S L
I M
|
MA
-
NYSE
Mastercard Inc Cl A
DIVERSIFIED SERVICES - Business/Management Services
|
$329.71
|
-0.02
-0.01% |
$335.75
|
1,033,610
68.51% of 50 DAV
50 DAV is 1,508,700
|
$340.42
-3.15%
|
8/3/2011
|
$324.82
|
PP = $322.38
|
|
MB = $338.50
|
Most Recent Note - 8/31/2011 6:45:10 PM
Y - Still perched -3.1% off its 8/03/11 all-time high, quietly consolidating with light volume since recently finding support near its 50 DMA line.
>>> The latest Featured Stock Update with an annotated graph appeared on 8/26/2011. Click here.
View all notes |
Alert me of new notes |
CANSLIM.net Company Profile |
SEC |
Zacks Reports |
StockTalk |
News |
Chart |
Request a new note
C
A N
S L
I M
|
MG
-
NYSE
Mistras Group Inc
DIVERSIFIED SERVICES - Bulding and Faci;ity Management Services
|
$20.20
|
-0.31
-1.51% |
$20.68
|
246,274
161.49% of 50 DAV
50 DAV is 152,500
|
$20.82
-2.98%
|
8/10/2011
|
$17.89
|
PP = $17.58
|
|
MB = $18.46
|
Most Recent Note - 8/31/2011 6:46:41 PM
G - Encountered mild distributional pressure today while hovering near its all-time high. It has been recently noted as extended from its prior base, yet no resistance remains due to overhead supply. Previous resistance in the $17-18 area defines important chart support to watch on pullbacks.
>>> The latest Featured Stock Update with an annotated graph appeared on 8/24/2011. Click here.
View all notes |
Alert me of new notes |
CANSLIM.net Company Profile |
SEC |
Zacks Reports |
StockTalk |
News |
Chart |
Request a new note
C
A N
S L
I M
|
Symbol/Exchange
Company Name
Industry Group |
PRICE |
CHANGE
(%Change) |
Day High |
Volume
(% DAV)
(% 50 day avg vol) |
52 Wk Hi
% From Hi |
Featured
Date |
Price
Featured |
Pivot Featured |
|
Max Buy |
MKTX
-
NASDAQ
Marketaxess Holdings Inc
FINANCIAL SERVICES - Investment Brokerage - Nationa
|
$29.48
|
-0.50
-1.67% |
$30.28
|
340,538
139.17% of 50 DAV
50 DAV is 244,700
|
$30.95
-4.75%
|
7/29/2011
|
$25.87
|
PP = $26.35
|
|
MB = $27.67
|
Most Recent Note - 8/31/2011 6:48:18 PM
G - Encountered some distributional pressure today while hovering near its all-time high after a negative reversal on the prior session. It is extended from its prior base. Prior resistance in the $25-26 area defines chart support to watch.
>>> The latest Featured Stock Update with an annotated graph appeared on 8/23/2011. Click here.
View all notes |
Alert me of new notes |
CANSLIM.net Company Profile |
SEC |
Zacks Reports |
StockTalk |
News |
Chart |
Request a new note
C
A N
S L
I M
|
PSMT
-
NASDAQ
Pricesmart Inc
RETAIL - Drug Stores
|
$65.46
|
+1.65
2.59% |
$66.66
|
393,998
150.50% of 50 DAV
50 DAV is 261,800
|
$64.64
1.27%
|
8/30/2011
|
$63.01
|
PP = $62.37
|
|
MB = $65.49
|
Most Recent Note - 8/31/2011 6:51:45 PM
G - Hit another new 52-week high with above average volume behind today's 4th consecutive gain. Color code is changed to green after trading above and closing the session near its "max buy" level. See the latest FSU analysis for more details and a new annotated graph.
>>> The latest Featured Stock Update with an annotated graph appeared on 8/30/2011. Click here.
View all notes |
Alert me of new notes |
CANSLIM.net Company Profile |
SEC |
Zacks Reports |
StockTalk |
News |
Chart |
Request a new note
C
A N
S L
I M
|
|
|
|
THESE ARE NOT BUY RECOMMENDATIONS!
Comments contained in the body of this report are technical
opinions only. The material herein has been obtained
from sources believed to be reliable and accurate, however,
its accuracy and completeness cannot be guaranteed.
This site is not an investment advisor, hence it does
not endorse or recommend any securities or other investments.
Any recommendation contained in this report may not
be suitable for all investors and it is not to be deemed
an offer or solicitation on our part with respect to
the purchase or sale of any securities. All trademarks,
service marks and trade names appearing in this report
are the property of their respective owners, and are
likewise used for identification purposes only.
This report is a service available
only to active Paid Premium Members.
You may opt-out of receiving report notifications
at any time. Questions or comments may be submitted
by writing to Premium Membership Services 665 S.E. 10 Street, Suite 201 Deerfield Beach, FL 33441-5634 or by calling 1-800-965-8307
or 954-785-1121.
|
|
|

