You are not logged in.
This means you
CAN ONLY VIEW reports that were published prior to Tuesday, February 18, 2025.
You
MUST UPGRADE YOUR MEMBERSHIP if you want to see any current reports.
AFTER MARKET UPDATE - MONDAY, AUGUST 29TH, 2022
Previous After Market Report Next After Market Report >>>
|
|
|
|
DOW |
-184.41 |
32,098.99 |
-0.57% |
|
Volume |
715,060,797 |
-11% |
|
Volume |
4,154,527,000 |
-8% |
|
NASDAQ |
-124.04 |
12,017.67 |
-1.02% |
|
Advancers |
1,025 |
33% |
|
Advancers |
1,388 |
32% |
|
S&P 500 |
-27.05 |
4,030.61 |
-0.67% |
|
Decliners |
2,059 |
67% |
|
Decliners |
3,008 |
68% |
|
Russell 2000 |
-16.89 |
1,882.94 |
-0.89% |
|
52 Wk Highs |
30 |
|
|
52 Wk Highs |
24 |
|
|
S&P 600 |
-11.65 |
1,213.85 |
-0.95% |
|
52 Wk Lows |
137 |
|
|
52 Wk Lows |
227 |
|
|
 |
Breadth Negative as Major Averages Slump With Lighter Volume
Kenneth J. Gruneisen - Passed the CAN SLIM® Master's Exam
The S&P 500 shed 0.7%, while the Dow lost 184 points. The Nasdaq Composite fell 1% amid weakness in Technology shares. The volume totals reported were lighter than the prior session on the NYSE and on the Nasdaq exchange. Breadth was clearly negative as decliners led advancers by a 2-1 margin on the NYSE and on the Nasdaq exchange. There were 3 high-ranked companies from the Leaders List that hit new 52-week highs and were listed on the BreakOuts Page, versus the total of 11 on the prior session. New 52-week lows totals expanded and outnumbered new 52-week highs on the NYSE and on the Nasdaq exchange. The market uptrend is now under pressure (M criteria). Any sustainable rally requires a healthy crop of leading stocks hitting new highs.
Chart courtesy of www.stockcharts.com%20on%20Tuesday.%20Yesterday,%20the%20broad%20benchmark%20eclipsed%20the%204,300%20level%20for%20the%20first%20time%20since%20late%20April.%20The%20Nasdaq%20Composite%20fell%201.3%%20amid%20weakness%20in%20mega-cap%20tech%20shares.%20The%20volume%20totals%20reported%20were%20mixed,%20lighter%20than%20the%20prior%20session%20on%20the%20NYSE%20and%20higher%20on%20the%20Nasdaq%20exchange.%20Decliners%20led%20advancers%20by%20a%204-1%20margin%20on%20the%20NYSE%20ad%20by%20a%203-1%20margin%20on%20the%20Nasdaq%20exchange.%20There%20were%2017%20high-ranked%20companies%20from%20the%20Leaders%20List%20that%20hit%20new%2052-week%20highs%20and%20were%20listed%20on%20the%20BreakOuts%20Page,%20down%20from%20the%20total%20of%2045%20on%20the%20prior%20session.%20New%2052-week%20highs%20outnumbered%20new%2052-week%20lows%20on%20the%20NYSE,%20but%20new%20lows%20outnumbered%20new%20highs%20on%20the%20Nasdaq%20exchange.%20The%20market%20is%20in%20a%20confirmed%20uptrend%20(M%20criteria).%20Any%20sustainable%20rally%20requires%20a%20healthy%20crop%20of%20leading%20stocks%20hitting%20new%20highs,%20so%20the%20recent%20improvement%20in%20leadership%20was%20a%20reassuring%20sign.) 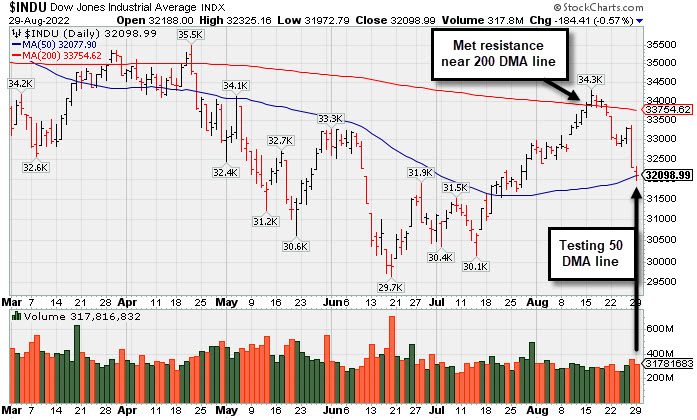 PICTURED: The Dow Jones Industrial Average slumped and tested its 50-day moving average (DMA) line with Monday's loss on lighter volume than on Friday's big loss.
U.S. stocks ended lower on Monday, though pared early session losses, as another back-up in Treasury yields weighed on growth-related pockets of the market. Sentiment remained under pressure as investors continued to digest last Friday’s address from Federal Reserve (Fed) Chair Jerome Powell. During the Jackson Hole economic symposium, the Fed chief struck a decidedly hawkish tone, sending stocks firmly lower for their worst session in more than two months. Powell said the Fed would continue fighting inflation “until the job is done,” adding that restrictive monetary policy would remain in place for “some time.” He asserted that curbing inflation was the central bank’s top priority, and confirmed that the size of September’s rate hike would remain data dependent.
Treasuries slipped, with the yield on the 10-year note climbing seven basis points (0.07%) to 3.10%. The two-year note yield rose four basis points (0.04%) to 3.42% after briefly hitting its highest level since 2007. Sovereign bond yields are extending this year’s ascent as global central bank officials reaffirm plans to keep hiking interest rates as much as necessary in order to clamp down on elevated inflation-even at the risk of inciting recessions. A gauge of the U.S. dollar finished little changed after earlier touching a two-decade high. In commodities, West Texas Intermediate crude jumped 4.2% to $96.93/barrel on the prospect of the Organization of Petroleum Exporting Countries and its allies (OPEC+)production cuts. |
 Kenneth J. Gruneisen started out as a licensed stockbroker in August 1987, a couple of months prior to the historic stock market crash that took the Dow Jones Industrial Average down -22.6% in a single day. He has published daily fact-based fundamental and technical analysis on high-ranked stocks online for two decades. Through FACTBASEDINVESTING.COM, Kenneth provides educational articles, news, market commentary, and other information regarding proven investment systems that work in good times and bad.
Comments contained in the body of this report are technical opinions only and are not necessarily those of Gruneisen Growth Corp. The material herein has been obtained from sources believed to be reliable and accurate, however, its accuracy and completeness cannot be guaranteed. Our firm, employees, and customers may effect transactions, including transactions contrary to any recommendation herein, or have positions in the securities mentioned herein or options with respect thereto. Any recommendation contained in this report may not be suitable for all investors and it is not to be deemed an offer or solicitation on our part with respect to the purchase or sale of any securities. |
|
 |
Energy-Linked Indexes Rose on Widely Negative Session
Kenneth J. Gruneisen - Passed the CAN SLIM® Master's Exam
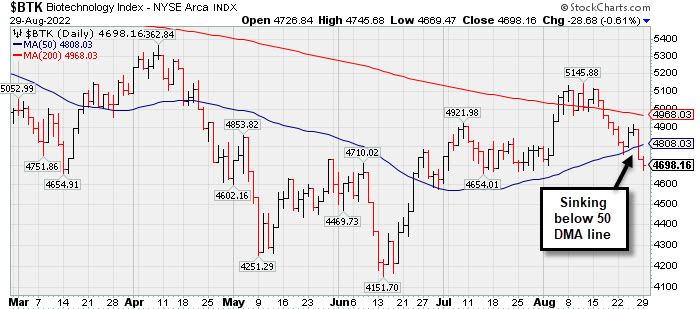
The Broker/Dealer Index ($XBD -0.88%), Bank Index ($BKX -0.85%), and Retail Index ($RLX -0.48%) each lost ground on Monday and weighed on the major averages. The Semiconductor Index ($SOX -1.93%) outpaced the Biotech Index ($BTK -0.61%) to the downside while the Networking Index ($NWX +0.10%) eked out a tiny gain. Commodity-linked groups were mixed as the Oil Services Index ($OSX +1.40%) and Integrated Oil Index ($XOI +1.55%) both posted gains while the Gold & Silver Index ($XAU -1.28%) edged lower.
PICTURED: The Biotech Index ($BTK -0.61%) is sinking below its 50-day moving average (DMA) line toward prior lows.
| Oil Services |
$OSX |
72.94 |
+1.01 |
+1.40% |
+38.35% |
| Integrated Oil |
$XOI |
1,728.95 |
+26.31 |
+1.55% |
+46.74% |
| Semiconductor |
$SOX |
2,744.50 |
-53.94 |
-1.93% |
-30.45% |
| Networking |
$NWX |
821.90 |
+0.81 |
+0.10% |
-15.36% |
| Broker/Dealer |
$XBD |
443.91 |
-3.93 |
-0.88% |
-8.82% |
| Retail |
$RLX |
3,284.90 |
-15.96 |
-0.48% |
-22.28% |
| Gold & Silver |
$XAU |
102.51 |
-1.33 |
-1.28% |
-22.61% |
| Bank |
$BKX |
106.73 |
-0.92 |
-0.85% |
-19.28% |
| Biotech |
$BTK |
4,698.16 |
-28.68 |
-0.61% |
-14.86% |
|
|
|
 |
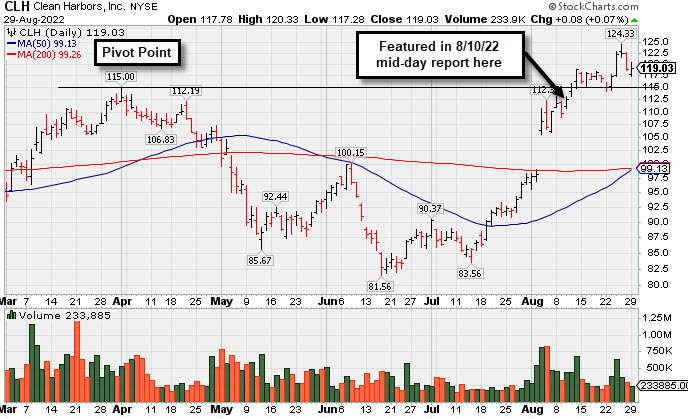
Quietly Consolidating Below "Max Buy" Level After Breakout
Kenneth J. Gruneisen - Passed the CAN SLIM® Master's Exam
Clean Harbors Inc (CLH +$0.08 or +0.07% to $119.03) is consolidating near its all-time high but back below its "max buy" level so its color code is changed to yellow Previously noted gains and a strong close above the pivot point backed by +116% above average volume on 8/12/22 triggered a technical buy signal. No resistance remains due to overhead supply. Fundamentals remain strong. Prior high in the $115 area defines important near-term support to watch on pullbacks.
CLH was highlighted in yellow in the 8/10/22 mid-day report (read here) with pivot point cited based on its 4/01/22 high plus 10 cents. It was shown in greater detail that evening with an annotated graph under the headline, "Pollution Control Firm Perched Near Prior High".
CLH has a highest possible Earnings Per Share Rating of 99. It reported Jun '22 quarterly earnings +105% on +46% sales revenues versus the year ago period. Prior quarters showed a strong earnings track record with earnings above the +25% minimum guideline (C criteria). Annual earnings (A criteria) growth has been strong and steady.
There are only 54.4 million shares outstanding (S criteria), which can contribute to greater price volatility in the event of institutional buying or selling. The number of top-rated funds owning its shares rose from 590 in Sep '21 to 615 in Jun '22, a reassuring sign concerning the I criteria. The current Up/Down Volume Ratio of 2.0 is an unbiased indication its shares have been under accumulation over the past 50 days. It has a Timeliness Rating of A and a Sponsorship rating of C.
|
|
|
Color Codes Explained :
Y - Better candidates highlighted by our
staff of experts.
G - Previously featured
in past reports as yellow but may no longer be buyable under the
guidelines.
***Last / Change / Volume data in this table is the closing quote data***
Symbol/Exchange
Company Name
Industry Group |
PRICE |
CHANGE
(%Change) |
Day High |
Volume
(% DAV)
(% 50 day avg vol) |
52 Wk Hi
% From Hi |
Featured
Date |
Price
Featured |
Pivot Featured |
|
Max Buy |
 IMXI
-
NASDAQ
IMXI
-
NASDAQ
International Money Exp
Financial Svcs-Specialty
|
$23.69
|
-0.42
-1.74% |
$24.05
|
525,126
100.79% of 50 DAV
50 DAV is 521,000
|
$26.23
-9.68%
|
7/1/2022
|
$21.27
|
PP = $21.38
|
|
MB = $22.45
|
 Most Recent Note - 8/29/2022 12:38:16 PM
G - Retreating from its all-time high, slumping near its 50 DMA line ($23.07) which defines initial support to watch above prior highs in the $22 area. Reported Jun '22 quarterly earnings +21% on +17% sales revenues versus the year ago period, below the +25% minimum earnings guideline (C criteria), raising fundamental concerns.
>>> FEATURED STOCK ARTICLE : June Quarter Was Below +25% Minimum Earnings Guideline - 8/23/2022 |
View all notes |
Set NEW NOTE alert |
Company Profile |
SEC
News |
Chart |
Request a new note
C
A
S
I |
CI
-
NYSE
Cigna Corp
Medical-Managed Care
|
$287.19
|
+2.32
0.81% |
$289.29
|
1,146,009
57.36% of 50 DAV
50 DAV is 1,998,000
|
$293.96
-2.30%
|
7/7/2022
|
$276.55
|
PP = $273.68
|
|
MB = $287.36
|
Most Recent Note - 8/26/2022 6:35:32 PM
G - Pulled back today with below average volume. Volume totals have been cooling while hovering near its all-time high. Reported earnings for the Jun '22 quarter rose +19% on +5% sales revenues versus the year ago period, breaking a streak of 3 quarterly earnings increases above the +25% minimum guideline (C criteria), raising fundamental concerns. Near-term support to watch is at its 50 DMA line ($275). See the latest FSU analysis for more details and a new annotated graph.
>>> FEATURED STOCK ARTICLE : Cigna Hovering Near High Despite Earnings Under +25% Minimum - 8/26/2022 |
View all notes |
Set NEW NOTE alert |
Company Profile |
SEC
News |
Chart |
Request a new note
C
A
S
I |
AN
-
NYSE
Autonation Inc
SPECIALTY RETAIL - Auto Dealerships
|
$127.36
|
+1.01
0.80% |
$127.95
|
474,749
68.11% of 50 DAV
50 DAV is 697,000
|
$135.57
-6.06%
|
7/20/2022
|
$122.03
|
PP = $126.49
|
|
MB = $132.81
|
Most Recent Note - 8/25/2022 5:52:00 PM
Y - Posted a 3rd consecutive gain today and rose back above prior highs in the $126 area which were noted as initial support to watch. Faces no resistance due to overhead supply. Reported Jun '22 quarterly earnings +34% on -2% sales revenues versus the year ago period.
>>> FEATURED STOCK ARTICLE : Autonation Hovering Near Stubborn Resistance - 8/11/2022 |
View all notes |
Set NEW NOTE alert |
Company Profile |
SEC
News |
Chart |
Request a new note
C
A
S
I |
ESQ
-
NASDAQ
Esquire Financial Hldgs
Finance-Commercial Loans
|
$37.92
|
-0.38
-0.99% |
$38.19
|
24,281
41.86% of 50 DAV
50 DAV is 58,000
|
$41.68
-9.02%
|
7/26/2022
|
$37.74
|
PP = $39.19
|
|
MB = $41.15
|
Most Recent Note - 8/26/2022 1:14:16 PM
Y - Volume totals have remained lighter than average volume while sputtering back and testing support near prior resistance in the $39 area. Confirming gains above the pivot point backed by at least +40% above average volume would be a reassuring sign of fresh institutional buying. Its 50 DMA line ($36.13) defines important near-term support.
>>> FEATURED STOCK ARTICLE : Closed at Session High With Gain for New All-Time High - 8/12/2022 |
View all notes |
Set NEW NOTE alert |
Company Profile |
SEC
News |
Chart |
Request a new note
C
A
S
I |
GPK
-
NYSE
Graphic Packaging Hldg
CONSUMER NON-DURABLES - Packaging and Containers
|
$22.94
|
+0.02
0.09% |
$23.04
|
2,173,855
72.46% of 50 DAV
50 DAV is 3,000,000
|
$23.71
-3.25%
|
7/26/2022
|
$22.63
|
PP = $23.09
|
|
MB = $24.24
|
Most Recent Note - 8/29/2022 5:39:26 PM
Y - Still holding its ground but it has made no real progress since its 8/10/22 breakout. Its 50 DMA line ($21.73) defines near-term support.
>>> FEATURED STOCK ARTICLE : Churned Heavy Volume Perched at High After 6 Straight Gains - 8/15/2022 |
View all notes |
Set NEW NOTE alert |
Company Profile |
SEC
News |
Chart |
Request a new note
C
A
S
I |
Symbol/Exchange
Company Name
Industry Group |
PRICE |
CHANGE
(%Change) |
Day High |
Volume
(% DAV)
(% 50 day avg vol) |
52 Wk Hi
% From Hi |
Featured
Date |
Price
Featured |
Pivot Featured |
|
Max Buy |
CSL
-
NYSE
Carlisle Cos Inc
Diversified Operations
|
$302.44
|
-2.51
-0.82% |
$304.83
|
361,939
87.85% of 50 DAV
50 DAV is 412,000
|
$318.71
-5.10%
|
7/28/2022
|
$282.31
|
PP = $275.23
|
|
MB = $288.99
|
Most Recent Note - 8/25/2022 5:56:16 PM
G - Posted a 3rd consecutive small gain, perched near its all-time high, stubbornly holding its ground. Prior highs in the $275 area define initial support to watch along with its 50 DMA line ($272.70).
>>> FEATURED STOCK ARTICLE : Pulling Back From All-Time High After Volume-Driven Gains - 8/22/2022 |
View all notes |
Set NEW NOTE alert |
Company Profile |
SEC
News |
Chart |
Request a new note
C
A
S
I |
ENPH
-
NASDAQ
Enphase Energy Inc
Energy-Solar
|
$284.82
|
-3.77
-1.31% |
$295.80
|
2,934,148
88.25% of 50 DAV
50 DAV is 3,325,000
|
$308.88
-7.79%
|
7/28/2022
|
$276.66
|
PP = $282.55
|
|
MB = $296.68
|
Most Recent Note - 8/26/2022 1:09:36 PM
Y - Pulling back today with light volume. Volume totals cooled while hovering near its all-time high in recent weeks. The prior high in the $282 area has been noted as initial support to watch above its 50 DMA line ($241). Fundamentals remain strong.
>>> FEATURED STOCK ARTICLE : Enphase Energy Consolidating After Rallying to New Highs - 8/19/2022 |
View all notes |
Set NEW NOTE alert |
Company Profile |
SEC
News |
Chart |
Request a new note
C
A
S
I |
PWR
-
NYSE
Quanta Services Inc
MATERIALS and CONSTRUCTION - General Contractors
|
$144.87
|
+0.24
0.17% |
$146.63
|
652,153
56.32% of 50 DAV
50 DAV is 1,158,000
|
$149.33
-2.99%
|
7/28/2022
|
$141.83
|
PP = $140.14
|
|
MB = $147.15
|
Most Recent Note - 8/24/2022 5:12:25 PM
Y - Posted a small gain today with light volume for its 2nd best ever close. Volume totals have been below average while recently wedging back above its pivot point since encountering some distributional pressure. Confirming volume-driven gains for new highs would be a reassuring sign of serious institutional buying demand. Its 50 DMA line ($132.22) defines important near-term support to watch. Fundamentals remain strong.
>>> FEATURED STOCK ARTICLE : Stalled After Breakout But Still Quietly Hovering Near High - 8/16/2022 |
View all notes |
Set NEW NOTE alert |
Company Profile |
SEC
News |
Chart |
Request a new note
C
A
S
I |
CLFD
-
NASDAQ
Clearfield Inc
TELECOMMUNICATIONS - Cables / Satalite Equipment
|
$120.88
|
-1.66
-1.35% |
$123.74
|
211,105
61.55% of 50 DAV
50 DAV is 343,000
|
$130.01
-7.02%
|
7/29/2022
|
$94.10
|
PP = $86.81
|
|
MB = $91.15
|
Most Recent Note - 8/29/2022 5:37:08 PM
G - Pulled back from its all-time high with today's 3rd consecutive loss with below average volume. Very extended from any sound base. Its 50 DMA line ($89.93) and prior high in the $86 area define important support to watch. Fundamentals remain strong.
>>> FEATURED STOCK ARTICLE : Clearfield Showed Resilience After Considerable Rally - 8/17/2022 |
View all notes |
Set NEW NOTE alert |
Company Profile |
SEC
News |
Chart |
Request a new note
C
A
S
I |
GFF
-
NYSE
Griffon Corporation
MATERIALS and CONSTRUCTION - General Building Materials
|
$32.78
|
+0.34
1.05% |
$33.03
|
269,397
58.69% of 50 DAV
50 DAV is 459,000
|
$34.35
-4.57%
|
8/8/2022
|
$32.46
|
PP = $31.12
|
|
MB = $32.68
|
Most Recent Note - 8/26/2022 1:07:27 PM
G - Pulling back near its "max buy" level with light volume behind today's loss. Prior highs in the $31 area define initial support to watch above its 50 DMA line ($28.70). See the latest FSU analysis for more details and an annotated graph.
>>> FEATURED STOCK ARTICLE : Best Ever Close With Gain on Lighter Volume - 8/25/2022 |
View all notes |
Set NEW NOTE alert |
Company Profile |
SEC
News |
Chart |
Request a new note
C
A
S
I |
Symbol/Exchange
Company Name
Industry Group |
PRICE |
CHANGE
(%Change) |
Day High |
Volume
(% DAV)
(% 50 day avg vol) |
52 Wk Hi
% From Hi |
Featured
Date |
Price
Featured |
Pivot Featured |
|
Max Buy |
CLH
-
NYSE
Clean Harbors Inc
Pollution Control
|
$119.03
|
+0.08
0.07% |
$120.33
|
233,876
72.41% of 50 DAV
50 DAV is 323,000
|
$124.33
-4.26%
|
8/10/2022
|
$111.78
|
PP = $115.10
|
|
MB = $120.86
|
Most Recent Note - 8/29/2022 5:34:29 PM
Y - Color code is changed to yellow while consolidating below its "max buy" level. Previously noted gain and strong close above the pivot point backed by +116% above average volume on 8/12/22 triggered a technical buy signal. No resistance remains due to overhead supply. Fundamentals remain strong. Prior high in the $115 area defines important near-term support to watch on pullbacks. See latest FSU analysis for more details and a new annotated graph.
>>> FEATURED STOCK ARTICLE : Quietly Consolidating Below "Max Buy" Level After Breakout - 8/29/2022 |
View all notes |
Set NEW NOTE alert |
Company Profile |
SEC
News |
Chart |
Request a new note
C
A
S
I |
SNPS
-
NASDAQ
Synopsys Inc
COMPUTER SOFTWARE and SERVICES - Technical and System Software
|
$347.49
|
-7.51
-2.12% |
$354.49
|
1,093,930
114.07% of 50 DAV
50 DAV is 959,000
|
$391.17
-11.17%
|
8/17/2022
|
$381.37
|
PP = $377.70
|
|
MB = $396.59
|
Most Recent Note - 8/24/2022 5:13:55 PM
G - Halted its slide this week after encountering distributional pressure since reaching a new all-time high. Reported Jul '22 quarterly earnings +16% on +18% sales revenues versus the year ago period, below the +25% minimum earnings guideline (C criteria), raising fundamental concerns. Renewed strength and subsequent gains above the pivot point backed by at least +40% above average volume are needed to clinch a technical buy signal.
>>> FEATURED STOCK ARTICLE : Earnings Report Below +25% Minimum and Encountering Distributional Pressure - 8/18/2022 |
View all notes |
Set NEW NOTE alert |
Company Profile |
SEC
News |
Chart |
Request a new note
C
A
S
I |
|
|
|
THESE ARE NOT BUY RECOMMENDATIONS!
Comments contained in the body of this report are technical
opinions only. The material herein has been obtained
from sources believed to be reliable and accurate, however,
its accuracy and completeness cannot be guaranteed.
This site is not an investment advisor, hence it does
not endorse or recommend any securities or other investments.
Any recommendation contained in this report may not
be suitable for all investors and it is not to be deemed
an offer or solicitation on our part with respect to
the purchase or sale of any securities. All trademarks,
service marks and trade names appearing in this report
are the property of their respective owners, and are
likewise used for identification purposes only.
This report is a service available
only to active Paid Premium Members.
You may opt-out of receiving report notifications
at any time. Questions or comments may be submitted
by writing to Premium Membership Services 665 S.E. 10 Street, Suite 201 Deerfield Beach, FL 33441-5634 or by calling 1-800-965-8307
or 954-785-1121.
|
|
|