You are not logged in.
This means you
CAN ONLY VIEW reports that were published prior to Wednesday, March 26, 2025.
You
MUST UPGRADE YOUR MEMBERSHIP if you want to see any current reports.
AFTER MARKET UPDATE - TUESDAY, AUGUST 9TH, 2022
Previous After Market Report Next After Market Report >>>
|
|
|
|
DOW |
-58.13 |
32,774.41 |
-0.18% |
|
Volume |
821,653,683 |
-3% |
|
Volume |
5,290,305,200 |
+2% |
|
NASDAQ |
-150.53 |
12,493.93 |
-1.19% |
|
Advancers |
1,067 |
35% |
|
Advancers |
1,362 |
31% |
|
S&P 500 |
-17.59 |
4,122.47 |
-0.42% |
|
Decliners |
2,021 |
65% |
|
Decliners |
3,080 |
69% |
|
Russell 2000 |
-28.31 |
1,912.89 |
-1.46% |
|
52 Wk Highs |
26 |
|
|
52 Wk Highs |
47 |
|
|
S&P 600 |
-18.00 |
1,229.19 |
-1.44% |
|
52 Wk Lows |
58 |
|
|
52 Wk Lows |
96 |
|
|
 |
Breadth Negative as Major Averages Lost Ground
Kenneth J. Gruneisen - Passed the CAN SLIM® Master's Exam
The S&P 500 declined 0.4%, retreating for a fourth consecutive day, while the Dow lost 58 points. The Nasdaq Composite slipped 1.2%. The volume totals reported were mixed, lower than the prior session on the NYSE and higher on the Nasdaq exchange. Decliners led advancers by almost a 2-1 margin on the NYSE and by more than a 2-1 margin on the Nasdaq exchange. There were 17 high-ranked companies from the Leaders List that hit new 52-week highs and were listed on the BreakOuts Page, versus the total of 25 on the prior session. New 52-week lows totals expanded and outnumbered new 52-week highs on the NYSE and on the Nasdaq exchange. The market is in a confirmed uptrend (M criteria). Any sustainable rally requires a healthy crop of leading stocks hitting new highs, so the recent improvement in leadership was a reassuring sign.
Chart courtesy of www.stockcharts.com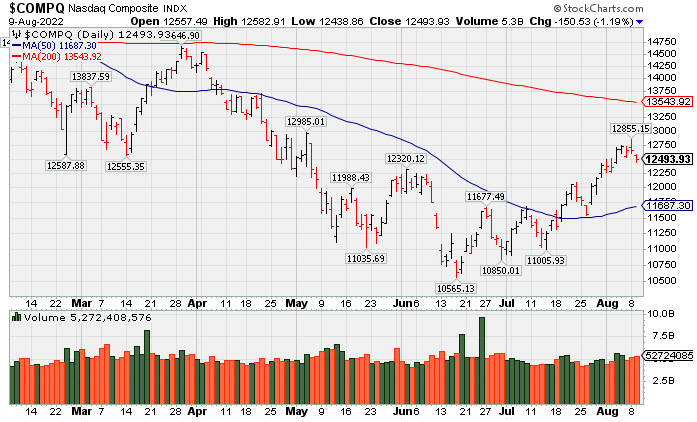 PICTURED: The Nasdaq Composite Index fell for a 3rd consecutive session. It remains well below its 200 DMA line.
U.S. stocks finished lower on Tuesday as a downbeat update from another chipmaker weighed on Tech shares. Micron Technology Inc. (MU -3.74%) fell as the semiconductor maker warned that current-quarter revenue could come in below its most recent forecast amid macroeconomic uncertainty and ongoing supply chain issues. The Philadelphia Semiconductor Index (SOX) fell 4.6%, with all 30 companies in the index in the red to cap its worst day in eight weeks. In other earnings, Novavax Inc. (NVAX -29.64%) gapped down after slashing its forecast due to lower-than-expected demand for its COVID-19 vaccine.
Treasuries weakened, with the yield on the 10-year note up three basis points (0.03%) to 2.78%, while the two-year note yield climbed five basis points (0.05%) to 3.26%. In commodities, West Texas Intermediate (WTI) ended little changed at $90.56/barrel as market participants weighed progress on the possible revival of the 2015 Iran nuclear deal.
Meanwhile, investors remained cautious ahead of tomorrow’s highly anticipated Consumer Price Index (CPI) report that will help shape the future path of Federal Reserve (Fed) rate hikes. On Wednesday, CPI is forecasted to have risen 0.2% in July, which would mark the smallest monthly gain since the start of 2021. The softer print is expected to reflect a drop in oil prices. However, the headline figure will likely remain elevated at 8.7% year-over-year, well above the Fed’s 2% target, while core CPI (excluding food and energy) is projected to have accelerated on an annual basis.
|
 Kenneth J. Gruneisen started out as a licensed stockbroker in August 1987, a couple of months prior to the historic stock market crash that took the Dow Jones Industrial Average down -22.6% in a single day. He has published daily fact-based fundamental and technical analysis on high-ranked stocks online for two decades. Through FACTBASEDINVESTING.COM, Kenneth provides educational articles, news, market commentary, and other information regarding proven investment systems that work in good times and bad.
Comments contained in the body of this report are technical opinions only and are not necessarily those of Gruneisen Growth Corp. The material herein has been obtained from sources believed to be reliable and accurate, however, its accuracy and completeness cannot be guaranteed. Our firm, employees, and customers may effect transactions, including transactions contrary to any recommendation herein, or have positions in the securities mentioned herein or options with respect thereto. Any recommendation contained in this report may not be suitable for all investors and it is not to be deemed an offer or solicitation on our part with respect to the purchase or sale of any securities. |
|
 |
Tech Sector and Retail Index Led Declining Groups
Kenneth J. Gruneisen - Passed the CAN SLIM® Master's Exam
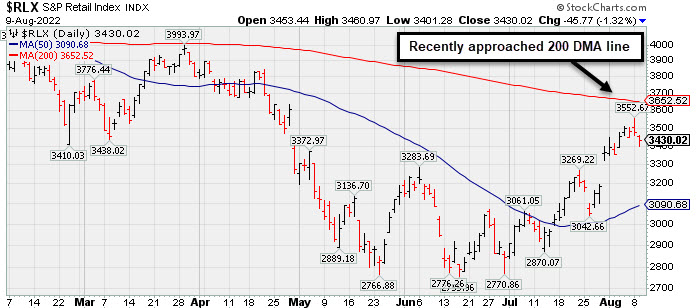
The Retail Index ($RLX -1.32%) lost ground and the Broker/Dealer Index ($XBD -0.27%) edged lower while the Bank Index ($BKX +0.45%) edged higher. The Semiconductor Index ($SOX -4.57%) led the tech sector lower as the Biotech Index ($BTK -2.16%) and Networking Index ($NWX -0.99%) both lost ground. The Oil Services Index ($OSX +1.19%) Integrated Oil Index ($XOI +1.91%) both posted gains while the Gold & Silver Index ($XAU -0.19%) inched lower. PICTURED: The Retail Index ($RLX -1.32%) ended lower for the 3rd consecutive session. It recently approached its 200-day moving average (DMA) line.
| Oil Services |
$OSX |
65.40 |
+0.77 |
+1.19% |
+24.04% |
| Integrated Oil |
$XOI |
1,543.19 |
+28.97 |
+1.91% |
+30.98% |
| Semiconductor |
$SOX |
2,866.90 |
-137.44 |
-4.57% |
-27.35% |
| Networking |
$NWX |
795.49 |
-7.94 |
-0.99% |
-18.08% |
| Broker/Dealer |
$XBD |
450.86 |
-1.24 |
-0.27% |
-7.40% |
| Retail |
$RLX |
3,430.02 |
-45.77 |
-1.32% |
-18.84% |
| Gold & Silver |
$XAU |
110.46 |
-0.21 |
-0.19% |
-16.61% |
| Bank |
$BKX |
108.48 |
+0.49 |
+0.45% |
-17.96% |
| Biotech |
$BTK |
4,991.77 |
-110.31 |
-2.16% |
-9.54% |
|
|
|
 |
Wedging Higher With Lighter Volume Behind Gain for New High
Kenneth J. Gruneisen - Passed the CAN SLIM® Master's Exam
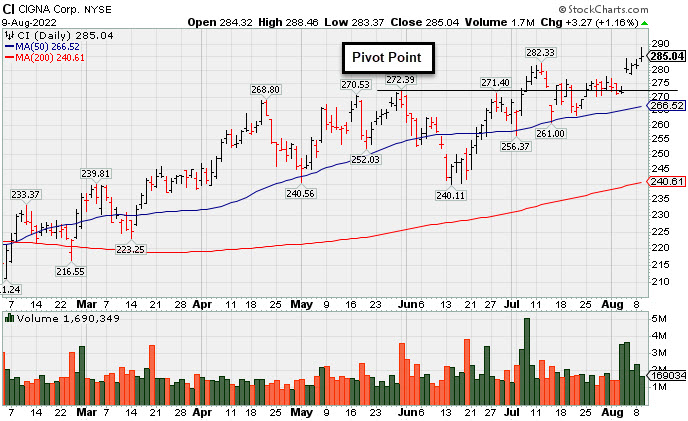
Cigna Corp (CI +$3.27 or +1.16% to $285.04) wedged higher with below average volume posting a 5th consecutive gain today and hitting a new all-time high. It is still just below its "max buy" level. Recently it reported earnings news for the Jun '22 quarter +19% on +5% sales revenues versus the year ago period, breaking a streak of 3 quarterly earnings increases above the +25% minimum guideline (C criteria). Near-term support to watch on pullbacks is at its 50-day moving average (DMA) line ($266.66). More damaging losses would raise greater concerns.
CI has a 94 Earnings Per Share Rating. Annual earnings growth (A criteria) has been strong. It was highlighted in yellow with new pivot point based on its 5/31/22 high plus 10 cents in the 7/07/22 mid-day report (read here). It was last shown in greater on 7/19/22 with an annotated graph under the headline, "Pulled Back and Tested Support at 50-Day Moving Average".
The number of top-rated funds owning its shares rose from 2,628 in Dec '21 to 2,816 in Jun '22, a reassuring sign concerning the I criteria. The Medical - Managed Care group is currently ranked 17th on the 197 Industry Groups list and has a Group Relative Strength Rating of 93 (A), a reassuring sign concerning the L criteria.
|
|
|
Color Codes Explained :
Y - Better candidates highlighted by our
staff of experts.
G - Previously featured
in past reports as yellow but may no longer be buyable under the
guidelines.
***Last / Change / Volume data in this table is the closing quote data***
Symbol/Exchange
Company Name
Industry Group |
PRICE |
CHANGE
(%Change) |
Day High |
Volume
(% DAV)
(% 50 day avg vol) |
52 Wk Hi
% From Hi |
Featured
Date |
Price
Featured |
Pivot Featured |
|
Max Buy |
 LLY
-
NYSE
LLY
-
NYSE
Eli Lilly & Co
Medical-Diversified
|
$303.02
|
+0.52
0.17% |
$306.70
|
2,122,888
72.90% of 50 DAV
50 DAV is 2,912,000
|
$335.33
-9.64%
|
5/16/2022
|
$302.46
|
PP = $314.10
|
|
MB = $329.81
|
Most Recent Note - 8/8/2022 12:55:42 PM
G - On track today for a 7th consecutive loss, slumping further below its 50 DMA line ($316) raising concerns. Only a prompt rebound above the 50 DMA line would help its outlook improve.
>>> FEATURED STOCK ARTICLE : Hovering Near "Max Buy" Level With Volume Totals Cooling - 7/22/2022 |
View all notes |
Set NEW NOTE alert |
Company Profile |
SEC
News |
Chart |
Request a new note
C
A
S
I |
IMXI
-
NASDAQ
International Money Exp
Financial Svcs-Specialty
|
$25.11
|
-0.93
-3.57% |
$26.05
|
821,958
175.63% of 50 DAV
50 DAV is 468,000
|
$26.11
-3.83%
|
7/1/2022
|
$21.27
|
PP = $21.38
|
|
MB = $22.45
|
 Most Recent Note - 8/9/2022 1:08:10 PM
G - Reported Jun '22 quarterly earnings +21% on +17% sales revenues versus the year ago period, below the +25% minimum earnings guideline (C criteria). Pulling back from its 52-week high with today's loss following a spurt of volume-driven gains. Its 50 DMA line ($21.71) defines important near-term support to watch on pullbacks.
>>> FEATURED STOCK ARTICLE : Finished Strong With Another Volume-Driven Gain After Earnings - 8/3/2022 |
View all notes |
Set NEW NOTE alert |
Company Profile |
SEC
News |
Chart |
Request a new note
C
A
S
I |
HRMY
-
NASDAQ
Harmony Biosciences Holdings
Medical-Biomed/Biotech
|
$50.77
|
-3.23
-5.98% |
$54.24
|
771,379
138.86% of 50 DAV
50 DAV is 555,500
|
$57.13
-11.13%
|
7/6/2022
|
$54.12
|
PP = $52.85
|
|
MB = $55.49
|
Most Recent Note - 8/9/2022 7:21:03 PM
Y - Slumped today and it has been noted while churning above average volume and consolidating after testing support near its 50 DMA line ($49.73) and prior low. Fundamentals remain strong and it challenged its all-time high after reporting Jun '22 quarterly earnings +54% on +45% sales revenues versus the year ago period.
>>> FEATURED STOCK ARTICLE : Churning Higher Volume While Perched Near High After Earnings News - 8/4/2022 |
View all notes |
Set NEW NOTE alert |
Company Profile |
SEC
News |
Chart |
Request a new note
C
A
S
I |
CI
-
NYSE
Cigna Corp
Medical-Managed Care
|
$285.04
|
+3.27
1.16% |
$288.47
|
1,690,349
82.30% of 50 DAV
50 DAV is 2,054,000
|
$284.46
0.20%
|
7/7/2022
|
$276.55
|
PP = $273.68
|
|
MB = $287.36
|
Most Recent Note - 8/9/2022 7:16:22 PM
Y - Wedged higher and hit a new all-time high with lighter volume behind today's 5th consecutive gain. Still below its "max buy" level. Reported earnings news for the Jun '22 quarter +19% on +5% sales revenues versus the year ago period, breaking a streak of 3 quarterly earnings increases above the +25% minimum guideline (C criteria). Near-term support to watch is at its 50 DMA line ($266.66). See the latest FSU analysis for more details and a new annotated graph.
>>> FEATURED STOCK ARTICLE : Wedging Higher With Lighter Volume Behind Gain for New High - 8/9/2022 |
View all notes |
Set NEW NOTE alert |
Company Profile |
SEC
News |
Chart |
Request a new note
C
A
S
I |
AN
-
NYSE
Autonation Inc
SPECIALTY RETAIL - Auto Dealerships
|
$121.14
|
-1.91
-1.55% |
$122.64
|
451,909
63.03% of 50 DAV
50 DAV is 717,000
|
$133.48
-9.24%
|
7/20/2022
|
$122.03
|
PP = $126.49
|
|
MB = $132.81
|
Most Recent Note - 8/8/2022 5:56:57 PM
Y - Posted a gain backed by near average volume today while challenging previously stubborn resistance in the $126 area. Recent rebound above its 200 DMA line and 50 DMA line ($116.62) helped its outlook to improve. Subsequent volume-driven gains above the pivot point may trigger a technical buy signal. Reported Jun '22 quarterly earnings +34% on -2% sales revenues versus the year ago period. Still faces some resistance due to overhead supply up to the $133 level.
>>> FEATURED STOCK ARTICLE : Autonation Earnings Due While Perched Near Pivot Point - 7/20/2022 |
View all notes |
Set NEW NOTE alert |
Company Profile |
SEC
News |
Chart |
Request a new note
C
A
S
I |
Symbol/Exchange
Company Name
Industry Group |
PRICE |
CHANGE
(%Change) |
Day High |
Volume
(% DAV)
(% 50 day avg vol) |
52 Wk Hi
% From Hi |
Featured
Date |
Price
Featured |
Pivot Featured |
|
Max Buy |
ESQ
-
NASDAQ
Esquire Financial Hldgs
Finance-Commercial Loans
|
$38.42
|
+0.48
1.27% |
$38.50
|
22,075
36.79% of 50 DAV
50 DAV is 60,000
|
$39.09
-1.71%
|
7/26/2022
|
$37.74
|
PP = $39.19
|
|
MB = $41.15
|
Most Recent Note - 8/8/2022 5:59:12 PM
Y - Posted a 4th consecutive gain today challenging previously stubborn resistance in the $39 area. Its 50 DMA line ($35.34) defines important near-term support. Subsequent gains above the pivot point backed by at least +40% above average volume may trigger a technical buy signal.
>>> FEATURED STOCK ARTICLE : Volume Driven Gains Approaching Prior High - 7/26/2022 |
View all notes |
Set NEW NOTE alert |
Company Profile |
SEC
News |
Chart |
Request a new note
C
A
S
I |
GPK
-
NYSE
Graphic Packaging Hldg
CONSUMER NON-DURABLES - Packaging and Containers
|
$22.86
|
+0.48
2.14% |
$22.89
|
3,205,175
111.29% of 50 DAV
50 DAV is 2,880,000
|
$22.99
-0.57%
|
7/26/2022
|
$22.63
|
PP = $23.09
|
|
MB = $24.24
|
Most Recent Note - 8/9/2022 7:25:35 PM
Y - Posted a 3rd consecutive gain today with near average volume while approaching its 52-week high. Highlighted in yellow in the 7/26/22 mid-day report with pivot point cited based on its 6/06/22 high plus 10 cents. Subsequent gains above the pivot point backed by at least +40% above average volume are needed to trigger a proper technical buy signal.
>>> FEATURED STOCK ARTICLE : Negative Reversal After Matching 52-Week High - 7/27/2022 |
View all notes |
Set NEW NOTE alert |
Company Profile |
SEC
News |
Chart |
Request a new note
C
A
S
I |
CSL
-
NYSE
Carlisle Cos Inc
Diversified Operations
|
$301.20
|
-1.50
-0.50% |
$304.19
|
479,092
127.08% of 50 DAV
50 DAV is 377,000
|
$304.69
-1.15%
|
7/28/2022
|
$282.31
|
PP = $275.23
|
|
MB = $288.99
|
Most Recent Note - 8/9/2022 7:17:30 PM
G - Held its ground stubbornly and remains perched near its all-time high following noted volume-driven gains. Prior highs in the $275 area define initial support to watch on pullbacks.
>>> FEATURED STOCK ARTICLE : Carlisle Perched at All-Time High After Noted Breakout - 8/2/2022 |
View all notes |
Set NEW NOTE alert |
Company Profile |
SEC
News |
Chart |
Request a new note
C
A
S
I |
ENPH
-
NASDAQ
Enphase Energy Inc
Energy-Solar
|
$290.82
|
+3.08
1.07% |
$295.65
|
3,427,742
104.31% of 50 DAV
50 DAV is 3,286,000
|
$305.88
-4.92%
|
7/28/2022
|
$276.66
|
PP = $282.55
|
|
MB = $296.68
|
Most Recent Note - 8/8/2022 12:45:49 PM
Y - Reversed into the red from an early gain today for a new high after recently wedging higher and near its "max buy" level. The prior high in the $282 area was noted as initial support to watch on pullbacks. Fundamentals remain strong after reporting solid Jun '22 quarterly results, continuing its strong earnings history.
>>> FEATURED STOCK ARTICLE : Pullback Following 3 Consecutive Gains With Heavier Volume - 8/1/2022 |
View all notes |
Set NEW NOTE alert |
Company Profile |
SEC
News |
Chart |
Request a new note
C
A
S
I |
PWR
-
NYSE
Quanta Services Inc
MATERIALS and CONSTRUCTION - General Contractors
|
$135.84
|
-1.42
-1.03% |
$137.92
|
654,285
42.16% of 50 DAV
50 DAV is 1,552,000
|
$146.84
-7.49%
|
7/28/2022
|
$141.83
|
PP = $140.14
|
|
MB = $147.15
|
Most Recent Note - 8/9/2022 7:19:07 PM
Y - Small loss today with lighter volume. Consolidating following a noted "negative reversal" on 7/29/22 at its all-time high. Slumped below its pivot point raising some concerns following the recently noted breakout. Fundamentals remain strong.
>>> FEATURED STOCK ARTICLE : Volume-Driven Breakout for Quanta Services - 7/28/2022 |
View all notes |
Set NEW NOTE alert |
Company Profile |
SEC
News |
Chart |
Request a new note
C
A
S
I |
Symbol/Exchange
Company Name
Industry Group |
PRICE |
CHANGE
(%Change) |
Day High |
Volume
(% DAV)
(% 50 day avg vol) |
52 Wk Hi
% From Hi |
Featured
Date |
Price
Featured |
Pivot Featured |
|
Max Buy |
CLFD
-
NASDAQ
Clearfield Inc
TELECOMMUNICATIONS - Cables / Satalite Equipment
|
$113.88
|
+3.41
3.09% |
$114.31
|
3,035,237
1,297.11% of 50 DAV
50 DAV is 234,000
|
$114.73
-0.74%
|
7/29/2022
|
$94.10
|
PP = $86.81
|
|
MB = $91.15
|
Most Recent Note - 8/9/2022 1:06:06 PM
G - Extended from any sound base and perched at its all-time high following volume-driven gains. Prior high in the $86 area defines initial support to watch on pullbacks. Fundamentals remain strong after it reported Jun '22 quarterly earnings +109% on +84% sales revenues above the year ago period.
>>> FEATURED STOCK ARTICLE : Volume Heavy Behind Technical Breakout - 7/29/2022 |
View all notes |
Set NEW NOTE alert |
Company Profile |
SEC
News |
Chart |
Request a new note
C
A
S
I |
GFF
-
NYSE
Griffon Corporation
MATERIALS and CONSTRUCTION - General Building Materials
|
$31.17
|
-1.05
-3.26% |
$32.40
|
887,091
198.45% of 50 DAV
50 DAV is 447,000
|
$32.65
-4.54%
|
8/8/2022
|
$32.46
|
PP = $31.12
|
|
MB = $32.68
|
Most Recent Note - 8/9/2022 7:24:13 PM
Y - Erased much of the prior gain with today's loss backed by above average volume while testing near its pivot point. The prior gain above the pivot point backed by +52% above average volume triggered a technical buy signal. Reported Jun '22 quarterly earnings +215% on +31% sales revenues versus the year ago period, its 3rd strong quarterly comparison above the +25% minimum guideline (C criteria). Annual earnings (A criteria) growth has been strong and steady. Completed a new Public Offering on 8/17/20. See the latest FSU analysis for more details and an annotated graph.
>>> FEATURED STOCK ARTICLE : Breakout for New High Backed by +52% Above Average Volume - 8/8/2022 |
View all notes |
Set NEW NOTE alert |
Company Profile |
SEC
News |
Chart |
Request a new note
C
A
S
I |
|
|
|
THESE ARE NOT BUY RECOMMENDATIONS!
Comments contained in the body of this report are technical
opinions only. The material herein has been obtained
from sources believed to be reliable and accurate, however,
its accuracy and completeness cannot be guaranteed.
This site is not an investment advisor, hence it does
not endorse or recommend any securities or other investments.
Any recommendation contained in this report may not
be suitable for all investors and it is not to be deemed
an offer or solicitation on our part with respect to
the purchase or sale of any securities. All trademarks,
service marks and trade names appearing in this report
are the property of their respective owners, and are
likewise used for identification purposes only.
This report is a service available
only to active Paid Premium Members.
You may opt-out of receiving report notifications
at any time. Questions or comments may be submitted
by writing to Premium Membership Services 665 S.E. 10 Street, Suite 201 Deerfield Beach, FL 33441-5634 or by calling 1-800-965-8307
or 954-785-1121.
|
|
|