You are not logged in.
This means you
CAN ONLY VIEW reports that were published prior to Monday, March 24, 2025.
You
MUST UPGRADE YOUR MEMBERSHIP if you want to see any current reports.
AFTER MARKET UPDATE - TUESDAY, JULY 19TH, 2022
Previous After Market Report Next After Market Report >>>
|
|
|
|
DOW |
+754.44 |
31,827.05 |
+2.43% |
|
Volume |
902,542,318 |
+5% |
|
Volume |
5,202,831,100 |
+5% |
|
NASDAQ |
+353.10 |
11,713.15 |
+3.11% |
|
Advancers |
2,597 |
83% |
|
Advancers |
3,205 |
74% |
|
S&P 500 |
+105.84 |
3,936.69 |
+2.76% |
|
Decliners |
520 |
17% |
|
Decliners |
1,097 |
25% |
|
Russell 2000 |
+60.91 |
1,799.32 |
+3.50% |
|
52 Wk Highs |
14 |
|
|
52 Wk Highs |
35 |
|
|
S&P 600 |
+39.82 |
1,176.40 |
+3.50% |
|
52 Wk Lows |
48 |
|
|
52 Wk Lows |
93 |
|
|
 |
Breadth Positive and Volume Higher as Major Indices Rose
Kenneth J. Gruneisen - Passed the CAN SLIM® Master's Exam
The S&P 500 climbed 2.8%, closing above the 3,900 level after several failed attempts this month. The Nasdaq Composite rallied 3.1% amid strength in tech-related shares, while the Dow added 754 points. The volume totals reported were higher than the prior session on the NYSE and on the Nasdaq exchange. Breadth was positive as advancers led decliners by a 5-1 margin on the NYSE and by a 3-1 margin on the Nasdaq exchange. There were 14 high-ranked companies from the Leaders List that hit new 52-week high and were listed on the BreakOuts Page, versus the total of 9 on the prior session. New 52-week lows totals still outnumbered new 52-week highs totals on the NYSE and on the Nasdaq exchange. The market uptrend is under pressure (M criteria). Any sustainable rally requires a healthy crop of leading stocks hitting new highs, but leadership has been very thin.
Chart courtesy of www.stockcharts.com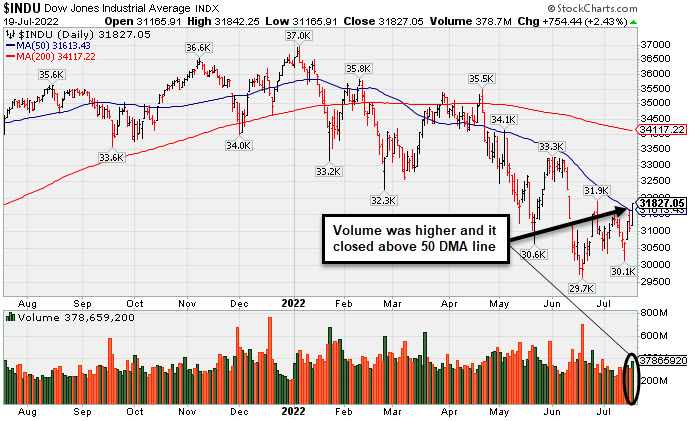 PICTURED: The Dow Jones Industrial Average closed above its 50-day moving average (DMA) line with Tuesday's gain backed by higher volume. It is well below its 200 DMA after slumping as much as -19.8% from its January 5, 2022 record high.
U.S. stocks finished firmly higher Tuesday, posting their best session in nearly a month in a broad-based rally. A weaker U.S. dollar helped boost risk appetite. Additionally, signs of investor capitulation were cited as contributing to the upbeat mood, with deepening pessimism appearing to serve as a contrarian signal offering some near-term upside. A widely cited industry survey showed global fund managers had slashed their exposure to risk assets to the lowest levels since October 2008.
All 11 S&P 500 sectors closed in positive territory, with both cyclical and growth-oriented shares outperforming. In earnings, International Business Machines Corp. (IBM -5.25%) fell after slashing its cash flow forecasts. Meanwhile, Johnson & Johnson (JNJ -1.46%) fell after a reduction to its full-year outlook overshadowed otherwise positive results.
In FOREX trading, a gauge of the U.S. dollar eased 0.6%, largely due to a stronger euro, which got a boost from speculation that the European Central Bank is considering a larger 0.50% rate hike this Thursday. U.S. Treasuries declined, with the yield on the 10-year note up five basis point (0.05%) to 3.02%. The overall curve remained inverted and continues to garner attention, as it has historically preceded recessionary periods.
On the data front, housing starts fell 2% in June, compared to the prior month’s 11.9% drop. Separately, building permits dipped 0.6% during the same period. In commodities, West Texas Intermediate crude rose 1.3% to $103.97/barrel after logging its best day since May yesterday.
|
 Kenneth J. Gruneisen started out as a licensed stockbroker in August 1987, a couple of months prior to the historic stock market crash that took the Dow Jones Industrial Average down -22.6% in a single day. He has published daily fact-based fundamental and technical analysis on high-ranked stocks online for two decades. Through FACTBASEDINVESTING.COM, Kenneth provides educational articles, news, market commentary, and other information regarding proven investment systems that work in good times and bad.
Comments contained in the body of this report are technical opinions only and are not necessarily those of Gruneisen Growth Corp. The material herein has been obtained from sources believed to be reliable and accurate, however, its accuracy and completeness cannot be guaranteed. Our firm, employees, and customers may effect transactions, including transactions contrary to any recommendation herein, or have positions in the securities mentioned herein or options with respect thereto. Any recommendation contained in this report may not be suitable for all investors and it is not to be deemed an offer or solicitation on our part with respect to the purchase or sale of any securities. |
|
 |
Retail, Financial, Tech, and Commodity-Linked Groups Rose
Kenneth J. Gruneisen - Passed the CAN SLIM® Master's Exam
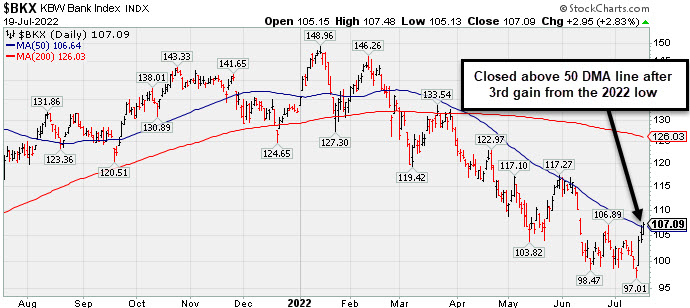
The Retail Index ($RLX +3.12%), Broker/Dealer Index ($XBD +3.23%), and Bank Index ($BKX +2.83%) each posted a solid gain and had a positive influence on the major averages. The Semiconductor Index ($SOX +4.61%) and Networking Index ($NWX +3.79%) led the tech sector higher while the Biotech Index ($BTK +1.99%) also followed with a solid gain. The Oil Services Index ($OSX +3.44%) and Integrated Oil Index ($XOI +3.26%) both posted solid gains and the Gold & Silver Index ($XAU +1.17%) rose.
PICTURED: The Bank Index ($BKX +2.83%) posted a 3rd consecutive gain, rebounding from its 2022 low to close just above its 50-day moving average (DMA) line.
| Oil Services |
$OSX |
63.22 |
+2.10 |
+3.44% |
+19.91% |
| Integrated Oil |
$XOI |
1,482.27 |
+46.77 |
+3.26% |
+25.81% |
| Semiconductor |
$SOX |
2,803.14 |
+123.57 |
+4.61% |
-28.97% |
| Networking |
$NWX |
716.77 |
+26.16 |
+3.79% |
-26.19% |
| Broker/Dealer |
$XBD |
408.34 |
+12.76 |
+3.23% |
-16.13% |
| Retail |
$RLX |
3,125.10 |
+94.67 |
+3.12% |
-26.06% |
| Gold & Silver |
$XAU |
105.87 |
+1.22 |
+1.17% |
-20.07% |
| Bank |
$BKX |
107.09 |
+2.95 |
+2.83% |
-19.01% |
| Biotech |
$BTK |
4,773.95 |
+93.27 |
+1.99% |
-13.49% |
|
|
|
 |
Pulled Back and Tested Support at 50-Day Moving Average
Kenneth J. Gruneisen - Passed the CAN SLIM® Master's Exam
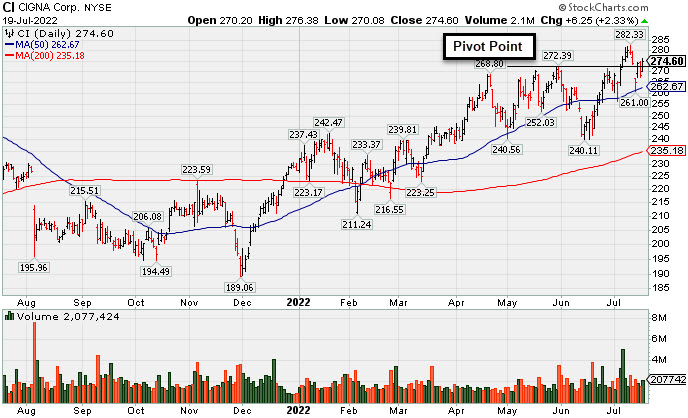
Cigna Corp (CI +$6.25 or +2.33% to $274.60) has shown strength after briefly undercutting prior highs in the $273 area and testing support at its 50-day moving average (DMA) line ($263.15) following volume-driven gains. More damaging losses would raise greater concerns.
CI was highlighted in yellow with new pivot point based on its 5/31/22 high plus 10 cents in the 7/07/22 mid-day report (read here). It was shown in greater detail that evening with an annotated graph under the headline, "Volume-Driven Breakout for Cigna Corp". It hit a new all-time high with a gain backed by +190% above average volume triggering a technical buy signal.
The number of top-rated funds owning its shares rose from 2,628 in Dec '21 to 2,739 in Jun '22, a reassuring sign concerning the I criteria. The Medical - Managed Care group is currently ranked 11th on the 197 Industry Groups list and has a Group Relative Strength Rating of 96 (A+), a reassuring sign concerning the L criteria.
CI has a 94 Earnings Per Share Rating. It is due to report Jun '22 quarterly results on 8/04/22. It reported a strong +27% earnings increase on +7% sales revenues for the Mar '22 quarter versus the year ago period, its 3rd strong quarterly comparison above the +25% minimum guideline (C criteria). Annual earnings growth (A criteria) has been strong.
|
|
|
Color Codes Explained :
Y - Better candidates highlighted by our
staff of experts.
G - Previously featured
in past reports as yellow but may no longer be buyable under the
guidelines.
***Last / Change / Volume data in this table is the closing quote data***
Symbol/Exchange
Company Name
Industry Group |
PRICE |
CHANGE
(%Change) |
Day High |
Volume
(% DAV)
(% 50 day avg vol) |
52 Wk Hi
% From Hi |
Featured
Date |
Price
Featured |
Pivot Featured |
|
Max Buy |
 LLY
-
NYSE
LLY
-
NYSE
Eli Lilly & Co
Medical-Diversified
|
$326.20
|
+4.43
1.38% |
$327.38
|
1,624,144
53.90% of 50 DAV
50 DAV is 3,013,000
|
$335.33
-2.72%
|
5/16/2022
|
$302.46
|
PP = $314.10
|
|
MB = $329.81
|
 Most Recent Note - 7/19/2022 5:13:20 PM
Y - Posted a small gain today with very light volume and held its ground with light volume totals in recent weeks. Its 50 DMA line ($308.92) defines near-term support above prior lows.
>>> FEATURED STOCK ARTICLE : Lilly Quietly Wedged to a New All-Time High This Week - 7/8/2022 |
View all notes |
Set NEW NOTE alert |
Company Profile |
SEC
News |
Chart |
Request a new note
C
A
S
I |
IMXI
-
NASDAQ
International Money Exp
Financial Svcs-Specialty
|
$22.48
|
+0.66
3.02% |
$22.50
|
363,827
91.64% of 50 DAV
50 DAV is 397,000
|
$22.94
-2.01%
|
7/1/2022
|
$21.27
|
PP = $21.38
|
|
MB = $22.45
|
Most Recent Note - 7/19/2022 5:12:33 PM
Y - Posted a 3rd consecutive gain today with lighter volume and closed 5 cents off its best ever close, perched near its 52-week high. Held its ground after it recently broke out of a "double bottom" base. Its 50 DMA line ($20.36) defines important near-term support to watch. Fundamentals through the Mar '22 quarter have been strong.
>>> FEATURED STOCK ARTICLE : Stalled Since Clearing Double Bottom Base - 7/15/2022 |
View all notes |
Set NEW NOTE alert |
Company Profile |
SEC
News |
Chart |
Request a new note
C
A
S
I |
HRMY
-
NASDAQ
Harmony Biosciences Hldg
Medical-Biomed/Biotech
|
$52.61
|
+0.12
0.23% |
$53.49
|
686,555
141.56% of 50 DAV
50 DAV is 485,000
|
$57.13
-7.91%
|
7/6/2022
|
$54.12
|
PP = $52.85
|
|
MB = $55.49
|
Most Recent Note - 7/19/2022 5:10:35 PM
Y - Managed a "positive reversal" today after undercutting recent lows in the $51.50 area. The session low ($50.18) now defines important near-term support to watch above its 50 DMA line ($45.78).
>>> FEATURED STOCK ARTICLE : Harmony Has Been Encountering Distributional Pressure - 7/18/2022 |
View all notes |
Set NEW NOTE alert |
Company Profile |
SEC
News |
Chart |
Request a new note
C
A
S
I |
CI
-
NYSE
Cigna Corp
Medical-Managed Care
|
$274.60
|
+6.25
2.33% |
$276.38
|
2,076,941
106.13% of 50 DAV
50 DAV is 1,957,000
|
$282.33
-2.74%
|
7/7/2022
|
$276.55
|
PP = $273.68
|
|
MB = $287.36
|
Most Recent Note - 7/19/2022 5:08:30 PM
Y - Posted a gain today with higher (near average) volume. Undercut prior highs in the $273 area briefly and found prompt support at its 50 DMA line ($263) following the recent technical breakout. More damaging losses would raise greater concerns. See the latest FSU analysis for more details and a new annotated graph.
>>> FEATURED STOCK ARTICLE : Pulled Back and Tested Support at 50-Day Moving Average - 7/19/2022 |
View all notes |
Set NEW NOTE alert |
Company Profile |
SEC
News |
Chart |
Request a new note
C
A
S
I |
|
|
|
THESE ARE NOT BUY RECOMMENDATIONS!
Comments contained in the body of this report are technical
opinions only. The material herein has been obtained
from sources believed to be reliable and accurate, however,
its accuracy and completeness cannot be guaranteed.
This site is not an investment advisor, hence it does
not endorse or recommend any securities or other investments.
Any recommendation contained in this report may not
be suitable for all investors and it is not to be deemed
an offer or solicitation on our part with respect to
the purchase or sale of any securities. All trademarks,
service marks and trade names appearing in this report
are the property of their respective owners, and are
likewise used for identification purposes only.
This report is a service available
only to active Paid Premium Members.
You may opt-out of receiving report notifications
at any time. Questions or comments may be submitted
by writing to Premium Membership Services 665 S.E. 10 Street, Suite 201 Deerfield Beach, FL 33441-5634 or by calling 1-800-965-8307
or 954-785-1121.
|
|
|