You are not logged in.
This means you
CAN ONLY VIEW reports that were published prior to Friday, April 18, 2025.
You
MUST UPGRADE YOUR MEMBERSHIP if you want to see any current reports.
AFTER MARKET UPDATE - MONDAY, JULY 15TH, 2024
Previous After Market Report Next After Market Report >>>
|
|
|
|
DOW |
+210.82 |
40,211.72 |
+0.53% |
|
Volume |
874,977,311 |
-3% |
|
Volume |
5,529,768,600 |
-7% |
|
NASDAQ |
+74.12 |
18,472.57 |
+0.40% |
|
Advancers |
1,582 |
58% |
|
Advancers |
2,561 |
60% |
|
S&P 500 |
+15.87 |
5,631.22 |
+0.28% |
|
Decliners |
1,159 |
42% |
|
Decliners |
1,696 |
40% |
|
Russell 2000 |
+38.76 |
2,187.02 |
+1.80% |
|
52 Wk Highs |
299 |
|
|
52 Wk Highs |
350 |
|
|
S&P 600 |
+18.91 |
1,369.37 |
+1.40% |
|
52 Wk Lows |
6 |
|
|
52 Wk Lows |
42 |
|
|
 |
Major Indices Extend Rally Hitting More Record Highs
Kenneth J. Gruneisen - Passed the CAN SLIM® Master's Exam
The Dow Jones Industrial Average (+0.5%) rallied to close at a fresh all-time high. The Russell 2000 outperformed, jumping +1.8%. The S&P 500 and Nasdaq Composite gained +0.3% and +0.4%, respectively. Volume was lighter than the prior session totals on the NYSE and on the Nasdaq exchange, revealing lackluster institutional buying demand. Breadth was positive as advancers led decliners by a 5-4 margin on the NYSE and by a 3-2 margin on the Nasdaq exchange. Leadership improved as there were 115 high-ranked companies from the Leaders List that hit new 52-week highs and were listed on the BreakOuts Page, versus the total of 102 on the prior session. New 52-week highs totals expanded again and solidly outnumbered shrinking new 52-week lows on both the NYSE and Nasdaq exchange. The major indices are in a confirmed uptrend (M criteria). Remember that any uptrend requires healthy leadership.
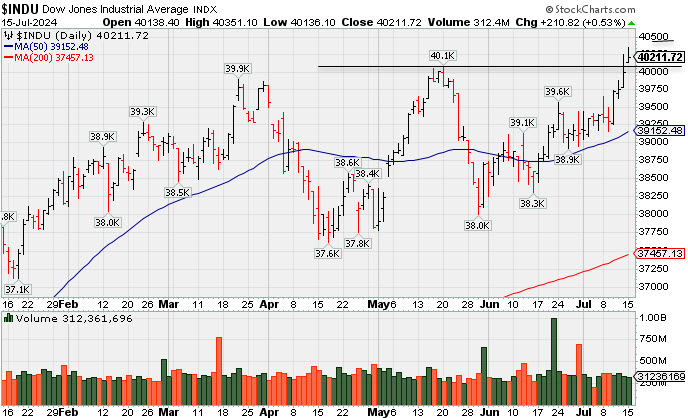 PICTURED: The Dow Jones Industrial Average posted its 4th consecutive gain and hit a new record high.
The S&P 500 financial sector was a top performer, closing +1.4% higher. The only sector to close with a larger gain was energy, up +1.6%. Meanwhile, the utilities sector was the worst performer by a wide margin, falling -2.4%. Outperforming bank stocks contributed to the market's upside bias. Goldman Sachs (GS +2.57%) was a winning standout after reporting earnings. The SPDR S&P Bank ETF (KBE) closed +2.7% higher and the SPDR S&P Regional Banking ETF (KRE) jumped +2.9%.
The positive bias was also related to the notion that the assassination attempt on former President Trump has increased his chances of winning the election in November. Mr. Trump is deemed by many to be a more market-friendly candidate due in part to his aim of deregulation and lower corporate tax rates.
Treasuries settled below their high yields. The 10-yr note yield settled four basis higher points to +4.23%, and the 2-yr note yield dropped one basis point to 4.45%.
|
 Kenneth J. Gruneisen started out as a licensed stockbroker in August 1987, a couple of months prior to the historic stock market crash that took the Dow Jones Industrial Average down -22.6% in a single day. He has published daily fact-based fundamental and technical analysis on high-ranked stocks online for two decades. Through FACTBASEDINVESTING.COM, Kenneth provides educational articles, news, market commentary, and other information regarding proven investment systems that work in good times and bad.
Comments contained in the body of this report are technical opinions only and are not necessarily those of Gruneisen Growth Corp. The material herein has been obtained from sources believed to be reliable and accurate, however, its accuracy and completeness cannot be guaranteed. Our firm, employees, and customers may effect transactions, including transactions contrary to any recommendation herein, or have positions in the securities mentioned herein or options with respect thereto. Any recommendation contained in this report may not be suitable for all investors and it is not to be deemed an offer or solicitation on our part with respect to the purchase or sale of any securities. |
|
 |
Energy, Financial, and Networking Indexes Posted Gains
Kenneth J. Gruneisen - Passed the CAN SLIM® Master's Exam
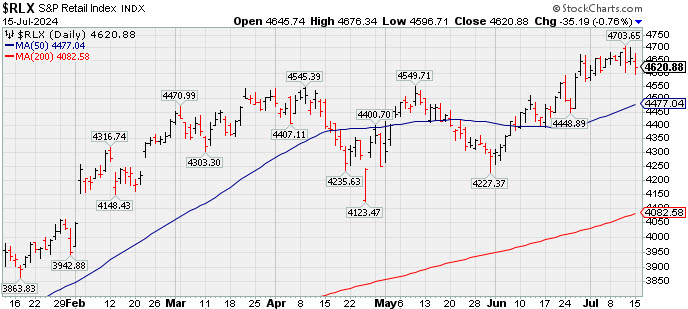
The Broker/Dealer Index ($XBD +1.75%) and the Bank Index ($BKX +1.71%) posted influential gains on Monday while the Retail Index ($RLX -0.76%) created a drag with a modest loss. The tech sector was mixed as the Networking Index ($NWX +1.06%) rose, the Biotech Index ($BTK -0.36%) edged lower, and Semiconductor Index ($SOX +0.04%) finished flat. The Oil Services Index ($OSX +3.85%) and the Integrated Oil Index ($XOI +1.52%) both posted solid gains while the Gold & Silver Index ($XAU -0.60%).
PICTURED: The Retail Index ($RLX -0.76%) pulled back on Monday , consolidating after recently reaching a new all-time high.
| Oil Services |
$OSX |
90.57 |
+3.36 |
+3.85% |
+7.98% |
| Integrated Oil |
$XOI |
2,061.19 |
+30.79 |
+1.52% |
+10.67% |
| Semiconductor |
$SOX |
5,777.71 |
+2.51 |
+0.04% |
+38.37% |
| Networking |
$NWX |
884.62 |
+9.26 |
+1.06% |
+6.22% |
| Broker/Dealer |
$XBD |
663.77 |
+11.42 |
+1.75% |
+19.11% |
| Retail |
$RLX |
4,620.88 |
-35.19 |
-0.76% |
+18.83% |
| Gold & Silver |
$XAU |
152.82 |
-0.92 |
-0.60% |
+21.58% |
| Bank |
$BKX |
110.64 |
+1.86 |
+1.71% |
+15.23% |
| Biotech |
$BTK |
5,499.33 |
-19.73 |
-0.36% |
+1.49% |
|
|
|
 |
Consolidating Near Prior Highs Which Define Support
Kenneth J. Gruneisen - Passed the CAN SLIM® Master's Exam
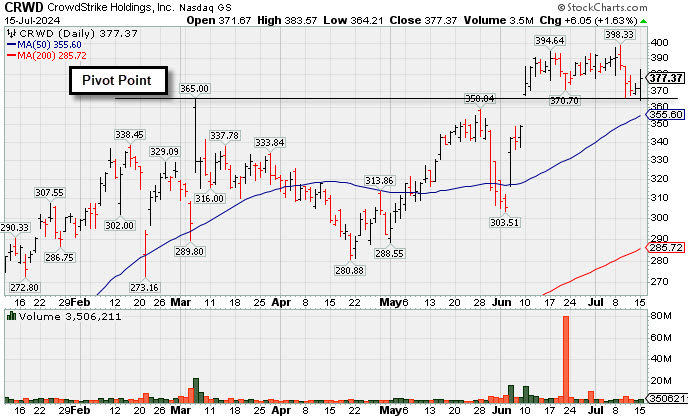
CrowdStrike Holdings (CRWD +$6.05 or +1.63% to $377.37) is consolidating near its prior highs after quietly retreating this week below its "max buy" level. Prior highs in the $358-365 area define initial support to watch above its 50-day moving average (DMA) line ($354).
Fundamentals remain strong. CRWD reported Apr '24 quarterly earnings +63% on +33% sales revenues versus the year-ago period, continuing its strong track record of earnings increases well above the +25% minimum guideline (C criteria) in quarterly comparisons backed by solid sales revenues growth. It has a highest possible 99 Earnings Per Share Rating. Its annual earnings (A criteria) history has been strong.
The number of top-rated funds owning its shares rose from 1,880 in Jun 23 to 2,560 in Jun '24, a reassuring sign concerning the I criteria. Its current Up/Down Volume Ratio of 0.8 is an unbiased indication its shares have been under distributional pressure over the past 50 days. The Austin, TX-based company completed its $34 IPO on 6/12/19.
Chart courtesy of www.stockcharts.com
 Symbol/Exchange
Company Name
Industry Group | PRICE | CHANGE
(%Change) | Day High | Volume
(% DAV)
(% 50 day avg vol) | 52 Wk Hi
% From Hi | Featured
Date | Price
Featured | Pivot Featured | | Max Buy |  TDG - NYSE TDG - NYSE
TransDigm Group
Aerospace/Defense | $1,241.94 | -0.37
-0.03% | $1,250.03 | 371,129
149.05% of 50 DAV
50 DAV is 249,000 | $1,369.58
-9.32%
| 4/12/2024 | $1,224.21 | PP = $1,246.32 | | MB = $1,308.64 | Most Recent Note - 7/12/2024 12:40:59 PM
G - Sputtering today and still lingering below its 50 DMA line ($1,304), however, it remains only -8.9% off its all-time high. A rebound above the 50 DMA line is needed to help its outlook improve. Fundamentals remain strong.
>>> FEATURED STOCK ARTICLE : Lingering Below 50-Day Moving Average But Only -7% Off High - 7/10/2024 | View all notes | Set NEW NOTE alert | Company Profile | SEC News | Chart | Request a new note C A S I | USLM - NASDAQ
U.S. Lime & Minerals
Bldg-Cement/Concrt/Ag | $81.77 | +2.69
3.41% | $82.99 | 123,714
102.24% of 50 DAV
50 DAV is 121,000 | $81.68
0.11%
| 6/18/2024 | $71.26 | PP = $75.77 | | MB = $79.56 |  Most Recent Note - 7/15/2024 6:05:21 PM Most Recent Note - 7/15/2024 6:05:21 PM
Y - Gapped up today and hit another new all-time high with a 4th consecutive gain. Found support while consolidating above its 50 DMA line ($71). Do not be confused as shares split 5:1 (Featured Price and Pivor Point were adjusted). Color code was changed to yellow with new pivot point cited based on its 5/15/24 high plus 10 cents as it was noted - "Subsequent gains above the pivot point backed by at least +40% above average volume may trigger a new (or add-on) technical buy signal."
>>> FEATURED STOCK ARTICLE : in Striking Distance of All-Time High After Volume-Driven Gains - 6/28/2024 | View all notes | Set NEW NOTE alert | Company Profile | SEC News | Chart | Request a new note C A S I | CLS - NYSE
Celestica
Elec-Contract Mfg | $61.23 | +1.83
3.08% | $62.17 | 2,030,171
95.00% of 50 DAV
50 DAV is 2,137,000 | $62.09
-1.39%
| 7/6/2024 | $57.62 | PP = $61.16 | | MB = $64.22 | Most Recent Note - 7/15/2024 6:01:20 PM
Y - Hovering near its all-time high. A gain backed by at least +40% above average volume and a close above the new pivot point cited based on its 5/28/24 high plus 10 cents may trigger a proper technical buy signal. Important support is at its 50 DMA line ($54.60).
>>> FEATURED STOCK ARTICLE : Consolidating Above Prior Highs in an Orderly Fashion - 6/27/2024 | View all notes | Set NEW NOTE alert | Company Profile | SEC News | Chart | Request a new note C A S I | ELF - NYSE
e.l.f. Beauty
Cosmetics/Personal Care | $194.19 | -16.71
-7.92% | $210.88 | 2,032,660
132.25% of 50 DAV
50 DAV is 1,537,000 | $221.83
-12.46%
| 6/18/2024 | $212.40 | PP = $221.93 | | MB = $233.03 | Most Recent Note - 7/15/2024 5:57:39 PM
Y - Suffered a big loss today with +32% above average volume and ended near the session low, encountering distributional pressure after challenging prior resistance in the $220 area. Subsequent gains above the pivot point backed by at least +40% above average volume may trigger a new (or add-on) technical buy signal. Its 50 DMA line ($186) defines important near-term support to watch. See the latest FSU analysis for more details and a new annotated graph.
>>> FEATURED STOCK ARTICLE : Challenging Prior Resistance Area - 7/12/2024 | View all notes | Set NEW NOTE alert | Company Profile | SEC News | Chart | Request a new note C A S I | PDD - NASDAQ
PDD Holdings ADR
Retail-Internet | $137.99 | -4.43
-3.11% | $139.43 | 8,097,272
88.47% of 50 DAV
50 DAV is 9,153,000 | $164.69
-16.21%
| 5/24/2024 | $161.85 | PP = $153.09 | | MB = $160.74 | Most Recent Note - 7/15/2024 5:59:49 PM
G - With today''s loss it pulled back below its 50 DMA line which has acted as resistance. Faces resistance due to overhead supply up to the $164 level. Its 200 DMA line ($129) defines important near-term support.
>>> FEATURED STOCK ARTICLE : Sputtering Below 50-Day Moving Average Line - 7/11/2024 | View all notes | Set NEW NOTE alert | Company Profile | SEC News | Chart | Request a new note C A S I | Symbol/Exchange
Company Name
Industry Group | PRICE | CHANGE
(%Change) | Day High | Volume
(% DAV)
(% 50 day avg vol) | 52 Wk Hi
% From Hi | Featured
Date | Price
Featured | Pivot Featured | | Max Buy | CRWD - NASDAQ
CrowdStrike Holdings
Computer Sftwr-Security | $377.37 | +6.05
1.63% | $383.57 | 3,505,911
68.12% of 50 DAV
50 DAV is 5,147,000 | $398.33
-5.26%
| 5/28/2024 | $351.47 | PP = $365.10 | | MB = $383.36 | Most Recent Note - 7/15/2024 5:52:23 PM
Y - Consolidating above prior highs in the $358-365 area which define initial support to watch above its 50 DMA line ($355). Fundamentals remain strong. See the latest FSU analysis for more details and a new annotated graph.
>>> FEATURED STOCK ARTICLE : Consolidating Near Prior Highs Which Define Support - 7/15/2024 | View all notes | Set NEW NOTE alert | Company Profile | SEC News | Chart | Request a new note C A S I | NVO - NYSE
Novo Nordisk ADR
Medical-Ethical Drugs | $141.39 | -0.69
-0.49% | $143.49 | 2,306,659
60.27% of 50 DAV
50 DAV is 3,827,000 | $148.15
-4.56%
| 6/7/2024 | $143.06 | PP = $138.38 | | MB = $145.30 | Most Recent Note - 7/15/2024 5:55:51 PM
Y - Pulled back today with below-average volume. Consolidating above prior highs in the $138 area which define initial support to watch above its 50 DMA line ($137.50). Fundamentals remain strong.
>>> FEATURED STOCK ARTICLE : Perched Near All-Time High Following Recent Gap Up With Volume - 7/1/2024 | View all notes | Set NEW NOTE alert | Company Profile | SEC News | Chart | Request a new note C A S I | GVA - NYSE
Granite Construction
Bldg-Heavy Construction | $64.31 | +1.13
1.79% | $65.14 | 520,415
86.02% of 50 DAV
50 DAV is 605,000 | $65.08
-1.18%
| 6/11/2024 | $59.76 | PP = $64.33 | | MB = $67.55 | Most Recent Note - 7/15/2024 5:55:07 PM
Y - Hit a new all-time high with today''s 4th consecutive gain backed by average volume after 3 gains with higher volume. Subsequent gains and a close above the pivot point backed by at least +40% above average volume may clinch a proper technical buy signal.
>>> FEATURED STOCK ARTICLE : Granite Testing Support at 50-Day Moving Average - 7/2/2024 | View all notes | Set NEW NOTE alert | Company Profile | SEC News | Chart | Request a new note C A S I | DDOG - NASDAQ
Datadog Inc
Computer Sftwr-Enterprse | $129.42 | +1.62
1.26% | $130.60 | 2,276,684
54.16% of 50 DAV
50 DAV is 4,203,800 | $138.61
-6.63%
| 7/9/2024 | $126.92 | PP = $138.71 | | MB = $145.65 | Most Recent Note - 7/12/2024 6:44:48 PM
Y - Pulled back after highlighted in yellow in the 7/09/24 mid-day report with pivot point cited based on its 2/13/24 high plus 10 cents. Consolidating above its 50 DMA line and perched -7.8% off its 52-week high. Reported Mar ''24 quarterly earnings +91% on +27% sales revenues versus the year-ago period its 4th consecutive quarterly comparison well above the +25% minimum earnings guideline (C criteria). Its annual earnings (A criteria) history has been strong since completing its $27 IPO on 9/19/19.
>>> FEATURED STOCK ARTICLE : Consolidating Within Close Range of 52-Week High - 7/9/2024 | View all notes | Set NEW NOTE alert | Company Profile | SEC News | Chart | Request a new note C A S I |
|
|
|
Color Codes Explained :
Y - Better candidates highlighted by our
staff of experts.
G - Previously featured
in past reports as yellow but may no longer be buyable under the
guidelines.
***Last / Change / Volume data in this table is the closing quote data***
Symbol/Exchange
Company Name
Industry Group |
PRICE |
CHANGE
(%Change) |
Day High |
Volume
(% DAV)
(% 50 day avg vol) |
52 Wk Hi
% From Hi |
Featured
Date |
Price
Featured |
Pivot Featured |
|
Max Buy |
 TDG
-
NYSE
TDG
-
NYSE
TransDigm Group
Aerospace/Defense
|
$1,237.97
|
-4.34
-0.35% |
$1,250.03
|
159,336
63.99% of 50 DAV
50 DAV is 249,000
|
$1,369.58
-9.61%
|
4/12/2024
|
$1,224.21
|
PP = $1,246.32
|
|
MB = $1,308.64
|
Most Recent Note - 7/12/2024 12:40:59 PM
G - Sputtering today and still lingering below its 50 DMA line ($1,304), however, it remains only -8.9% off its all-time high. A rebound above the 50 DMA line is needed to help its outlook improve. Fundamentals remain strong.
>>> FEATURED STOCK ARTICLE : Lingering Below 50-Day Moving Average But Only -7% Off High - 7/10/2024 |
View all notes |
Set NEW NOTE alert |
Company Profile |
SEC
News |
Chart |
Request a new note
C
A
S
I |
USLM
-
NASDAQ
U.S. Lime & Minerals
Bldg-Cement/Concrt/Ag
|
$82.19
|
+3.12
3.94% |
$82.90
|
57,158
47.24% of 50 DAV
50 DAV is 121,000
|
$81.68
0.62%
|
6/18/2024
|
$356.30
|
PP = $378.88
|
|
MB = $397.82
|
Most Recent Note - 7/12/2024 12:45:39 PM
Y - Hitting a new all-time high with today's 3rd consecutive gain backed by ever-increasing volume. Found support while consolidating above its 50 DMA line ($353). Color code was changed to yellow with new pivot point cited based on its 5/15/24 high plus 10 cents as it was noted - "Subsequent gains above the pivot point backed by at least +40% above average volume may trigger a new (or add-on) technical buy signal."
>>> FEATURED STOCK ARTICLE : in Striking Distance of All-Time High After Volume-Driven Gains - 6/28/2024 |
View all notes |
Set NEW NOTE alert |
Company Profile |
SEC
News |
Chart |
Request a new note
C
A
S
I |
CLS
-
NYSE
Celestica
Elec-Contract Mfg
|
$60.31
|
+0.91
1.53% |
$62.17
|
1,049,820
49.13% of 50 DAV
50 DAV is 2,137,000
|
$62.09
-2.87%
|
7/6/2024
|
$57.62
|
PP = $61.16
|
|
MB = $64.22
|
Most Recent Note - 7/12/2024 6:49:20 PM
Y - Stalled this week after hitting a new all-time high with gains lacking great volume conviction. A gain backed by at least +40% above average volume and a close above the new pivot point cited based on its 5/28/24 high plus 10 cents may trigger a proper technical buy signal. Important support is at its 50 DMA line ($54.24).
>>> FEATURED STOCK ARTICLE : Consolidating Above Prior Highs in an Orderly Fashion - 6/27/2024 |
View all notes |
Set NEW NOTE alert |
Company Profile |
SEC
News |
Chart |
Request a new note
C
A
S
I |
ELF
-
NYSE
e.l.f. Beauty
Cosmetics/Personal Care
|
$198.90
|
-12.00
-5.69% |
$210.88
|
946,466
61.58% of 50 DAV
50 DAV is 1,537,000
|
$221.83
-10.34%
|
6/18/2024
|
$212.40
|
PP = $221.93
|
|
MB = $233.03
|
Most Recent Note - 7/12/2024 6:47:18 PM
Y - Challenged prior resistance in the $220 area but churned higher volume today and ended near the session low after erasing much of its early gain. Subsequent gains above the pivot point backed by at least +40% above average volume may trigger a new (or add-on) technical buy signal. Its 50 DMA line ($186) defines important near-term support to watch. See the latest FSU analysis for more details and a new annotated graph.
>>> FEATURED STOCK ARTICLE : Challenging Prior Resistance Area - 7/12/2024 |
View all notes |
Set NEW NOTE alert |
Company Profile |
SEC
News |
Chart |
Request a new note
C
A
S
I |
PDD
-
NASDAQ
PDD Holdings ADR
Retail-Internet
|
$138.28
|
-4.14
-2.91% |
$139.07
|
4,767,214
52.08% of 50 DAV
50 DAV is 9,153,000
|
$164.69
-16.04%
|
5/24/2024
|
$161.85
|
PP = $153.09
|
|
MB = $160.74
|
Most Recent Note - 7/12/2024 6:51:41 PM
G - Posted a 4th consecutive gain as it rebounded to its 50 DMA line helping its outlook to improve, but it still faces near-term resistance due to overhead supply up to the $164 level. Its 200 DMA line ($128) defines important near-term support. See the latest FSU analysis for more details and an annotated graph.
>>> FEATURED STOCK ARTICLE : Sputtering Below 50-Day Moving Average Line - 7/11/2024 |
View all notes |
Set NEW NOTE alert |
Company Profile |
SEC
News |
Chart |
Request a new note
C
A
S
I |
Symbol/Exchange
Company Name
Industry Group |
PRICE |
CHANGE
(%Change) |
Day High |
Volume
(% DAV)
(% 50 day avg vol) |
52 Wk Hi
% From Hi |
Featured
Date |
Price
Featured |
Pivot Featured |
|
Max Buy |
CRWD
-
NASDAQ
CrowdStrike Holdings
Computer Sftwr-Security
|
$375.76
|
+4.44
1.20% |
$383.57
|
1,788,119
34.74% of 50 DAV
50 DAV is 5,147,000
|
$398.33
-5.67%
|
5/28/2024
|
$351.47
|
PP = $365.10
|
|
MB = $383.36
|
Most Recent Note - 7/12/2024 6:43:05 PM
Y - Color code is changed to yellow after quietly retreating this week below its "max buy" level. Prior highs in the $358-365 area define initial support to watch above its 50 DMA line ($354). Fundamentals remain strong.
>>> FEATURED STOCK ARTICLE : Encountered Distributional Pressure Hovering Near All-Time High - 6/21/2024 |
View all notes |
Set NEW NOTE alert |
Company Profile |
SEC
News |
Chart |
Request a new note
C
A
S
I |
NVO
-
NYSE
Novo Nordisk ADR
Medical-Ethical Drugs
|
$141.81
|
-0.27
-0.19% |
$143.49
|
1,220,239
31.89% of 50 DAV
50 DAV is 3,827,000
|
$148.15
-4.28%
|
6/7/2024
|
$143.06
|
PP = $138.38
|
|
MB = $145.30
|
Most Recent Note - 7/11/2024 5:02:48 PM
Y - Pulled back today with near-average volume. Consolidating above prior highs in the $138 area which define initial support to watch above its 50 DMA line ($137). Fundamentals remain strong.
>>> FEATURED STOCK ARTICLE : Perched Near All-Time High Following Recent Gap Up With Volume - 7/1/2024 |
View all notes |
Set NEW NOTE alert |
Company Profile |
SEC
News |
Chart |
Request a new note
C
A
S
I |
GVA
-
NYSE
Granite Construction
Bldg-Heavy Construction
|
$64.44
|
+1.26
1.99% |
$65.14
|
132,307
21.87% of 50 DAV
50 DAV is 605,000
|
$65.08
-0.98%
|
6/11/2024
|
$59.76
|
PP = $64.33
|
|
MB = $67.55
|
Most Recent Note - 7/11/2024 5:01:32 PM
Y - Rebounded above its 50 DMA line ($61.17) with today's 2nd consecutive volume-driven gain helping its outlook improve and its color code is changed to yellow.
>>> FEATURED STOCK ARTICLE : Granite Testing Support at 50-Day Moving Average - 7/2/2024 |
View all notes |
Set NEW NOTE alert |
Company Profile |
SEC
News |
Chart |
Request a new note
C
A
S
I |
DDOG
-
NASDAQ
Datadog Inc
Computer Sftwr-Enterprse
|
$129.97
|
+2.17
1.70% |
$130.60
|
1,185,137
28.19% of 50 DAV
50 DAV is 4,203,800
|
$138.61
-6.23%
|
7/9/2024
|
$126.92
|
PP = $138.71
|
|
MB = $145.65
|
Most Recent Note - 7/12/2024 6:44:48 PM
Y - Pulled back after highlighted in yellow in the 7/09/24 mid-day report with pivot point cited based on its 2/13/24 high plus 10 cents. Consolidating above its 50 DMA line and perched -7.8% off its 52-week high. Reported Mar '24 quarterly earnings +91% on +27% sales revenues versus the year-ago period its 4th consecutive quarterly comparison well above the +25% minimum earnings guideline (C criteria). Its annual earnings (A criteria) history has been strong since completing its $27 IPO on 9/19/19.
>>> FEATURED STOCK ARTICLE : Consolidating Within Close Range of 52-Week High - 7/9/2024 |
View all notes |
Set NEW NOTE alert |
Company Profile |
SEC
News |
Chart |
Request a new note
C
A
S
I |
|
|
|
THESE ARE NOT BUY RECOMMENDATIONS!
Comments contained in the body of this report are technical
opinions only. The material herein has been obtained
from sources believed to be reliable and accurate, however,
its accuracy and completeness cannot be guaranteed.
This site is not an investment advisor, hence it does
not endorse or recommend any securities or other investments.
Any recommendation contained in this report may not
be suitable for all investors and it is not to be deemed
an offer or solicitation on our part with respect to
the purchase or sale of any securities. All trademarks,
service marks and trade names appearing in this report
are the property of their respective owners, and are
likewise used for identification purposes only.
This report is a service available
only to active Paid Premium Members.
You may opt-out of receiving report notifications
at any time. Questions or comments may be submitted
by writing to Premium Membership Services 665 S.E. 10 Street, Suite 201 Deerfield Beach, FL 33441-5634 or by calling 1-800-965-8307
or 954-785-1121.
|
|
|