You are not logged in.
This means you
CAN ONLY VIEW reports that were published prior to Sunday, March 23, 2025.
You
MUST UPGRADE YOUR MEMBERSHIP if you want to see any current reports.
AFTER MARKET UPDATE - FRIDAY, JULY 12TH, 2024
Previous After Market Report Next After Market Report >>>
|
|
|
|
DOW |
+247.15 |
40,000.90 |
+0.62% |
|
Volume |
904,833,512 |
-7% |
|
Volume |
5,945,220,100 |
-7% |
|
NASDAQ |
+115.04 |
18,398.45 |
+0.63% |
|
Advancers |
2,081 |
76% |
|
Advancers |
3,061 |
72% |
|
S&P 500 |
+30.81 |
5,615.35 |
+0.55% |
|
Decliners |
664 |
24% |
|
Decliners |
1,189 |
28% |
|
Russell 2000 |
+23.23 |
2,148.27 |
+1.09% |
|
52 Wk Highs |
291 |
|
|
52 Wk Highs |
326 |
|
|
S&P 600 |
+12.11 |
1,350.46 |
+0.90% |
|
52 Wk Lows |
7 |
|
|
52 Wk Lows |
43 |
|
|
 |
Breadth Positive as Major Indices Continue Record Rally
Kenneth J. Gruneisen - Passed the CAN SLIM® Master's Exam
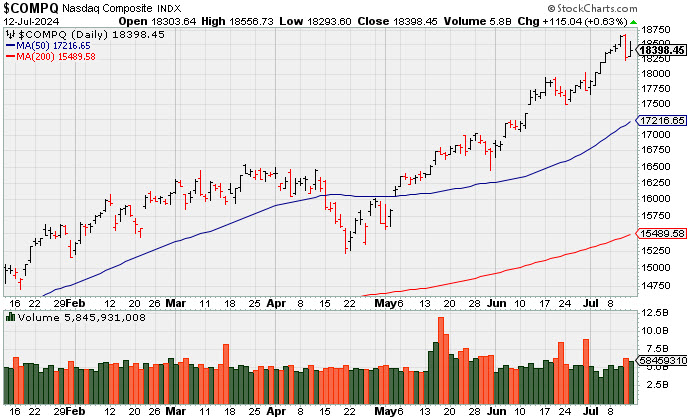
There were unanimous gains on Friday for the S&P 500 (+0.6%), Dow Jones Industrial Average (+0.6%), Nasdaq Composite (+0.6%), and Russell 2000 (+1.1%). Volume was lighter than the prior session totals on the NYSE and on the Nasdaq exchange. Breadth was clearly positive as advancers led decliners by a 3-1 margin on the NYSE and by nearly a 3-1 margin on the Nasdaq exchange. Leadership improved as there were 102 high-ranked companies from the Leaders List that hit new 52-week highs and were listed on the BreakOuts Page, versus the total of 102 on the prior session. New 52-week highs totals expanded and solidly outnumbered shrinking new 52-week lows on both the NYSE and Nasdaq exchange. The major indices are in a confirmed uptrend (M criteria). Remember that any uptrend requires healthy leadership.
PICTURED: The Nasdaq Composite Index posted its 11th gain in the span of 13 sessions.
There was a hotter-than-expected Producer Price Index for June and upward revisions to the numbers in May. Total PPI was up 0.2% versus an expected 0.1% increase and Core PPI was up 0.4% versus an expected 0.1% increase. The 10-yr yield settled unchanged at 4.19% and the 2-yr note yield settled down five basis points to 4.46%.
Bank stocks were weaker despite beating earnings estimates after quarterly results from JPMorgan Chase (JPM -1.21%), Citigroup (C -1.81%), and Wells Fargo (WFC -6.02%). The S&P 500 financial sector eked out a 0.2% gain but was near the bottom of the 11 sectors. The consumer discretionary (+1.0%) and information technology (+0.9%) sectors were among the top performers.
|
 Kenneth J. Gruneisen started out as a licensed stockbroker in August 1987, a couple of months prior to the historic stock market crash that took the Dow Jones Industrial Average down -22.6% in a single day. He has published daily fact-based fundamental and technical analysis on high-ranked stocks online for two decades. Through FACTBASEDINVESTING.COM, Kenneth provides educational articles, news, market commentary, and other information regarding proven investment systems that work in good times and bad.
Comments contained in the body of this report are technical opinions only and are not necessarily those of Gruneisen Growth Corp. The material herein has been obtained from sources believed to be reliable and accurate, however, its accuracy and completeness cannot be guaranteed. Our firm, employees, and customers may effect transactions, including transactions contrary to any recommendation herein, or have positions in the securities mentioned herein or options with respect thereto. Any recommendation contained in this report may not be suitable for all investors and it is not to be deemed an offer or solicitation on our part with respect to the purchase or sale of any securities. |
|
 |
Tech, Retail, Broker/Dealer, and Oil Services Indexes Rose
Kenneth J. Gruneisen - Passed the CAN SLIM® Master's Exam
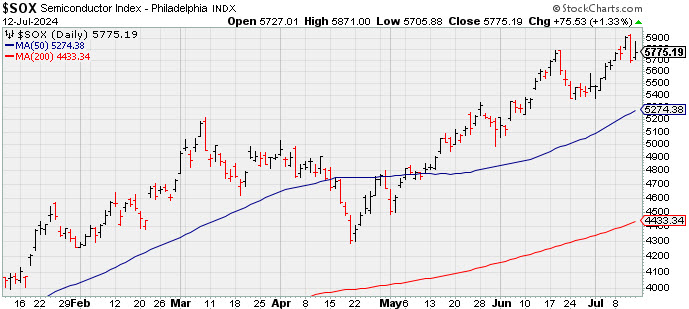
The Retail Index ($RLX +0.30%) and the Broker/Dealer Index ($XBD +0.45%) both posted modest gains while the Bank Index ($BKX -0.25%) lost ground on Friday. The tech sector had a positive bias as the Semiconductor Index ($SOX +1.33%), Networking Index ($NWX +1.56%), and the Biotech Index ($BTK +0.58%) each posted gains. The Oil Services Index ($OSX +1.05%) outpaced the Gold & Silver Index ($XAU +0.35%) and the Integrated Oil Index ($XOI +0.13%).
PICTURED: The Semiconductor Index ($SOX +1.33%) posted a solid gain on Friday after pulling back from its all-time high.
| Oil Services |
$OSX |
87.21 |
+0.91 |
+1.05% |
+3.97% |
| Integrated Oil |
$XOI |
2,030.40 |
+2.67 |
+0.13% |
+9.02% |
| Semiconductor |
$SOX |
5,775.19 |
+75.53 |
+1.33% |
+38.31% |
| Networking |
$NWX |
875.36 |
+13.47 |
+1.56% |
+5.11% |
| Broker/Dealer |
$XBD |
652.34 |
+2.93 |
+0.45% |
+17.06% |
| Retail |
$RLX |
4,656.07 |
+13.83 |
+0.30% |
+19.73% |
| Gold & Silver |
$XAU |
153.73 |
+0.53 |
+0.35% |
+22.31% |
| Bank |
$BKX |
108.78 |
-0.27 |
-0.25% |
+13.29% |
| Biotech |
$BTK |
5,519.07 |
+31.71 |
+0.58% |
+1.85% |
|
|
|
 |
Challenging Prior Resistance Area
Kenneth J. Gruneisen - Passed the CAN SLIM® Master's Exam
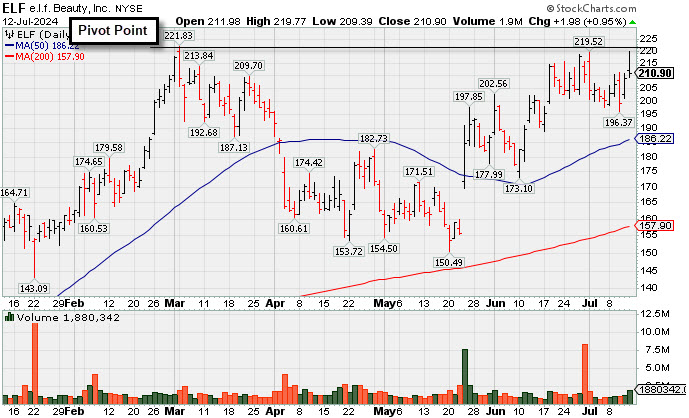
e.l.f. Beauty (ELF +$1.98 or +0.95% to $210.90) posted a small gain today while churning higher volume as it erased much of its early gain and ended near the session low. It has met stubborn resistance in the $219-221 area in recent months. Its color code was changed to yellow with new pivot point cited based on its 3/04/24 high plus 10 cents. Subsequent gains above the pivot point backed by at least +40% above average volume may trigger a new (or add-on) technical buy signal. Its 50-day moving average (DMA) line ($186) defines important near-term support to watch.
ELF was highlighted in yellow in the 5/24/24 mid-day report (read here) with pivot point cited based on its 4/29/24 high after breaking out a "double-bottom" base. It was last shown in detail in the 6/20/24 report with an annotated graph under the headline, "Perched Within Striking Distance of All-Time High". It currently has a 98 Earnings Per Share rating. It reported Mar '24 quarterly earnings +26% on +71% sales revenues versus the year-ago period, adding to its streak of very strong quarterly results above the +25% minimum earnings guideline (C criteria). Annual earnings (A criteria) history over the past 3 years has been strong, making it a better match with the fact-based investment system's fundamental guidelines.
The number of top-rated funds owning its shares rose from 510 in Mar '23 to 858 in Jun '24, a very reassuring sign concerning the I criteria. Its current Up/Down Volume Ratio of 0.8 is an unbiased indication its shares have been under distributional pressure over the past 50 days. It currently has a Timeliness Rating of C and a Sponsorship Rating of D. Its small supply (S criteria) of only 55.9 million shares outstanding can contribute to greater price volatility in the event of institutional buying or selling.
|
|
|
Color Codes Explained :
Y - Better candidates highlighted by our
staff of experts.
G - Previously featured
in past reports as yellow but may no longer be buyable under the
guidelines.
***Last / Change / Volume data in this table is the closing quote data***
Symbol/Exchange
Company Name
Industry Group |
PRICE |
CHANGE
(%Change) |
Day High |
Volume
(% DAV)
(% 50 day avg vol) |
52 Wk Hi
% From Hi |
Featured
Date |
Price
Featured |
Pivot Featured |
|
Max Buy |
 TDG
-
NYSE
TDG
-
NYSE
TransDigm Group
Aerospace/Defense
|
$1,242.31
|
-13.33
-1.06% |
$1,261.97
|
409,733
166.56% of 50 DAV
50 DAV is 246,000
|
$1,369.58
-9.29%
|
4/12/2024
|
$1,224.21
|
PP = $1,246.32
|
|
MB = $1,308.64
|
 Most Recent Note - 7/12/2024 12:40:59 PM
G - Sputtering today and still lingering below its 50 DMA line ($1,304), however, it remains only -8.9% off its all-time high. A rebound above the 50 DMA line is needed to help its outlook improve. Fundamentals remain strong.
>>> FEATURED STOCK ARTICLE : Lingering Below 50-Day Moving Average But Only -7% Off High - 7/10/2024 |
View all notes |
Set NEW NOTE alert |
Company Profile |
SEC
News |
Chart |
Request a new note
C
A
S
I |
USLM
-
NASDAQ
U.S. Lime & Minerals
Bldg-Cement/Concrt/Ag
|
$395.38
|
+22.75
6.11% |
$396.00
|
37,322
155.51% of 50 DAV
50 DAV is 24,000
|
$378.78
4.38%
|
6/18/2024
|
$356.30
|
PP = $378.88
|
|
MB = $397.82
|
Most Recent Note - 7/12/2024 12:45:39 PM
Y - Hitting a new all-time high with today's 3rd consecutive gain backed by ever-increasing volume. Found support while consolidating above its 50 DMA line ($353). Color code was changed to yellow with new pivot point cited based on its 5/15/24 high plus 10 cents as it was noted - "Subsequent gains above the pivot point backed by at least +40% above average volume may trigger a new (or add-on) technical buy signal."
>>> FEATURED STOCK ARTICLE : in Striking Distance of All-Time High After Volume-Driven Gains - 6/28/2024 |
View all notes |
Set NEW NOTE alert |
Company Profile |
SEC
News |
Chart |
Request a new note
C
A
S
I |
CLS
-
NYSE
Celestica
Elec-Contract Mfg
|
$59.40
|
-0.08
-0.13% |
$60.71
|
1,200,922
55.83% of 50 DAV
50 DAV is 2,151,000
|
$62.09
-4.33%
|
7/6/2024
|
$57.62
|
PP = $61.16
|
|
MB = $64.22
|
Most Recent Note - 7/12/2024 6:49:20 PM
Y - Stalled this week after hitting a new all-time high with gains lacking great volume conviction. A gain backed by at least +40% above average volume and a close above the new pivot point cited based on its 5/28/24 high plus 10 cents may trigger a proper technical buy signal. Important support is at its 50 DMA line ($54.24).
>>> FEATURED STOCK ARTICLE : Consolidating Above Prior Highs in an Orderly Fashion - 6/27/2024 |
View all notes |
Set NEW NOTE alert |
Company Profile |
SEC
News |
Chart |
Request a new note
C
A
S
I |
ELF
-
NYSE
e.l.f. Beauty
Cosmetics/Personal Care
|
$210.90
|
+1.98
0.95% |
$219.77
|
1,893,382
123.51% of 50 DAV
50 DAV is 1,533,000
|
$221.83
-4.93%
|
6/18/2024
|
$212.40
|
PP = $221.93
|
|
MB = $233.03
|
Most Recent Note - 7/12/2024 6:47:18 PM
Y - Challenged prior resistance in the $220 area but churned higher volume today and ended near the session low after erasing much of its early gain. Subsequent gains above the pivot point backed by at least +40% above average volume may trigger a new (or add-on) technical buy signal. Its 50 DMA line ($186) defines important near-term support to watch. See the latest FSU analysis for more details and a new annotated graph.
>>> FEATURED STOCK ARTICLE : Challenging Prior Resistance Area - 7/12/2024 |
View all notes |
Set NEW NOTE alert |
Company Profile |
SEC
News |
Chart |
Request a new note
C
A
S
I |
PDD
-
NASDAQ
PDD Holdings ADR
Retail-Internet
|
$142.42
|
+3.18
2.28% |
$145.06
|
8,877,538
97.32% of 50 DAV
50 DAV is 9,122,000
|
$164.69
-13.52%
|
5/24/2024
|
$161.85
|
PP = $153.09
|
|
MB = $160.74
|
Most Recent Note - 7/12/2024 6:51:41 PM
G - Posted a 4th consecutive gain as it rebounded to its 50 DMA line helping its outlook to improve, but it still faces near-term resistance due to overhead supply up to the $164 level. Its 200 DMA line ($128) defines important near-term support. See the latest FSU analysis for more details and an annotated graph.
>>> FEATURED STOCK ARTICLE : Sputtering Below 50-Day Moving Average Line - 7/11/2024 |
View all notes |
Set NEW NOTE alert |
Company Profile |
SEC
News |
Chart |
Request a new note
C
A
S
I |
Symbol/Exchange
Company Name
Industry Group |
PRICE |
CHANGE
(%Change) |
Day High |
Volume
(% DAV)
(% 50 day avg vol) |
52 Wk Hi
% From Hi |
Featured
Date |
Price
Featured |
Pivot Featured |
|
Max Buy |
CRWD
-
NASDAQ
CrowdStrike Holdings
Computer Sftwr-Security
|
$371.32
|
+0.89
0.24% |
$374.49
|
2,607,976
50.81% of 50 DAV
50 DAV is 5,133,000
|
$398.33
-6.78%
|
5/28/2024
|
$351.47
|
PP = $365.10
|
|
MB = $383.36
|
Most Recent Note - 7/12/2024 6:43:05 PM
Y - Color code is changed to yellow after quietly retreating this week below its "max buy" level. Prior highs in the $358-365 area define initial support to watch above its 50 DMA line ($354). Fundamentals remain strong.
>>> FEATURED STOCK ARTICLE : Encountered Distributional Pressure Hovering Near All-Time High - 6/21/2024 |
View all notes |
Set NEW NOTE alert |
Company Profile |
SEC
News |
Chart |
Request a new note
C
A
S
I |
NVO
-
NYSE
Novo Nordisk ADR
Medical-Ethical Drugs
|
$142.08
|
+2.29
1.64% |
$143.49
|
2,877,099
73.26% of 50 DAV
50 DAV is 3,927,000
|
$148.15
-4.10%
|
6/7/2024
|
$143.06
|
PP = $138.38
|
|
MB = $145.30
|
Most Recent Note - 7/11/2024 5:02:48 PM
Y - Pulled back today with near-average volume. Consolidating above prior highs in the $138 area which define initial support to watch above its 50 DMA line ($137). Fundamentals remain strong.
>>> FEATURED STOCK ARTICLE : Perched Near All-Time High Following Recent Gap Up With Volume - 7/1/2024 |
View all notes |
Set NEW NOTE alert |
Company Profile |
SEC
News |
Chart |
Request a new note
C
A
S
I |
GVA
-
NYSE
Granite Construction
Bldg-Heavy Construction
|
$63.18
|
+0.45
0.72% |
$64.50
|
1,163,373
197.85% of 50 DAV
50 DAV is 588,000
|
$65.08
-2.92%
|
6/11/2024
|
$59.76
|
PP = $64.33
|
|
MB = $67.55
|
Most Recent Note - 7/11/2024 5:01:32 PM
Y - Rebounded above its 50 DMA line ($61.17) with today's 2nd consecutive volume-driven gain helping its outlook improve and its color code is changed to yellow.
>>> FEATURED STOCK ARTICLE : Granite Testing Support at 50-Day Moving Average - 7/2/2024 |
View all notes |
Set NEW NOTE alert |
Company Profile |
SEC
News |
Chart |
Request a new note
C
A
S
I |
DDOG
-
NASDAQ
Datadog Inc
Computer Sftwr-Enterprse
|
$127.80
|
+0.61
0.48% |
$128.85
|
2,863,378
67.93% of 50 DAV
50 DAV is 4,214,900
|
$138.61
-7.80%
|
7/9/2024
|
$126.92
|
PP = $138.71
|
|
MB = $145.65
|
Most Recent Note - 7/12/2024 6:44:48 PM
Y - Pulled back after highlighted in yellow in the 7/09/24 mid-day report with pivot point cited based on its 2/13/24 high plus 10 cents. Consolidating above its 50 DMA line and perched -7.8% off its 52-week high. Reported Mar '24 quarterly earnings +91% on +27% sales revenues versus the year-ago period its 4th consecutive quarterly comparison well above the +25% minimum earnings guideline (C criteria). Its annual earnings (A criteria) history has been strong since completing its $27 IPO on 9/19/19.
>>> FEATURED STOCK ARTICLE : Consolidating Within Close Range of 52-Week High - 7/9/2024 |
View all notes |
Set NEW NOTE alert |
Company Profile |
SEC
News |
Chart |
Request a new note
C
A
S
I |
|
|
|
THESE ARE NOT BUY RECOMMENDATIONS!
Comments contained in the body of this report are technical
opinions only. The material herein has been obtained
from sources believed to be reliable and accurate, however,
its accuracy and completeness cannot be guaranteed.
This site is not an investment advisor, hence it does
not endorse or recommend any securities or other investments.
Any recommendation contained in this report may not
be suitable for all investors and it is not to be deemed
an offer or solicitation on our part with respect to
the purchase or sale of any securities. All trademarks,
service marks and trade names appearing in this report
are the property of their respective owners, and are
likewise used for identification purposes only.
This report is a service available
only to active Paid Premium Members.
You may opt-out of receiving report notifications
at any time. Questions or comments may be submitted
by writing to Premium Membership Services 665 S.E. 10 Street, Suite 201 Deerfield Beach, FL 33441-5634 or by calling 1-800-965-8307
or 954-785-1121.
|
|
|