You are not logged in.
This means you
CAN ONLY VIEW reports that were published prior to Tuesday, March 25, 2025.
You
MUST UPGRADE YOUR MEMBERSHIP if you want to see any current reports.
AFTER MARKET UPDATE - THURSDAY, JULY 11TH, 2024
Previous After Market Report Next After Market Report >>>
|
|
|
|
DOW |
+32.39 |
39,753.75 |
+0.08% |
|
Volume |
977,167,771 |
+21% |
|
Volume |
6,393,781,600 |
+21% |
|
NASDAQ |
-364.04 |
18,283.41 |
-1.95% |
|
Advancers |
2,366 |
85% |
|
Advancers |
3,213 |
75% |
|
S&P 500 |
-49.37 |
5,584.54 |
-0.88% |
|
Decliners |
403 |
15% |
|
Decliners |
1,051 |
25% |
|
Russell 2000 |
+73.28 |
2,125.04 |
+3.57% |
|
52 Wk Highs |
268 |
|
|
52 Wk Highs |
277 |
|
|
S&P 600 |
+42.88 |
1,338.35 |
+3.31% |
|
52 Wk Lows |
9 |
|
|
52 Wk Lows |
67 |
|
|
 |
Breadth Positive and Leadership Improved but Indices Ended Mixed
Kenneth J. Gruneisen - Passed the CAN SLIM® Master's Exam
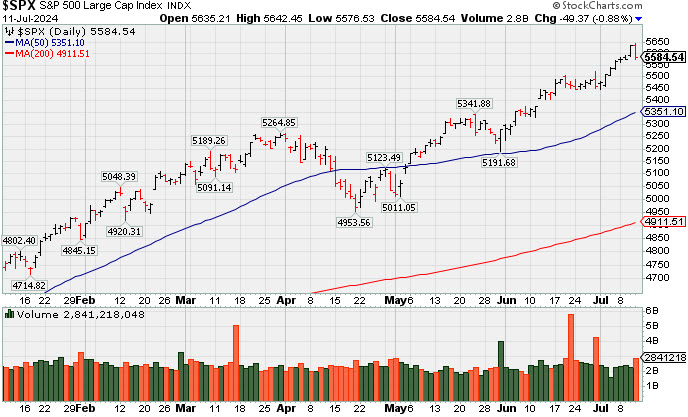
The S&P 500 (-0.9%) and Nasdaq Composite (-2.0%) both lost ground on Thursday breaking 7-session winning streaks into new high territory. The Russell 2000 surged +3.6% and the S&P Mid Cap 400 posted a +2.5% gain. Volume was higher than the prior session totals on the NYSE and on the Nasdaq exchange. Breadth was clearly positive as advancers led decliners by almost a 6-1 margin on the NYSE and by more than a 3-1 margin on the Nasdaq exchange. Leadership improved as there were 102 high-ranked companies from the Leaders List that hit new 52-week highs and were listed on the BreakOuts Page, versus the total of 55 on the prior session. New 52-week highs solidly outnumbered new 52-week lows on the NYSE and on the Nasdaq exchange. The major indices are in a confirmed uptrend (M criteria). Remember that any uptrend requires healthy leadership.
PICTURED: The S&P 500 Index pulled back on Thursday breaking a 7-session winning streak into new all-time high territory.
The CPI report for June revealed that Total CPI deflated -0.1% month-over-month, slowing the pace of growth to +3.0% on a year-over-year basis from +3.3% in May. Core-CPI, which excludes food and energy, decelerated to +3.3% on a year-over-year basis from +3.4%. The 10-yr note yield declined nine basis points to 4.19% and the 2-yr note yield fell 12 basis points to 4.51%.
Rate-sensitive areas of the market benefitted from the drop in rates. The S&P 500 real estate sector was a standout in that respect, jumping +2.7%. Homebuilder stocks also surged in response to the movement in market rates. The SPDR S&P Homebuilder ETF (XHB) logged a +5.9% gain. Mega caps and semiconductor stocks saw losses due to profit taking activity. Tesla (TSLA -8.4%) fell on news that it is delaying its robotaxi plans until October.
|
 Kenneth J. Gruneisen started out as a licensed stockbroker in August 1987, a couple of months prior to the historic stock market crash that took the Dow Jones Industrial Average down -22.6% in a single day. He has published daily fact-based fundamental and technical analysis on high-ranked stocks online for two decades. Through FACTBASEDINVESTING.COM, Kenneth provides educational articles, news, market commentary, and other information regarding proven investment systems that work in good times and bad.
Comments contained in the body of this report are technical opinions only and are not necessarily those of Gruneisen Growth Corp. The material herein has been obtained from sources believed to be reliable and accurate, however, its accuracy and completeness cannot be guaranteed. Our firm, employees, and customers may effect transactions, including transactions contrary to any recommendation herein, or have positions in the securities mentioned herein or options with respect thereto. Any recommendation contained in this report may not be suitable for all investors and it is not to be deemed an offer or solicitation on our part with respect to the purchase or sale of any securities. |
|
 |
Financial, Biotech, Networking, and Commodity-Linked Groups Rose
Kenneth J. Gruneisen - Passed the CAN SLIM® Master's Exam
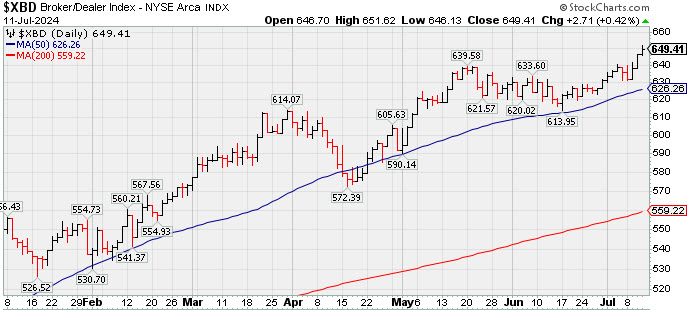
The Bank Index ($BKX +1.63%) and the Broker/Dealer Index ($XBD +0.42%) both posted gains while the Retail Index ($RLX -0.82%) lost ground. The tech sector was mixed as the Semiconductor Index ($SOX -3.47%) slumped while the Biotech Index ($BTK +1.90%) and the Networking Index ($NWX +2.18%) both posted solid gains. Commodity-linked groups had a positive bias as the Gold & Silver Index ($XAU +2.60%), Oil Services Index ($OSX +2.51%), and the Integrated Oil Index ($XOI +1.16%) posted unanimous gains.
PICTURED: The Broker/Dealer Index ($XBD +0.42%) found support above its 50-day moving average (DMA) line and has risen to new 2024 highs with 3 consecutive gains.
| Oil Services |
$OSX |
86.30 |
+2.11 |
+2.51% |
+2.89% |
| Integrated Oil |
$XOI |
2,027.73 |
+23.17 |
+1.16% |
+8.87% |
| Semiconductor |
$SOX |
5,699.66 |
-204.88 |
-3.47% |
+36.50% |
| Networking |
$NWX |
861.89 |
+18.40 |
+2.18% |
+3.49% |
| Broker/Dealer |
$XBD |
649.41 |
+2.71 |
+0.42% |
+16.53% |
| Retail |
$RLX |
4,642.24 |
-38.39 |
-0.82% |
+19.38% |
| Gold & Silver |
$XAU |
153.20 |
+3.88 |
+2.60% |
+21.89% |
| Bank |
$BKX |
109.05 |
+1.75 |
+1.63% |
+13.57% |
| Biotech |
$BTK |
5,487.36 |
+102.54 |
+1.90% |
+1.27% |
|
|
|
 |
Sputtering Below 50-Day Moving Average Line
Kenneth J. Gruneisen - Passed the CAN SLIM® Master's Exam
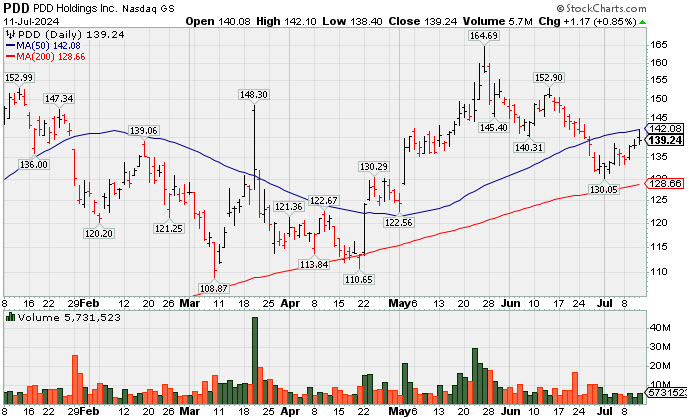
PDD Holdings (PDD +$1.17 or +0.85% to $139.24) posted a 3rd consecutive small gain with below average volume, sputtering below its 50-day moving average (DMA) line which may act as resistance. A rebound above the 50 DMA line ($142) is needed for its outlook to improve. Its 200 DMA line ($128.66) defines important near-term support. PDD was last shown in this FSU section on 6/17/24 under the headline "Still Sputtering Below Pivot Point After Negating Breakout". It has a highest possible Earnings Per Share Rating of 99. Quarterly comparisons through Mar '24 showed encouraging sales revenues and greatly improved earnings versus the year-ago periods with growth rate acceleration. After years of losses, it had a profitable FY '21-23 helping it better match the fundamental annual earnings (A criteria) guidelines of the fact-based investment system.
The number of top-rated funds owning its shares rose from 1,487 in Jun '23 to 1,888 in Jun '24, a reassuring sign concerning the I criteria. Its current Up/Down Volume Ratio of 1.2 is an unbiased indication its shares have been under accumulation over the past 50 days. It has a B Timelinesss Rating and a B Sponsorship Rating.
Symbol/Exchange
Company Name
Industry Group | PRICE | CHANGE
(%Change) | Day High | Volume
(% DAV)
(% 50 day avg vol) | 52 Wk Hi
% From Hi | Featured
Date | Price
Featured | Pivot Featured | | Max Buy |  TDG - NYSE TDG - NYSE
TransDigm Group
Aerospace/Defense | $1,255.64 | -17.04
-1.34% | $1,267.96 | 297,754
122.53% of 50 DAV
50 DAV is 243,000 | $1,369.58
-8.32%
| 4/12/2024 | $1,224.21 | PP = $1,246.32 | | MB = $1,308.64 | Most Recent Note - 7/10/2024 5:10:50 PM
G - Still lingering below its 50 DMA line ($1,304). A rebound above the 50 DMA line is needed to help its outlook improve. Fundamentals remain strong. See the latest FSU analysis for more details and a new annotated graph.
>>> FEATURED STOCK ARTICLE : Lingering Below 50-Day Moving Average But Only -7% Off High - 7/10/2024 | View all notes | Set NEW NOTE alert | Company Profile | SEC News | Chart | Request a new note C A S I | USLM - NASDAQ
U.S. Lime & Minerals
Bldg-Cement/Concrt/Ag | $372.63 | +8.84
2.43% | $377.83 | 50,559
219.82% of 50 DAV
50 DAV is 23,000 | $378.78
-1.62%
| 6/18/2024 | $356.30 | PP = $378.88 | | MB = $397.82 |  Most Recent Note - 7/11/2024 12:29:13 PM Most Recent Note - 7/11/2024 12:29:13 PM
Y - Gapped up today challenging its all-time high. Found support while consolidating above its 50 DMA line ($351). Color code was changed to yellow with new pivot point cited based on its 5/15/24 high plus 10 cents. Subsequent gains above the pivot point backed by at least +40% above average volume may trigger a new (or add-on) technical buy signal.
>>> FEATURED STOCK ARTICLE : in Striking Distance of All-Time High After Volume-Driven Gains - 6/28/2024 | View all notes | Set NEW NOTE alert | Company Profile | SEC News | Chart | Request a new note C A S I | CLS - NYSE
Celestica
Elec-Contract Mfg | $59.48 | -1.99
-3.24% | $61.94 | 1,946,542
90.83% of 50 DAV
50 DAV is 2,143,000 | $62.09
-4.20%
| 7/6/2024 | $57.62 | PP = $61.16 | | MB = $64.22 | Most Recent Note - 7/10/2024 2:22:15 PM
Y - Hitting a new all-time high with today''s 3rd consecutive gain. A gain backed by at least +40% above average volume and a close above the new pivot point cited based on its 5/28/24 high plus 10 cents may trigger a proper technical buy signal. Important support is at prior highs in the $51 area and its 50 DMA line.
>>> FEATURED STOCK ARTICLE : Consolidating Above Prior Highs in an Orderly Fashion - 6/27/2024 | View all notes | Set NEW NOTE alert | Company Profile | SEC News | Chart | Request a new note C A S I | ELF - NYSE
e.l.f. Beauty
Cosmetics/Personal Care | $208.92 | +9.46
4.74% | $210.85 | 1,123,677
72.92% of 50 DAV
50 DAV is 1,541,000 | $221.83
-5.82%
| 6/18/2024 | $212.40 | PP = $221.93 | | MB = $233.03 | Most Recent Note - 7/11/2024 4:59:41 PM
Y - Posted a big gain today with below-average volume. Color code was changed to yellow with new pivot point cited based on its 3/04/24 high plus 10 cents. Subsequent gains above the pivot point backed by at least +40% above average volume may trigger a new (or add-on) technical buy signal. Its 50 DMA line ($185) defines important near-term support to watch.
>>> FEATURED STOCK ARTICLE : Perched Within Striking Distance of All-Time High - 6/20/2024 | View all notes | Set NEW NOTE alert | Company Profile | SEC News | Chart | Request a new note C A S I | PDD - NASDAQ
PDD Holdings ADR
Retail-Internet | $139.24 | +1.17
0.85% | $142.10 | 6,342,340
69.40% of 50 DAV
50 DAV is 9,139,000 | $164.69
-15.45%
| 5/24/2024 | $161.85 | PP = $153.09 | | MB = $160.74 | Most Recent Note - 7/11/2024 4:58:16 PM
G - Posted a 3rd consecutive small gain today with light volume, still lingering below its 50 DMA line ($142). A rebound above the 50 DMA line is needed for its outlook to improve. Its 200 DMA line ($128) defines important near-term support. See the latest FSU analysis for more details and a new annotated graph.
>>> FEATURED STOCK ARTICLE : Sputtering Below 50-Day Moving Average Line - 7/11/2024 | View all notes | Set NEW NOTE alert | Company Profile | SEC News | Chart | Request a new note C A S I | Symbol/Exchange
Company Name
Industry Group | PRICE | CHANGE
(%Change) | Day High | Volume
(% DAV)
(% 50 day avg vol) | 52 Wk Hi
% From Hi | Featured
Date | Price
Featured | Pivot Featured | | Max Buy | CRWD - NASDAQ
CrowdStrike Holdings
Computer Sftwr-Security | $370.43 | -4.02
-1.07% | $379.78 | 3,085,292
60.39% of 50 DAV
50 DAV is 5,109,000 | $398.33
-7.00%
| 5/28/2024 | $351.47 | PP = $365.10 | | MB = $383.36 | Most Recent Note - 7/9/2024 10:42:15 PM
G - Color code is changed to green after it touched a new high today above its "max buy" level but reversed into the red. Prior highs in the $358-365 area define initial support to watch above its 50 DMA line ($350). Fundamentals remain strong.
>>> FEATURED STOCK ARTICLE : Encountered Distributional Pressure Hovering Near All-Time High - 6/21/2024 | View all notes | Set NEW NOTE alert | Company Profile | SEC News | Chart | Request a new note C A S I | NVO - NYSE
Novo Nordisk ADR
Medical-Ethical Drugs | $139.79 | -2.95
-2.07% | $142.53 | 3,821,583
98.19% of 50 DAV
50 DAV is 3,892,000 | $148.15
-5.64%
| 6/7/2024 | $143.06 | PP = $138.38 | | MB = $145.30 | Most Recent Note - 7/11/2024 5:02:48 PM
Y - Pulled back today with near-average volume. Consolidating above prior highs in the $138 area which define initial support to watch above its 50 DMA line ($137). Fundamentals remain strong.
>>> FEATURED STOCK ARTICLE : Perched Near All-Time High Following Recent Gap Up With Volume - 7/1/2024 | View all notes | Set NEW NOTE alert | Company Profile | SEC News | Chart | Request a new note C A S I | GVA - NYSE
Granite Construction
Bldg-Heavy Construction | $62.73 | +2.26
3.74% | $63.16 | 1,671,746
300.13% of 50 DAV
50 DAV is 557,000 | $65.08
-3.61%
| 6/11/2024 | $59.76 | PP = $64.33 | | MB = $67.55 | Most Recent Note - 7/11/2024 5:01:32 PM
Y - Rebounded above its 50 DMA line ($61.17) with today''s 2nd consecutive volume-driven gain helping its outlook improve and its color code is changed to yellow.
>>> FEATURED STOCK ARTICLE : Granite Testing Support at 50-Day Moving Average - 7/2/2024 | View all notes | Set NEW NOTE alert | Company Profile | SEC News | Chart | Request a new note C A S I | DDOG - NASDAQ
Datadog Inc
Computer Sftwr-Enterprse | $127.19 | +0.90
0.71% | $129.71 | 4,209,379
100.59% of 50 DAV
50 DAV is 4,184,500 | $138.61
-8.24%
| 7/9/2024 | $126.92 | PP = $138.71 | | MB = $145.65 | Most Recent Note - 7/9/2024 10:43:37 PM
Y - Suffered a loss today with above average volume, finishing weak after highlighted in yellow in the earlier mid-day report with pivot point cited based on its 2/13/24 high plus 10 cents. Consolidating above its 50 DMA line and perched within striking distance of its 52-week high. Reported Mar ''24 quarterly earnings +91% on +27% sales revenues versus the year-ago period its 4th consecutive quarterly comparison well above the +25% minimum earnings guideline (C criteria). Its annual earnings (A criteria) history has been strong since completing its $27 IPO on 9/19/19. See the latest FSU analysis for more details and a new annotated graph.
>>> FEATURED STOCK ARTICLE : Consolidating Within Close Range of 52-Week High - 7/9/2024 | View all notes | Set NEW NOTE alert | Company Profile | SEC News | Chart | Request a new note C A S I |
|
|
|
Color Codes Explained :
Y - Better candidates highlighted by our
staff of experts.
G - Previously featured
in past reports as yellow but may no longer be buyable under the
guidelines.
***Last / Change / Volume data in this table is the closing quote data***
|
|
|
THESE ARE NOT BUY RECOMMENDATIONS!
Comments contained in the body of this report are technical
opinions only. The material herein has been obtained
from sources believed to be reliable and accurate, however,
its accuracy and completeness cannot be guaranteed.
This site is not an investment advisor, hence it does
not endorse or recommend any securities or other investments.
Any recommendation contained in this report may not
be suitable for all investors and it is not to be deemed
an offer or solicitation on our part with respect to
the purchase or sale of any securities. All trademarks,
service marks and trade names appearing in this report
are the property of their respective owners, and are
likewise used for identification purposes only.
This report is a service available
only to active Paid Premium Members.
You may opt-out of receiving report notifications
at any time. Questions or comments may be submitted
by writing to Premium Membership Services 665 S.E. 10 Street, Suite 201 Deerfield Beach, FL 33441-5634 or by calling 1-800-965-8307
or 954-785-1121.
|
|
|