You are not logged in.
This means you
CAN ONLY VIEW reports that were published prior to Thursday, April 10, 2025.
You
MUST UPGRADE YOUR MEMBERSHIP if you want to see any current reports.
AFTER MARKET UPDATE - WEDNESDAY, MARCH 10TH, 2021
Previous After Market Report Next After Market Report >>>
|
|
|
|
DOW |
+464.28 |
32,297.02 |
+1.46% |
|
Volume |
1,201,901,485 |
+7% |
|
Volume |
5,954,165,500 |
-5% |
|
NASDAQ |
-5.32 |
13,068.50 |
-0.04% |
|
Advancers |
2,357 |
74% |
|
Advancers |
2,498 |
64% |
|
S&P 500 |
+23.37 |
3,898.81 |
+0.60% |
|
Decliners |
823 |
26% |
|
Decliners |
1,401 |
36% |
|
Russell 2000 |
+40.62 |
2,285.68 |
+1.81% |
|
52 Wk Highs |
392 |
|
|
52 Wk Highs |
427 |
|
|
S&P 600 |
+27.00 |
1,366.99 |
+2.01% |
|
52 Wk Lows |
14 |
|
|
52 Wk Lows |
27 |
|
|
 |
Dow Hits New Record as Leadership Improves
Kenneth J. Gruneisen - Passed the CAN SLIM® Master's Exam
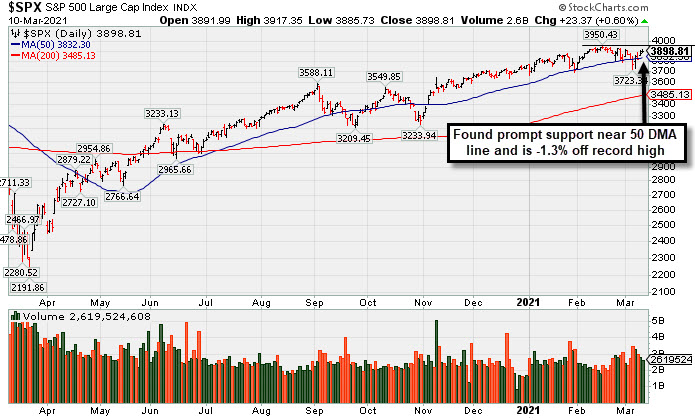
The Dow climbed 464 points to a fresh all-time high, closing above the 32,000 level for the first time. The S&P 500 advanced 0.6%, while the Nasdaq Composite erased early session gains, down less than 0.1% a day after notching its best performance since November. The volume was mixed, higher than the prior session total on the NYSE and lighter on the Nasdaq exchange. Advancers led decliners by almost a 3-1 margin on the NYSE and by a 5-3 margin on the Nasdaq exchange. There were 111 high-ranked companies from the Leaders List that hit new 52-week highs and were listed on the BreakOuts Page, versus the total of 89 on the prior session. New 52-week highs totals expanded and easily outnumbered new 52-week lows totals on the NYSE and on the Nasdaq exchange. The Dow Jones Industrial Average posted a 4th consecutive gain and hit another new record high. Technical strength shown by the Blue Chip index and the Small Cap index ended a brief "correction" and resumed the prior market uptrend (M criteria). Investors are reminded to always make buying and selling decisions on case-by-case basis under the strict criteria and rules of the fact-based investment system.
PICTURED: The S&P 500 Index found support near its 50-day moving average (DMA) line, and after a gain on Wednesday it closed -1.3% off its record high.
U.S. stocks finished higher on Wednesday amid fiscal stimulus progress and tepid inflation data. The U.S. House of Representatives passed the latest $1.9 trillion coronavirus relief package, sending the legislation to President Biden, who is expected to sign the finalized bill by this weekend.
Treasuries strengthened, with the yield on the 10-year note down two basis points to 1.52%. The maturity’s $38 billion auction turned out to be fairly uneventful, easing worries about how the market would digest this week’s flood of issuance. Also alleviating some concerns and supporting government bond prices was muted inflation data, with core consumer prices (excluding volatile food and energy components) increasing less than expected last month. Rounding out the docket, a release revealed the U.S. budget deficit widened to a record $310.9 billion in February. In commodities, WTI crude gained 1.2% $64.77/barrel as economic recovery optimism overshadowed a larger-than-forecasted buildup in weekly U.S. crude stockpiles.
Ten of 11 S&P 500 sectors closed in positive territory, with Technology the sole decliner and more cyclical-oriented shares outperforming. In corporate news, General Electric (GE -5.36%) fell after announcing a reverse stock-split proposal and confirming plans to sell its aircraft leasing segment to Ireland's AerCap (AER -4.66%) in a $30 billion deal. In earnings, Campbell Soup (CPB +2.02%) rose after its profit and revenue matched consensus estimates. |
 Kenneth J. Gruneisen started out as a licensed stockbroker in August 1987, a couple of months prior to the historic stock market crash that took the Dow Jones Industrial Average down -22.6% in a single day. He has published daily fact-based fundamental and technical analysis on high-ranked stocks online for two decades. Through FACTBASEDINVESTING.COM, Kenneth provides educational articles, news, market commentary, and other information regarding proven investment systems that work in good times and bad.
Comments contained in the body of this report are technical opinions only and are not necessarily those of Gruneisen Growth Corp. The material herein has been obtained from sources believed to be reliable and accurate, however, its accuracy and completeness cannot be guaranteed. Our firm, employees, and customers may effect transactions, including transactions contrary to any recommendation herein, or have positions in the securities mentioned herein or options with respect thereto. Any recommendation contained in this report may not be suitable for all investors and it is not to be deemed an offer or solicitation on our part with respect to the purchase or sale of any securities. |
|
 |
Financial and Energy-Linked Indexes Led Gainers
Kenneth J. Gruneisen - Passed the CAN SLIM® Master's Exam
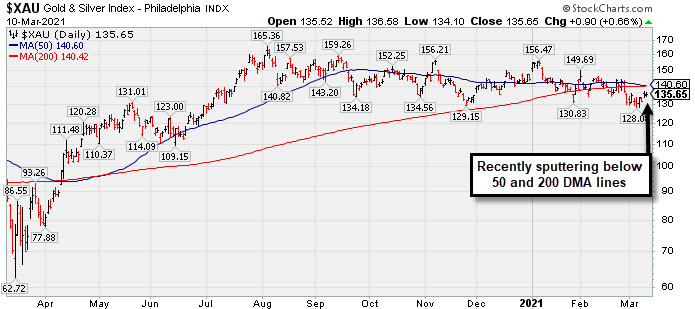
The Broker/Dealer Index ($XBD +1.33%) and Bank Index ($BKX +2.50%) posted influential gains while the Retail Index ($RLX +0.15%) inched higher. The tech sector saw losses for the Semiconductor Index ($SOX -1.80%) and the Biotech Index ($BTK -0.51%) while the Networking Index ($NWX +0.49%) posted a modest gain. The Oil Services Index ($OSX +5.58%) and Integrated Oil Index ($XOI +2.61%) posted standout gains while the Gold & Silver Index ($XAU +0.66%) edged higher.
PICTURED: The Gold & Silver Index ($XAU +0.66%) has recently been sputtering below its 50-day and 200-day moving average (DMA) lines.
| Oil Services |
$OSX |
63.89 |
+3.38 |
+5.58% |
+44.12% |
| Integrated Oil |
$XOI |
1,086.06 |
+27.65 |
+2.61% |
+37.05% |
| Semiconductor |
$SOX |
2,879.32 |
-52.89 |
-1.80% |
+3.00% |
| Networking |
$NWX |
779.04 |
+3.80 |
+0.49% |
+8.63% |
| Broker/Dealer |
$XBD |
449.05 |
+5.88 |
+1.33% |
+18.92% |
| Retail |
$RLX |
3,503.60 |
+5.30 |
+0.15% |
-1.67% |
| Gold & Silver |
$XAU |
135.65 |
+0.90 |
+0.66% |
-5.93% |
| Bank |
$BKX |
121.36 |
+2.96 |
+2.50% |
+23.95% |
| Biotech |
$BTK |
5,425.60 |
-27.98 |
-0.51% |
-5.46% |
|
|
|
 |
Gain Leaves Media - Books Firm Perched Near Pivot Point
Kenneth J. Gruneisen - Passed the CAN SLIM® Master's Exam
Educational Development (EDUC +$1.47 or +8.69% to $18.39) was highlighted in yellow with pivot point cited based on its 10/07/20 high plus 10 cents in the earlier mid-day report (read here). Gapped up today and nearly challenged its all-time high with its 3rd consecutive volume-driven gain. Subsequent gains above the pivot point for a new high (N criteria) backed by at least +40% above average volume are needed to trigger a proper technical buy signal.
EDUC found support at its 200-day moving average (DMA) line ($14.41) since noted with caution in the 10/22/20 mid-day report. It also reported earnings +55% on +63% sales revenues for the Nov '20 quarter versus the year-ago period, marking its 3rd strong quarterly comparison above the +25% minimum guideline (C criteria), helping it better match with the fact-based investment system's fundamental guidelines. This thinly traded Media - Books firm's annual earnings (A criteria) history has strong an dits Earnings Per Share Rating is 98. Share price was impacted by a 2-1 split as of 8/23/18.
The number of top-rated funds owning its shares rose from 34 in Mar '20 to 48 in Dec '20 a reassuring sign concerning the I criteria. It has a small supply of only 6.1 million share in the float (S criteria) which can contribute to greater price volatility in the even of institutional buying or selling. The Media-Books industry group currently has a B (61) Group Relative Strength Rating. |
|
|
Color Codes Explained :
Y - Better candidates highlighted by our
staff of experts.
G - Previously featured
in past reports as yellow but may no longer be buyable under the
guidelines.
***Last / Change / Volume data in this table is the closing quote data***
Symbol/Exchange
Company Name
Industry Group |
PRICE |
CHANGE
(%Change) |
Day High |
Volume
(% DAV)
(% 50 day avg vol) |
52 Wk Hi
% From Hi |
Featured
Date |
Price
Featured |
Pivot Featured |
|
Max Buy |
 FBC
-
NYSE
FBC
-
NYSE
Flagstar Bancorp Inc
BANKING - Savings and Loans
|
$48.50
|
+2.24
4.84% |
$49.01
|
705,670
110.66% of 50 DAV
50 DAV is 637,700
|
$49.15
-1.32%
|
3/4/2021
|
$47.26
|
PP = $48.02
|
|
MB = $50.42
|
 Most Recent Note - 3/10/2021 5:55:16 PM
Y - Challenged its 52-week high as it rose above its pivot point with a big 3rd consecutive gain today with near average volume. At its 50 DMA line ($44.18) it found prompt support. Featured in yellow with pivot point cited based on its 1/26/21 high plus 10 cents in the 3/04/21 mid-day report and repeatedly noted - "Subsequent gains and a strong close above the pivot point backed by at least +40% above average volume are needed to trigger a proper technical buy signal."
>>> FEATURED STOCK ARTICLE : Negative Reversal When Poised For Technical Breakout - 3/4/2021 |
View all notes |
Set NEW NOTE alert |
Company Profile |
SEC
News |
Chart |
Request a new note
C
A
S
I |
CRL
-
NYSE
Charles River Labs Intl
DRUGS - Biotechnology
|
$276.59
|
-1.85
-0.66% |
$284.53
|
230,694
73.00% of 50 DAV
50 DAV is 316,000
|
$303.79
-8.95%
|
12/17/2020
|
$247.06
|
PP = $257.98
|
|
MB = $270.88
|
Most Recent Note - 3/9/2021 5:38:45 PM
G - Consolidating above its 50 DMA line ($272) where it recently found prompt support again. Its Relative Strength Rating is still 75, below the 80+ minimum guideline for buy candidates. Recently reported Dec '20 quarterly earnings +19% on +14% sales revenues versus the year ago period, below the +25% minimum earnings guideline (C criteria), raising concerns.
>>> FEATURED STOCK ARTICLE : CRL Still Hovering Near Record High - 3/1/2021 |
View all notes |
Set NEW NOTE alert |
Company Profile |
SEC
News |
Chart |
Request a new note
C
A
S
I |
OPY
-
NYSE
Oppenheimer Holdings Inc
FINANCIAL SERVICES - Investment Brokerage - Regiona
|
$42.91
|
+1.20
2.88% |
$43.13
|
164,581
132.73% of 50 DAV
50 DAV is 124,000
|
$42.48
1.01%
|
2/25/2021
|
$38.95
|
PP = $38.11
|
|
MB = $40.02
|
Most Recent Note - 3/10/2021 5:59:16 PM
G - Closed strong today as it hit another new all-time high with a 4th consecutive gain backed by above average volume. Disciplined investors avoid chasing stocks extended more than +5% above their pivot point.
>>> FEATURED STOCK ARTICLE : Rose From "3-weeks Tight" Base But Ended Near Session Low - 2/25/2021 |
View all notes |
Set NEW NOTE alert |
Company Profile |
SEC
News |
Chart |
Request a new note
C
A
S
I |
CLFD
-
NASDAQ
Clearfield Inc
TELECOMMUNICATIONS - Cables / Satalite Equipment
|
$31.72
|
+0.27
0.86% |
$32.83
|
95,385
58.88% of 50 DAV
50 DAV is 162,000
|
$38.75
-18.14%
|
1/20/2021
|
$31.38
|
PP = $28.42
|
|
MB = $29.84
|
Most Recent Note - 3/9/2021 5:35:46 PM
G - Posted a big gain with light volume to close back above its 50 DMA line ($31.08), helping its technical stance and outlook improve. Prior highs in the $28 area acted as support. Fundamentals remain strong. See the latest FSU analysis for more details and a new annotated graph.
>>> FEATURED STOCK ARTICLE : Quiet Gain Repaired 50-Day Moving Average Violation - 3/9/2021 |
View all notes |
Set NEW NOTE alert |
Company Profile |
SEC
News |
Chart |
Request a new note
C
A
S
I |
EDUC
-
NASDAQ
Educational Development
WHOLESALE - Basic Materials Wholesale
|
$18.39
|
+1.47
8.69% |
$18.75
|
90,646
251.79% of 50 DAV
50 DAV is 36,000
|
$20.00
-8.05%
|
3/10/2021
|
$17.89
|
PP = $20.10
|
|
MB = $21.11
|
Most Recent Note - 3/10/2021 5:52:10 PM
Y - Finished strong after highlighted in yellow with pivot point cited based on its 10/07/20 high plus 10 cents in the earlier mid-day report. Gapped up today and nearly challenged its all-time high with its 3rd consecutive volume-driven gain. Subsequent gains above the pivot point backed by at least +40% above average volume are needed to trigger a proper technical buy signal. Found support at its 200 DMA line ($14.41) since noted with caution in the 10/22/20 mid-day report. Reported earnings +55% on +63% sales revenues for the Nov '20 quarter versus the year-ago period, its 3rd strong quarterly comparison above the +25% minimum guideline (C criteria), helping it better match with the fact-based investment system's fundamental guidelines. This thinly traded Media - Books firm's annual earnings (A criteria) history has strong. See the latest FSU analysis for more details and an annotated graph.
>>> FEATURED STOCK ARTICLE : Gain Leaves Media - Books Firm Perched Near Pivot Point - 3/10/2021 |
View all notes |
Set NEW NOTE alert |
Company Profile |
SEC
News |
Chart |
Request a new note
C
A
S
I |
Symbol/Exchange
Company Name
Industry Group |
PRICE |
CHANGE
(%Change) |
Day High |
Volume
(% DAV)
(% 50 day avg vol) |
52 Wk Hi
% From Hi |
Featured
Date |
Price
Featured |
Pivot Featured |
|
Max Buy |
SMPL
-
NASDAQ
Simply Good Foods Co
Food-Confectionery
|
$33.75
|
+2.19
6.94% |
$34.59
|
3,102,634
306.28% of 50 DAV
50 DAV is 1,013,000
|
$32.03
5.37%
|
12/28/2020
|
$30.40
|
PP = $31.44
|
|
MB = $33.01
|
Most Recent Note - 3/10/2021 12:40:12 PM
Y - Spiking near and above its "max buy" level to a new 52-week high with heavier volume behind today's 5th consecutive gain triggering a technical buy signal. Its 50 DMA line ($29.28) recently acted as support. Its Relative Strength Rating is 80, right at the minimum guideline for buy candidates. Its prior low ($26.78) defines the next important near term support to watch.
>>> FEATURED STOCK ARTICLE : Found Support at 50-Day Moving Average; Relative Strength Improved - 3/5/2021 |
View all notes |
Set NEW NOTE alert |
Company Profile |
SEC
News |
Chart |
Request a new note
C
A
S
I |
DT
-
NYSE
Dynatrace Inc
Computer Sftwr-Enterprse
|
$51.10
|
+0.25
0.49% |
$52.97
|
1,758,329
68.40% of 50 DAV
50 DAV is 2,570,700
|
$56.77
-9.99%
|
2/4/2021
|
$51.39
|
PP = $48.95
|
|
MB = $51.40
|
Most Recent Note - 3/9/2021 5:40:29 PM
G - Posted a big gain with below average volume today. Found prompt support after testing prior highs in the $48 area and its 50 DMA line ($47.26). More damaging losses would raise serious concerns. Its Relative Strength Rating is 74, still below the 80+ minimum guideline for buy candidates. Fundamentals remain strong after it reported Dec '20 earnings +70% on +28% sales revenues versus the year ago period.
>>> FEATURED STOCK ARTICLE : Consolidating Above Prior Highs and 50-Day Moving Average - 3/3/2021 |
View all notes |
Set NEW NOTE alert |
Company Profile |
SEC
News |
Chart |
Request a new note
C
A
S
I |
MRBK
-
NASDAQ
Meridian Corp
Banks-Northeast
|
$27.39
|
+0.75
2.82% |
$27.90
|
41,706
148.95% of 50 DAV
50 DAV is 28,000
|
$26.95
1.63%
|
2/22/2021
|
$25.58
|
PP = $26.10
|
|
MB = $27.41
|
Most Recent Note - 3/10/2021 5:58:21 PM
Y - Ended near its "max buy" level as it posted a 6th consecutive gain today with +48% above average volume, rising further above the pivot point and hitting a new 52-week high, clinching a technical buy signal. Prior high $26 defines initial support to watch on pullbacks.
>>> FEATURED STOCK ARTICLE : Negative Reversal When Poised to Convincingly Breakout - 2/22/2021 |
View all notes |
Set NEW NOTE alert |
Company Profile |
SEC
News |
Chart |
Request a new note
C
A
S
I |
|
|
|
THESE ARE NOT BUY RECOMMENDATIONS!
Comments contained in the body of this report are technical
opinions only. The material herein has been obtained
from sources believed to be reliable and accurate, however,
its accuracy and completeness cannot be guaranteed.
This site is not an investment advisor, hence it does
not endorse or recommend any securities or other investments.
Any recommendation contained in this report may not
be suitable for all investors and it is not to be deemed
an offer or solicitation on our part with respect to
the purchase or sale of any securities. All trademarks,
service marks and trade names appearing in this report
are the property of their respective owners, and are
likewise used for identification purposes only.
This report is a service available
only to active Paid Premium Members.
You may opt-out of receiving report notifications
at any time. Questions or comments may be submitted
by writing to Premium Membership Services 665 S.E. 10 Street, Suite 201 Deerfield Beach, FL 33441-5634 or by calling 1-800-965-8307
or 954-785-1121.
|
|
|