You are not logged in.
This means you
CAN ONLY VIEW reports that were published prior to Saturday, April 5, 2025.
You
MUST UPGRADE YOUR MEMBERSHIP if you want to see any current reports.
AFTER MARKET UPDATE - TUESDAY, JANUARY 28TH, 2025
Previous After Market Report Next After Market Report >>>
|
|
|
|
DOW |
+136.77 |
44,850.35 |
+0.31% |
|
Volume |
972,158,468 |
-15% |
|
Volume |
7,196,589,900 |
-20% |
|
NASDAQ |
+391.75 |
19,733.59 |
+2.03% |
|
Advancers |
1,215 |
44% |
|
Advancers |
2,158 |
50% |
|
S&P 500 |
+55.42 |
6,067.70 |
+0.92% |
|
Decliners |
1,527 |
56% |
|
Decliners |
2,162 |
50% |
|
Russell 2000 |
+4.84 |
2,288.86 |
+0.21% |
|
52 Wk Highs |
119 |
|
|
52 Wk Highs |
119 |
|
|
S&P 600 |
+0.30 |
1,450.61 |
+0.02% |
|
52 Wk Lows |
23 |
|
|
52 Wk Lows |
159 |
|
|
 |
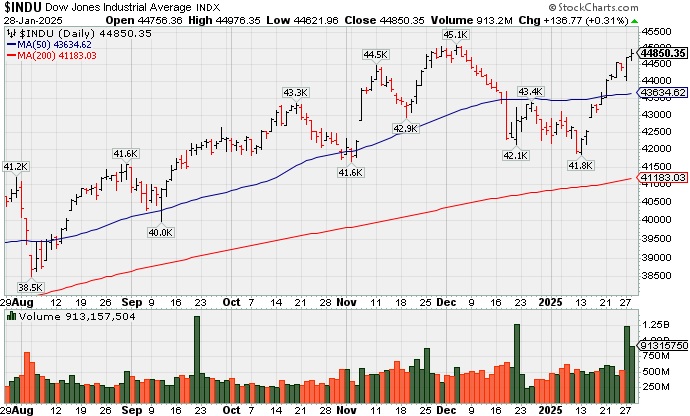
Major Indices Rose with Greater Leadership as NVIDA Rebounded
Kenneth J. Gruneisen - Passed the CAN SLIM® Master's Exam
The S&P 500 closed +0.9% higher and the Nasdaq Composite jumped +2.0%, both closing near their best levels of the day. The Dow Jones Industrial Average (+0.3%) and Russell 2000 (+0.2%) also posted gains. Volume totals reported were lighter than the prior session totals on the NYSE and on the Nasdaq exchange. On the NYSE decliners led advancers by a 5-4 margin while the mix was even at the Nasdaq exchange. There were 53 high-ranked companies from the Leaders List that hit new 52-week highs and were listed on the BreakOuts Page, versus 24 on the prior session. New 52-week highs totals expanded and outnumbered new 52-week lows on the NYSE, however new lows still outnumbered new highs on the Nasdaq exchange. The major indices shook off recent pressure (M criteria) as leadership has improved meaningfully, however healthy leadership remains necessary in order to avoid a more worrisome correction. Disciplined investors know to only buy stocks meeting all key criteria as they emerge from properly formed bases.
PICTURED: The S&P 500 Index abruptly pulled back today testing its 50-day moving average (DMA) line.
The upside action was led by mega caps and chipmakers as NVIDIA (NVDA +8.8%) rebounded. Mixed responses to earnings news were shown by Royal Caribbean (RCL +12.0%), General Motors (GM -8.9%), and Lockheed Martin (LMT -9.2%). Microsoft (MSFT +2.9%) and Meta Platforms (META +2.2%) rose ahead of reporting quarterly results after Wednesday's close. Apple (AAPL +3.7%) also rose, and it reports earnings after Thursday's close.
Eight of the 11 S&P 500 sectors registered losses ranging from -0.2% (financials) to -1.5% (consumer staples).
|
 Kenneth J. Gruneisen started out as a licensed stockbroker in August 1987, a couple of months prior to the historic stock market crash that took the Dow Jones Industrial Average down -22.6% in a single day. He has published daily fact-based fundamental and technical analysis on high-ranked stocks online for two decades. Through FACTBASEDINVESTING.COM, Kenneth provides educational articles, news, market commentary, and other information regarding proven investment systems that work in good times and bad.
Comments contained in the body of this report are technical opinions only and are not necessarily those of Gruneisen Growth Corp. The material herein has been obtained from sources believed to be reliable and accurate, however, its accuracy and completeness cannot be guaranteed. Our firm, employees, and customers may effect transactions, including transactions contrary to any recommendation herein, or have positions in the securities mentioned herein or options with respect thereto. Any recommendation contained in this report may not be suitable for all investors and it is not to be deemed an offer or solicitation on our part with respect to the purchase or sale of any securities. |
|
 |
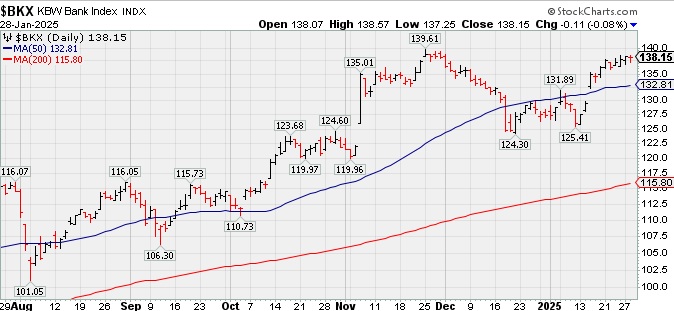
Tech, Retail, and Gold & Silver Indexes Rose
Kenneth J. Gruneisen - Passed the CAN SLIM® Master's Exam
The Retail Index ($RLX +0.47%) and the Broker/Dealer Index ($XBD +1.32%) both posted gains while the Bank Index ($BKX -0.08%) finished flat. The tech sector had a positive bias as the Networking Index ($NWX +1.02%), Semiconductor Index ($SOX +1.11%) and the Biotech Index ($BTK +0.39%) each posted gains. Commodity-linked groups were mixed as the Gold & Silver Index ($XAU +0.79%) rose while the Oil Services Index ($OSX -1.45%) and the Integrated Oil Index ($XOI -1.17%) both ended lower.
PICTURED: The Bank Index ($BKX -0.08%) is perched within close striking distance of its 52-week high after rebounding and making steady progress above its 50-day moving average (DMA) line.
| Oil Services |
$OSX |
73.39 |
-1.08 |
-1.45% |
+1.08% |
| Integrated Oil |
$XOI |
1,865.53 |
-22.14 |
-1.17% |
+5.78% |
| Semiconductor |
$SOX |
4,907.03 |
+53.79 |
+1.11% |
-1.46% |
| Networking |
$NWX |
1,266.20 |
+12.84 |
+1.02% |
+1.41% |
| Broker/Dealer |
$XBD |
893.51 |
+11.64 |
+1.32% |
+10.95% |
| Retail Index |
$RLX |
5,535.64 |
+26.03 |
+0.47% |
+6.98% |
| Gold & Silver |
$XAU |
148.91 |
+1.16 |
+0.79% |
+8.55% |
| Bank |
$BKX |
138.15 |
-0.11 |
-0.08% |
+8.38% |
| Biotech |
$BTK |
6,241.35 |
+23.99 |
+0.39% |
+8.63% |
|
|
|
 |
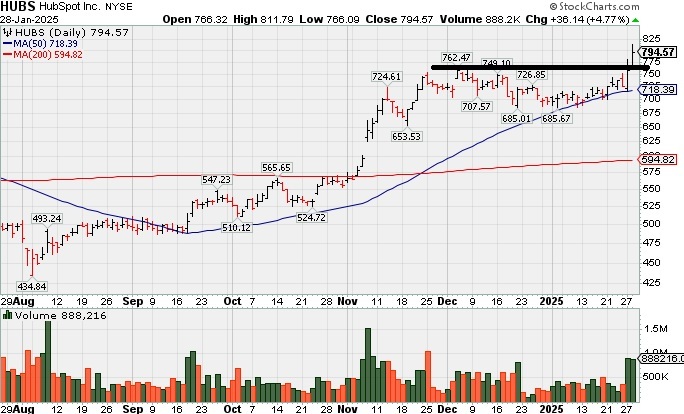
Breakout Backed by Volume Twice the Average Daily
Kenneth J. Gruneisen - Passed the CAN SLIM® Master's Exam
Hubspot Inc (HUBS +$36.14 or +4.77% to $794.57) hit a new 52-week high with today's 2nd consecutive gain backed by +103% above average volume triggering a technical buy signal. Its color code was changed to yellow when highlighted in the 1/27/25 mid-day report (read here) with new pivot point cited based on its 12/04/24 high plus 10 cents, rallying from support near its 50-day moving average (DMA) line ($717). It was noted - "A gain and strong close above the pivot point may clinch a technical buy signal. Fundamentals remain strong. It went through a deep consolidation and rebounded since dropped from the Featured Stocks list when last noted on 5/02/24." HUBS was last shown in this FSU section on 4/25/24 in detail with an annotated graph under the headline, "HUBS Testing 50-day Moving Average Line Again".
HUBS has a highest possible Earnings Per Share Rating of 99. Through the Sep '24 quarter its earnings increases versus the year-ago periods have been strong and steady above the +25% minimum guideline (C criteria). Its annual earnings history (A criteria) has been strong.
The number of top-rated funds owning its shares rose from 1,530 in Jun '23 to 1,890 in Dec '24, a reassuring sign concerning the I criteria. Its current Up/Down Volume Ratio of 1.1 is an unbiased indication its shares have been under accumulation over the past 50 days.
|
|
|
Color Codes Explained :
Y - Better candidates highlighted by our
staff of experts.
G - Previously featured
in past reports as yellow but may no longer be buyable under the
guidelines.
***Last / Change / Volume data in this table is the closing quote data***
Symbol/Exchange
Company Name
Industry Group |
PRICE |
CHANGE
(%Change) |
Day High |
Volume
(% DAV)
(% 50 day avg vol) |
52 Wk Hi
% From Hi |
Featured
Date |
Price
Featured |
Pivot Featured |
|
Max Buy |
 TXRH
-
NASDAQ
TXRH
-
NASDAQ
Texas Roadhouse Inc
LEISURE - Restaurants
|
$180.91
|
-0.28
-0.15% |
$181.90
|
811,033
113.88% of 50 DAV
50 DAV is 712,200
|
$206.04
-12.20%
|
7/26/2024
|
$173.08
|
PP = $175.82
|
|
MB = $184.61
|
Most Recent Note - 1/27/2025 6:43:10 PM
G - Posted again today with +34% above average volume, finding support above its 200 DMA line ($174.70). Lingering below its 50 DMA line ($188) in recent weeks, a rebound above that important short-term average is needed for its outlook to improve.
>>> FEATURED STOCK ARTICLE : Lingering Below 50-Day Moving Average Line - 1/23/2025 |
View all notes |
Set NEW NOTE alert |
Company Profile |
SEC
News |
Chart |
Request a new note
C
A
S
I |
HWM
-
NYSE
Howmet Aerospace
Aerospace/Defense
|
$126.41
|
+4.33
3.55% |
$126.64
|
3,627,287
146.38% of 50 DAV
50 DAV is 2,478,000
|
$129.10
-2.08%
|
1/8/2025
|
$115.05
|
PP = $120.81
|
|
MB = $126.85
|
 Most Recent Note - 1/28/2025 5:15:08 PM
Y - Posted a gain today with above average volume, consolidating near its all-time high. Recent volume-driven gains above the pivot point triggered a new (or add-on) technical buy signal. Near-term support to watch is the prior high ($120.71 on 1/06/25) and its 50 DMA line ($116). Fundamentals remain strong.
>>> FEATURED STOCK ARTICLE : Extended From Prior Base and Perched at High - 12/5/2024 |
View all notes |
Set NEW NOTE alert |
Company Profile |
SEC
News |
Chart |
Request a new note
C
A
S
I |
NGVC
-
NYSE
Natural Grocers
Retail-Super/Mini Mkts
|
$42.04
|
+0.35
0.84% |
$42.70
|
84,366
73.36% of 50 DAV
50 DAV is 115,000
|
$47.57
-11.62%
|
11/5/2024
|
$30.57
|
PP = $30.42
|
|
MB = $31.94
|
Most Recent Note - 1/27/2025 6:54:15 PM
G - Posted a gain today with below average volume, and it has been finding support recently at its 50 DMA line ($40.51). More damaging losses would raise serious concerns and trigger a worrisome technical sell signal. Reported Sep '24 quarterly earnings +50% on +9% sales revenues versus the year-ago period.
>>> FEATURED STOCK ARTICLE : Consolidating After Considerable Rally to New Highs - 12/16/2024 |
View all notes |
Set NEW NOTE alert |
Company Profile |
SEC
News |
Chart |
Request a new note
C
A
S
I |
CLS
-
NYSE
Celestica
Elec-Contract Mfg
|
$94.48
|
+7.12
8.15% |
$95.25
|
8,489,922
333.33% of 50 DAV
50 DAV is 2,547,000
|
$131.23
-28.00%
|
10/11/2024
|
$57.62
|
PP = $63.59
|
|
MB = $66.77
|
Most Recent Note - 1/28/2025 5:13:21 PM
G - Rebounded near its 50 DMA line with today's gain following a damaging loss with heavy volume on the prior session that triggered a technical sell signal. Its 50 DMA line may act as resistance.
>>> FEATURED STOCK ARTICLE : New High After 6th Consecutive Gain - 1/22/2025 |
View all notes |
Set NEW NOTE alert |
Company Profile |
SEC
News |
Chart |
Request a new note
C
A
S
I |
RMD
-
NYSE
ResMed
Medical-Products
|
$249.94
|
-4.76
-1.87% |
$253.40
|
914,026
117.33% of 50 DAV
50 DAV is 779,000
|
$260.49
-4.05%
|
10/25/2024
|
$256.64
|
PP = $255.28
|
|
MB = $268.04
|
Most Recent Note - 1/27/2025 6:49:51 PM
Y - Posted a solid volume-driven gain today nearly challenging its 52-week high. Faces very little near-term resistance due to overhead supply up to the $260 level. Its Relative Strength Rating is 82, above the 80+ minimum guideline for buy candidates.
>>> FEATURED STOCK ARTICLE : Recent Slump Below 50-Day Moving Average Raised Concerns - 11/18/2024 |
View all notes |
Set NEW NOTE alert |
Company Profile |
SEC
News |
Chart |
Request a new note
C
A
S
I |
Symbol/Exchange
Company Name
Industry Group |
PRICE |
CHANGE
(%Change) |
Day High |
Volume
(% DAV)
(% 50 day avg vol) |
52 Wk Hi
% From Hi |
Featured
Date |
Price
Featured |
Pivot Featured |
|
Max Buy |
ATGE
-
NYSE
Adtalem Global Education
Consumer Svcs-Education
|
$98.03
|
+0.83
0.85% |
$99.60
|
323,713
86.55% of 50 DAV
50 DAV is 374,000
|
$100.54
-2.50%
|
12/31/2024
|
$91.50
|
PP = $93.03
|
|
MB = $97.68
|
Most Recent Note - 1/27/2025 6:30:50 PM
G - Pulled back today with near average volume, retreating after wedging to new all-time highs above its "max buy" level. It did not produce gains above its pivot point with heavy enough volume to trigger a proper new (or add-on) technical buy signal. Its 50 DMA line ($91.72) defines initial support to watch. Fundamentals remain strong.
>>> FEATURED STOCK ARTICLE : Hovering Near High With Volume Totals Cooling - 12/4/2024 |
View all notes |
Set NEW NOTE alert |
Company Profile |
SEC
News |
Chart |
Request a new note
C
A
S
I |
ATAT
-
NASDAQ
Atour Lifestyle Hldgs ADR
Leisure-Lodging
|
$27.49
|
+0.40
1.48% |
$27.58
|
660,770
53.16% of 50 DAV
50 DAV is 1,243,000
|
$29.90
-8.06%
|
12/9/2024
|
$29.34
|
PP = $29.25
|
|
MB = $30.71
|
Most Recent Note - 1/28/2025 5:16:43 PM
Y - Posted a small gain today with below average volume. Consolidating after a rebound above its 50 DMA line ($26.52) helped its outlook to improve.
>>> FEATURED STOCK ARTICLE : Volume Above Average Behind Breakout Gain - 12/9/2024 |
View all notes |
Set NEW NOTE alert |
Company Profile |
SEC
News |
Chart |
Request a new note
C
A
S
I |
LRN
-
NYSE
Stride
Consumer Svcs-Education
|
$120.64
|
+1.73
1.45% |
$121.40
|
1,021,518
145.93% of 50 DAV
50 DAV is 700,000
|
$120.86
-0.18%
|
1/10/2025
|
$114.31
|
PP = $112.90
|
|
MB = $118.55
|
Most Recent Note - 1/27/2025 6:53:09 PM
G - Color code is changed to green after it pulled back today with +39% above average volume following a streak of 7 consecutive gains with lackluster volume. It wedged above the pivot point cited based on its 12/04/24 high and hitting new all-time highs. Fundamentals remain strong. Prior high ($112.80 on 12/04/24) defines near-term support above its 50 DMA line ($107.73.
>>> FEATURED STOCK ARTICLE : Encountered Distributional Pressure Amid Broader Weakness - 1/10/2025 |
View all notes |
Set NEW NOTE alert |
Company Profile |
SEC
News |
Chart |
Request a new note
C
A
S
I |
HUBS
-
NYSE
HubSpot
Comp Sftwr-Spec Enterprs
|
$794.57
|
+36.14
4.77% |
$811.79
|
885,888
199.08% of 50 DAV
50 DAV is 445,000
|
$779.73
1.90%
|
1/27/2025
|
$768.96
|
PP = $762.57
|
|
MB = $800.70
|
Most Recent Note - 1/28/2025 5:10:18 PM
Y - Hit a new 52-week high with today's 2nd consecutive gain backed by +103% above average volume triggering a technical buy signal. Color code was changed to yellow when highlighted in the prior mid-day report with new pivot point cited based on its 12/04/24 high plus 10 cents, rallying from support near its 50 DMA line ($717). It was noted - "A gain and strong close above the pivot point may clinch a technical buy signal. Fundamentals remain strong. It went through a deep consolidation and rebounded since dropped from the Featured Stocks list when last noted on 5/02/24." See the latest FSU analysis for more details and a new annotated graph.
>>> FEATURED STOCK ARTICLE : Breakout Backed by Volume Twice the Average Daily - 1/28/2025 |
View all notes |
Set NEW NOTE alert |
Company Profile |
SEC
News |
Chart |
Request a new note
C
A
S
I |
NOW
-
NYSE
ServiceNow
Computer Sftwr-Enterprse
|
$1,170.39
|
+29.77
2.61% |
$1,198.09
|
2,425,885
196.75% of 50 DAV
50 DAV is 1,233,000
|
$1,165.98
0.38%
|
1/27/2025
|
$771.75
|
PP = $1,158.00
|
|
MB = $1,215.90
|
Most Recent Note - 1/28/2025 12:48:51 PM
Y - Hitting yet another new all-time high with today's volume-driven gain adding to a noted spurt higher. Due to report Dec '24 quarterly results on 1/29/25. Keep in mind that volume and volatility often increase near earnings news. Color code was changed to yellow with new pivot point cited based on its 12/04/24 high plus 10 cents after a short flat base. Found prompt support after briefly undercutting its 50 DMA line ($1,079). A gain and strong close above the pivot point backed by at least +40% above average volume may clinch a new (or add-on) technical buy signal. Fundamentals remain strong after it reported Sep '24 quarterly earnings +27% on +22% sales revenues versus the year-ago period. It was dropped from the Featured Stocks list on 4/19/24.
>>> FEATURED STOCK ARTICLE : Hit New High but Ended Session Below the New Pivot Point Cited - 1/27/2025 |
View all notes |
Set NEW NOTE alert |
Company Profile |
SEC
News |
Chart |
Request a new note
C
A
S
I |
Symbol/Exchange
Company Name
Industry Group |
PRICE |
CHANGE
(%Change) |
Day High |
Volume
(% DAV)
(% 50 day avg vol) |
52 Wk Hi
% From Hi |
Featured
Date |
Price
Featured |
Pivot Featured |
|
Max Buy |
|
|
|
THESE ARE NOT BUY RECOMMENDATIONS!
Comments contained in the body of this report are technical
opinions only. The material herein has been obtained
from sources believed to be reliable and accurate, however,
its accuracy and completeness cannot be guaranteed.
This site is not an investment advisor, hence it does
not endorse or recommend any securities or other investments.
Any recommendation contained in this report may not
be suitable for all investors and it is not to be deemed
an offer or solicitation on our part with respect to
the purchase or sale of any securities. All trademarks,
service marks and trade names appearing in this report
are the property of their respective owners, and are
likewise used for identification purposes only.
This report is a service available
only to active Paid Premium Members.
You may opt-out of receiving report notifications
at any time. Questions or comments may be submitted
by writing to Premium Membership Services 665 S.E. 10 Street, Suite 201 Deerfield Beach, FL 33441-5634 or by calling 1-800-965-8307
or 954-785-1121.
|
|
|