You are not logged in.
This means you
CAN ONLY VIEW reports that were published prior to Tuesday, April 8, 2025.
You
MUST UPGRADE YOUR MEMBERSHIP if you want to see any current reports.
AFTER MARKET UPDATE - WEDNESDAY, JANUARY 22ND, 2025
Previous After Market Report Next After Market Report >>>
|
|
|
|
DOW |
+130.92 |
44,156.73 |
+0.30% |
|
Volume |
964,787,514 |
-10% |
|
Volume |
7,242,227,800 |
-11% |
|
NASDAQ |
+252.56 |
20,009.34 |
+1.28% |
|
Advancers |
900 |
33% |
|
Advancers |
1,769 |
40% |
|
S&P 500 |
+37.06 |
6,086.30 |
+0.61% |
|
Decliners |
1,812 |
67% |
|
Decliners |
2,600 |
59% |
|
Russell 2000 |
-14.24 |
2,303.73 |
-0.61% |
|
52 Wk Highs |
136 |
|
|
52 Wk Highs |
183 |
|
|
S&P 600 |
-12.22 |
1,452.88 |
-0.83% |
|
52 Wk Lows |
24 |
|
|
52 Wk Lows |
98 |
|
|
 |
Major Indices Rose as Small Caps Edged Lower
Kenneth J. Gruneisen - Passed the CAN SLIM® Master's Exam
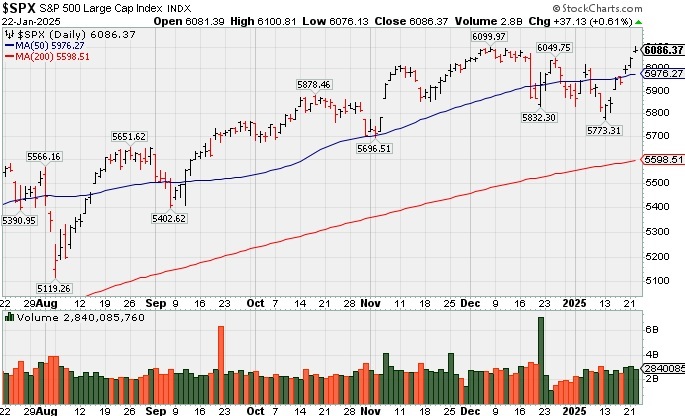
The S&P 500 (+0.6%) reached a fresh all-time high of 6,100.81 while the Nasdaq Composite rose +1.28% and the Dow Jones Industrial Average rose +0.3%. The Russell 2000 (-0.6%) and S&P Mid Cap 400 (-0.4%) closed lower. Volume totals reported were lighter than the prior session totals on the NYSE and on the Nasdaq exchange, action indicative of less aggressive institutional buying demand. Breadth was actually negative as decliners led advancers by a 2-1 margin at the NYSE and by almost 5-3 on the Nasdaq exchange. Leadership remained strong as there were 78 high-ranked companies from the Leaders List that hit new 52-week highs and were listed on the BreakOuts Page, versus 83 on the prior session. New 52-week highs totals outnumbered new 52-week lows on the NYSE and on the Nasdaq exchange. The major indices have shaken off recent pressure (M criteria) as leadership has improved meaningfully, avoiding a more worrisome correction. Disciplined investors know to only buy stocks meeting all key criteria as they emerge from properly formed bases.
PICTURED: The S&P 500 Index posted a 3rd consecutive gain above its 50-day moving average (DMA) line and touched a new all-time high.
Enthusiasm around AI initiatives followed President Trump’s $500 billion AI infrastructure announcement. Oracle (ORCL +6.75%) posted a solid gain. Netflix (NFLX +9.69%) was also a standout performer after delivering the largest quarter of global streaming paid net ads in its history. Blue-chip names, including Procter & Gamble (PG +1.87%) and Dow component Travelers (TRV +3.16%), were also among the standouts, reporting strong earnings that bolstered investor confidence.
A fresh $13 billion 20-yr bond reopening, which met stellar demand. The 10-yr yield settled three basis points higher at 4.60% and the 2-yr yield settled two basis points higher at 4.30%.
|
 Kenneth J. Gruneisen started out as a licensed stockbroker in August 1987, a couple of months prior to the historic stock market crash that took the Dow Jones Industrial Average down -22.6% in a single day. He has published daily fact-based fundamental and technical analysis on high-ranked stocks online for two decades. Through FACTBASEDINVESTING.COM, Kenneth provides educational articles, news, market commentary, and other information regarding proven investment systems that work in good times and bad.
Comments contained in the body of this report are technical opinions only and are not necessarily those of Gruneisen Growth Corp. The material herein has been obtained from sources believed to be reliable and accurate, however, its accuracy and completeness cannot be guaranteed. Our firm, employees, and customers may effect transactions, including transactions contrary to any recommendation herein, or have positions in the securities mentioned herein or options with respect thereto. Any recommendation contained in this report may not be suitable for all investors and it is not to be deemed an offer or solicitation on our part with respect to the purchase or sale of any securities. |
|
 |
Bank, Retail Semiconductor, and Networking Indexes Rose
Kenneth J. Gruneisen - Passed the CAN SLIM® Master's Exam
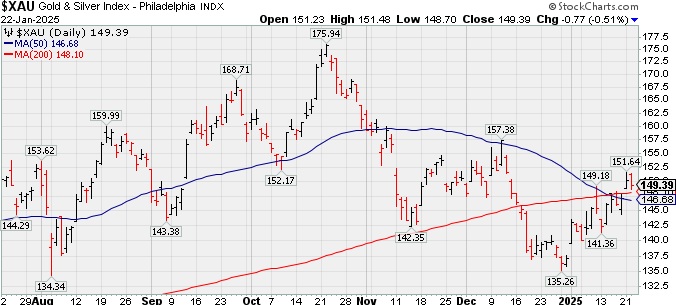
The Retail Index ($RLX +0.86%) and the Broker/Dealer Index ($XBD +0.86%) both posted solid gains while the Bank Index ($BKX -0.90%) fell. The tech sector had a positive bias as the Networking Index ($NWX +0.87%) and the Semiconductor Index ($SOX +1.69%) rose while the Biotech Index ($BTK -0.47%) suffered a modest loss. Commodity-linked groups had a negative bias as the Oil Services Index ($OSX -2.83%) and the Integrated Oil Index ($XOI -1.39%) both outpaced the Gold & Silver Index ($XAU -0.51%) to the downside.
PICTURED: The Gold & Silver Index ($XAU -0.51%) pulled back for a small loss. Recent gains helped it rebound above its 50-day and 200-day moving average (DMA) lines.
| Oil Services |
$OSX |
76.23 |
-2.22 |
-2.83% |
+5.00% |
| Integrated Oil |
$XOI |
1,883.35 |
-26.59 |
-1.39% |
+6.79% |
| Semiconductor |
$SOX |
5,469.29 |
+90.80 |
+1.69% |
+9.83% |
| Networking |
$NWX |
1,360.91 |
+11.75 |
+0.87% |
+9.00% |
| Broker/Dealer |
$XBD |
882.02 |
+7.53 |
+0.86% |
+9.52% |
| Retail Index |
$RLX |
5,455.36 |
+46.50 |
+0.86% |
+5.43% |
| Gold & Silver |
$XAU |
149.38 |
-0.78 |
-0.52% |
+8.90% |
| Bank |
$BKX |
136.31 |
-1.24 |
-0.90% |
+6.93% |
| Biotech |
$BTK |
6,142.86 |
-28.98 |
-0.47% |
+6.91% |
|
|
|
 |
New High After 6th Consecutive Gain
Kenneth J. Gruneisen - Passed the CAN SLIM® Master's Exam
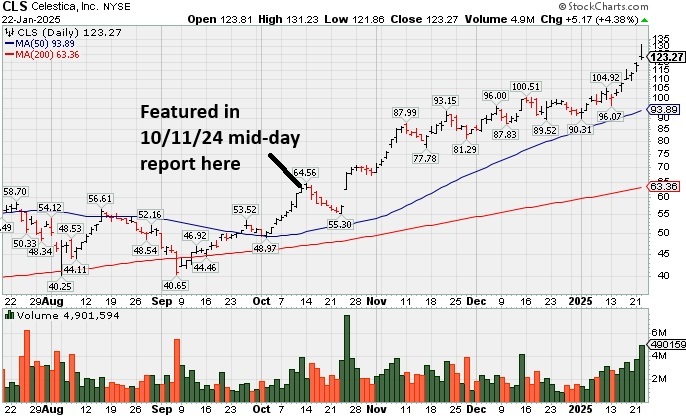
Celestica (CLS +$5.17 or +4.38% to $123.27) is very extended from any sound base. It hit yet another new all-time high with today's 6th consecutive gain, but it ended in the lower third of its intra-day range. Its 50 DMA line ($94) defines initial support to watch on pullbacks. It is due to report Dec '24 quarterly results on 1/29/25. Volume and volatility often increase near earnings news.
CLS was highlighted in yellow in the 10/11/24 mid-day report (read here) with new pivot point cited based on its 7/16/24 high plus 10 cents. It was last shown in detail in this FSU section on 11/13/24 with an annotated graph under the headline, "Pulling Back After Considerable Rally". It hails from the high ranked Elec-Contract Mfg group which is now ranked 25th on the 197 Industry Groups List (L criteria).
CLS has a highest possible 99 Earnings Per Share Rating. It reported earnings +60% on +22% sales revenues for the Sep '24 quarter versus the year ago period, and 9 of the last 10 quarterly comparisons were at or above the +25% minimum earnings guideline (C criteria). Annual earnings (A criteria) history has been strong since bottoming in FY '19.
There are only 116.4 million shares outstanding (S criteria) which can contribute to greater price volatility in the event of institutional buying or selling. The number of top-rated funds owning its shares rose from 322 in Jun '23 to 678 in Dec '24, a reassuring sign concerning the I criteria. Its current Up/Down Volume Ratio of 1.8 is an unbiased indication its shares have been under accumulation over the past 50 days.
Symbol/Exchange
Company Name
Industry Group | PRICE | CHANGE
(%Change) | Day High | Volume
(% DAV)
(% 50 day avg vol) | 52 Wk Hi
% From Hi | Featured
Date | Price
Featured | Pivot Featured | | Max Buy |  GVA - NYSE GVA - NYSE
Granite Construction
Bldg-Heavy Construction | $94.08 | -0.73
-0.77% | $96.93 | 319,452
58.08% of 50 DAV
50 DAV is 550,000 | $105.20
-10.57%
| 6/11/2024 | $59.76 | PP = $64.33 | | MB = $67.55 | Most Recent Note - 1/21/2025 3:48:20 PM
G - Posting a 6th consecutive gain today rising above its 50 DMA line ($94) helping its outlook to improve. Slumped after a noted "negative reversal" at its all-time high. Reported Sep ''24 quarterly earnings +19% on +14% sales revenues versus the year-ago period, repeatedly noted as "below the +25% minimum guideline (C criteria) of the fact-based investment system."
>>> FEATURED STOCK ARTICLE : Negative Reversal After Hitting New All-Time High - 12/6/2024 | View all notes | Set NEW NOTE alert | Company Profile | SEC News | Chart | Request a new note C A S I | TXRH - NASDAQ
Texas Roadhouse Inc
LEISURE - Restaurants | $180.04 | -2.00
-1.10% | $182.62 | 679,572
96.08% of 50 DAV
50 DAV is 707,300 | $206.04
-12.62%
| 7/26/2024 | $173.08 | PP = $175.82 | | MB = $184.61 | Most Recent Note - 1/17/2025 10:14:07 AM
G - Recently finding support at its 200 DMA line ($173) but lingering below its 50 DMA line ($190) in recent weeks. A rebound above the 50 DMA line is still needed for its outlook to improve.
>>> FEATURED STOCK ARTICLE : Hovering Near High After Recent Volume-driven Gains - 11/15/2024 | View all notes | Set NEW NOTE alert | Company Profile | SEC News | Chart | Request a new note C A S I | HWM - NYSE
Howmet Aerospace
Aerospace/Defense | $126.71 | -0.45
-0.35% | $128.33 | 2,598,267
104.26% of 50 DAV
50 DAV is 2,492,000 | $129.10
-1.85%
| 1/8/2025 | $115.05 | PP = $120.81 | | MB = $126.85 |  Most Recent Note - 1/22/2025 5:07:13 PM Most Recent Note - 1/22/2025 5:07:13 PM
Y - Paused today near its "max buy" level after 6 consecutive gains for new all-time highs. Recent volume-driven gains above the pivot point triggered a new (or add-on) technical buy signal. Found support recently above the prior high ($106.93 on 10/21/24). Fundamentals remain strong.
>>> FEATURED STOCK ARTICLE : Extended From Prior Base and Perched at High - 12/5/2024 | View all notes | Set NEW NOTE alert | Company Profile | SEC News | Chart | Request a new note C A S I | NGVC - NYSE
Natural Grocers
Retail-Super/Mini Mkts | $40.65 | -0.40
-0.97% | $41.72 | 88,331
75.50% of 50 DAV
50 DAV is 117,000 | $47.57
-14.55%
| 11/5/2024 | $30.57 | PP = $30.42 | | MB = $31.94 | Most Recent Note - 1/21/2025 3:49:43 PM
G - Gapped up today but retreated from its early high. Found support at its 50 DMA line ($40). More damaging losses would raise serious concerns and trigger a worrisome technical sell signal. Reported Sep ''24 quarterly earnings +50% on +9% sales revenues versus the year-ago period.
>>> FEATURED STOCK ARTICLE : Consolidating After Considerable Rally to New Highs - 12/16/2024 | View all notes | Set NEW NOTE alert | Company Profile | SEC News | Chart | Request a new note C A S I | CLS - NYSE
Celestica
Elec-Contract Mfg | $123.27 | +5.17
4.38% | $131.23 | 4,837,470
215.57% of 50 DAV
50 DAV is 2,244,000 | $119.77
2.92%
| 10/11/2024 | $57.62 | PP = $63.59 | | MB = $66.77 | Most Recent Note - 1/22/2025 1:10:38 PM
G - Extended from any sound base and hitting yet another new all-time high with today's 6th consecutive gain. Its 50 DMA line ($94) defines initial support to watch on pullbacks.
>>> FEATURED STOCK ARTICLE : New High After 6th Consecutive Gain - 1/22/2025 | View all notes | Set NEW NOTE alert | Company Profile | SEC News | Chart | Request a new note C A S I | Symbol/Exchange
Company Name
Industry Group | PRICE | CHANGE
(%Change) | Day High | Volume
(% DAV)
(% 50 day avg vol) | 52 Wk Hi
% From Hi | Featured
Date | Price
Featured | Pivot Featured | | Max Buy | PAY - NYSE
Paymentus Holdings
Finance-CrdtCard/PmtPr | $31.24 | -0.01
-0.03% | $31.73 | 266,981
49.72% of 50 DAV
50 DAV is 537,000 | $38.94
-19.77%
| 1/3/2025 | $34.21 | PP = $38.94 | | MB = $40.89 | Most Recent Note - 1/21/2025 3:43:48 PM
G - Rebounding toward its 50 DMA line with today''s big gain after noted losses backed by above average volume. A rebound above the 50 DMA line ($33.37) is needed for its outlook to improve.
>>> FEATURED STOCK ARTICLE : Losses Below 50-Day Moving Average Hurt Outlook - 1/8/2025 | View all notes | Set NEW NOTE alert | Company Profile | SEC News | Chart | Request a new note C A S I | RMD - NYSE
ResMed
Medical-Products | $247.33 | -0.46
-0.19% | $248.87 | 713,285
91.45% of 50 DAV
50 DAV is 780,000 | $260.49
-5.05%
| 10/25/2024 | $256.64 | PP = $255.28 | | MB = $268.04 | Most Recent Note - 1/21/2025 3:45:22 PM
Y - Gapped up today rebounding above its 50 DMA line ($239.49) helping its outlook to improve and its color code is changed to yellow. Its Relative Strength Rating is 83, at the 80+ minimum guideline for buy candidates. Faces near-term resistance due to overhead supply up to the $260 level.
>>> FEATURED STOCK ARTICLE : Recent Slump Below 50-Day Moving Average Raised Concerns - 11/18/2024 | View all notes | Set NEW NOTE alert | Company Profile | SEC News | Chart | Request a new note C A S I | ATGE - NYSE
Adtalem Global Education
Consumer Svcs-Education | $99.61 | +0.51
0.51% | $100.20 | 241,850
61.07% of 50 DAV
50 DAV is 396,000 | $100.05
-0.44%
| 12/31/2024 | $91.50 | PP = $93.03 | | MB = $97.68 | Most Recent Note - 1/17/2025 10:06:48 AM
G - After a noted "positive reversal" today''s 4th consecutive gain has it wedging to new all-time highs above its "max buy" level and its color code is changed to green. New pivot point was cited based on its 11/06/24 high plus 10 cents. It did not produce gains above its pivot point with heavy enough volume to trigger a proper new (or add-on) technical buy signal. Its 50 DMA line ($90.34) defines initial support above the prior low ($84.79 on 12/18/24). Fundamentals remain strong.
>>> FEATURED STOCK ARTICLE : Hovering Near High With Volume Totals Cooling - 12/4/2024 | View all notes | Set NEW NOTE alert | Company Profile | SEC News | Chart | Request a new note C A S I | TW - NASDAQ
Tradeweb Markets Cl A
Financial Svcs-Specialty | $128.57 | +0.66
0.52% | $129.06 | 1,133,893
131.76% of 50 DAV
50 DAV is 860,600 | $141.69
-9.26%
| 11/19/2024 | $134.41 | PP = $136.23 | | MB = $143.04 | Most Recent Note - 1/22/2025 5:11:56 PM
G - Its Relative Strength Rating has slumped to 77, below the 80+ minimum guideline for buy candidates while lingering below its 50 DMA line. Prior lows in the $125 area define the next very important support level to watch. More damaging losses would raise serious concerns. A rebound above the 50 DMA line ($132) is needed for its outlook to improve and it must produce a volume-driven gain above the pivot point to trigger a proper technical buy signal. It was highlighted in yellow with pivot point cited based on its 10/15/24 high plus 10 cents.
>>> FEATURED STOCK ARTICLE : Tradeweb Markets Perched Near High - 11/19/2024 | View all notes | Set NEW NOTE alert | Company Profile | SEC News | Chart | Request a new note C A S I | ATAT - NASDAQ
Atour Lifestyle Hldgs ADR
Leisure-Lodging | $26.22 | -0.22
-0.83% | $26.65 | 471,578
37.46% of 50 DAV
50 DAV is 1,259,000 | $29.90
-12.31%
| 12/9/2024 | $29.34 | PP = $29.25 | | MB = $30.71 | Most Recent Note - 1/17/2025 10:02:56 AM
G - Still lingering below its 50 DMA line ($26.53) which may act as resistance. A rebound above the 50 DMA line is needed for its outlook to improve.
>>> FEATURED STOCK ARTICLE : Volume Above Average Behind Breakout Gain - 12/9/2024 | View all notes | Set NEW NOTE alert | Company Profile | SEC News | Chart | Request a new note C A S I | Symbol/Exchange
Company Name
Industry Group | PRICE | CHANGE
(%Change) | Day High | Volume
(% DAV)
(% 50 day avg vol) | 52 Wk Hi
% From Hi | Featured
Date | Price
Featured | Pivot Featured | | Max Buy | CRAI - NASDAQ
CRA International
Comml Svcs-Consulting | $184.08 | -1.87
-1.01% | $188.05 | 45,774
134.63% of 50 DAV
50 DAV is 34,000 | $210.70
-12.63%
| 12/17/2024 | $208.34 | PP = $208.48 | | MB = $218.90 | Most Recent Note - 1/21/2025 3:46:41 PM
G - Today''s gain with light volume has it rebounding toward its 50 DMA line which may act as resistance. A rebound above the 50 DMA line ($190) is needed for its outlook to improve. Its 200 DMA line ($174) defines important near-term support. Fundamentals remain strong.
>>> FEATURED STOCK ARTICLE : Volume-Driven Gain for New High Triggered Technical Buy Signal - 12/17/2024 | View all notes | Set NEW NOTE alert | Company Profile | SEC News | Chart | Request a new note C A S I | LRN - NYSE
Stride
Consumer Svcs-Education | $117.49 | +0.95
0.82% | $118.58 | 727,992
103.12% of 50 DAV
50 DAV is 706,000 | $117.64
-0.13%
| 1/10/2025 | $114.31 | PP = $112.90 | | MB = $118.55 | Most Recent Note - 1/22/2025 5:09:46 PM
Y - Posted a 5th consecutive gain today with lackluster volume, wedging above the pivot point cited based on its 12/04/24 high and hitting new all-time highs. Fundamentals remain strong. Recently consolidated in an orderly fashion above its 50 DMA line ($106.66). The 1/10/25 mid-day report noted - "A gain and strong close above the pivot point backed by at least +40% above average volume may clinch a technical buy signal."
>>> FEATURED STOCK ARTICLE : Encountered Distributional Pressure Amid Broader Weakness - 1/10/2025 | View all notes | Set NEW NOTE alert | Company Profile | SEC News | Chart | Request a new note C A S I |
|
|
|
Color Codes Explained :
Y - Better candidates highlighted by our
staff of experts.
G - Previously featured
in past reports as yellow but may no longer be buyable under the
guidelines.
***Last / Change / Volume data in this table is the closing quote data***
Symbol/Exchange
Company Name
Industry Group |
PRICE |
CHANGE
(%Change) |
Day High |
Volume
(% DAV)
(% 50 day avg vol) |
52 Wk Hi
% From Hi |
Featured
Date |
Price
Featured |
Pivot Featured |
|
Max Buy |
 GVA
-
NYSE
GVA
-
NYSE
Granite Construction
Bldg-Heavy Construction
|
$94.81
|
+2.44
2.64% |
$95.53
|
387,979
69.66% of 50 DAV
50 DAV is 557,000
|
$105.20
-9.88%
|
6/11/2024
|
$59.76
|
PP = $64.33
|
|
MB = $67.55
|
 Most Recent Note - 1/21/2025 3:48:20 PM
G - Posting a 6th consecutive gain today rising above its 50 DMA line ($94) helping its outlook to improve. Slumped after a noted "negative reversal" at its all-time high. Reported Sep '24 quarterly earnings +19% on +14% sales revenues versus the year-ago period, repeatedly noted as "below the +25% minimum guideline (C criteria) of the fact-based investment system."
>>> FEATURED STOCK ARTICLE : Negative Reversal After Hitting New All-Time High - 12/6/2024 |
View all notes |
Set NEW NOTE alert |
Company Profile |
SEC
News |
Chart |
Request a new note
C
A
S
I |
TXRH
-
NASDAQ
Texas Roadhouse Inc
LEISURE - Restaurants
|
$182.04
|
+3.09
1.73% |
$183.59
|
1,385,611
200.23% of 50 DAV
50 DAV is 692,000
|
$206.04
-11.65%
|
7/26/2024
|
$173.08
|
PP = $175.82
|
|
MB = $184.61
|
Most Recent Note - 1/17/2025 10:14:07 AM
G - Recently finding support at its 200 DMA line ($173) but lingering below its 50 DMA line ($190) in recent weeks. A rebound above the 50 DMA line is still needed for its outlook to improve.
>>> FEATURED STOCK ARTICLE : Hovering Near High After Recent Volume-driven Gains - 11/15/2024 |
View all notes |
Set NEW NOTE alert |
Company Profile |
SEC
News |
Chart |
Request a new note
C
A
S
I |
HWM
-
NYSE
Howmet Aerospace
Aerospace/Defense
|
$127.16
|
+1.86
1.48% |
$129.10
|
3,338,039
134.82% of 50 DAV
50 DAV is 2,476,000
|
$126.26
0.71%
|
1/8/2025
|
$115.05
|
PP = $120.81
|
|
MB = $126.85
|
Most Recent Note - 1/15/2025 12:28:57 PM
Y - Gapped up today for a 2nd consecutive session, hitting a new all-time high. Noted twice since new pivot point noted on 1/08/25 - "Subsequent volume-driven gains above the pivot point may trigger a new (or add-on) technical buy signal. Found support recently above the prior high ($106.93 on 10/21/24). Fundamentals remain strong."
>>> FEATURED STOCK ARTICLE : Extended From Prior Base and Perched at High - 12/5/2024 |
View all notes |
Set NEW NOTE alert |
Company Profile |
SEC
News |
Chart |
Request a new note
C
A
S
I |
NGVC
-
NYSE
Natural Grocers
Retail-Super/Mini Mkts
|
$41.05
|
+0.72
1.79% |
$42.79
|
120,507
102.12% of 50 DAV
50 DAV is 118,000
|
$47.57
-13.71%
|
11/5/2024
|
$30.57
|
PP = $30.42
|
|
MB = $31.94
|
Most Recent Note - 1/21/2025 3:49:43 PM
G - Gapped up today but retreated from its early high. Found support at its 50 DMA line ($40). More damaging losses would raise serious concerns and trigger a worrisome technical sell signal. Reported Sep '24 quarterly earnings +50% on +9% sales revenues versus the year-ago period.
>>> FEATURED STOCK ARTICLE : Consolidating After Considerable Rally to New Highs - 12/16/2024 |
View all notes |
Set NEW NOTE alert |
Company Profile |
SEC
News |
Chart |
Request a new note
C
A
S
I |
CLS
-
NYSE
Celestica
Elec-Contract Mfg
|
$118.10
|
+4.82
4.25% |
$119.77
|
3,673,480
164.88% of 50 DAV
50 DAV is 2,228,000
|
$115.52
2.23%
|
10/11/2024
|
$57.62
|
PP = $63.59
|
|
MB = $66.77
|
Most Recent Note - 1/21/2025 12:35:17 PM
G - Extended from any sound base and hitting another new all-time high with today's 5th consecutive gain. Its 50 DMA line ($93.04) defines initial support to watch on pullbacks.
>>> FEATURED STOCK ARTICLE : Pulling Back After Considerable Rally - 11/13/2024 |
View all notes |
Set NEW NOTE alert |
Company Profile |
SEC
News |
Chart |
Request a new note
C
A
S
I |
Symbol/Exchange
Company Name
Industry Group |
PRICE |
CHANGE
(%Change) |
Day High |
Volume
(% DAV)
(% 50 day avg vol) |
52 Wk Hi
% From Hi |
Featured
Date |
Price
Featured |
Pivot Featured |
|
Max Buy |
PAY
-
NYSE
Paymentus Holdings
Finance-CrdtCard/PmtPr
|
$31.25
|
+1.11
3.68% |
$31.52
|
343,402
64.43% of 50 DAV
50 DAV is 533,000
|
$38.94
-19.75%
|
1/3/2025
|
$34.21
|
PP = $38.94
|
|
MB = $40.89
|
Most Recent Note - 1/21/2025 3:43:48 PM
G - Rebounding toward its 50 DMA line with today's big gain after noted losses backed by above average volume. A rebound above the 50 DMA line ($33.37) is needed for its outlook to improve.
>>> FEATURED STOCK ARTICLE : Losses Below 50-Day Moving Average Hurt Outlook - 1/8/2025 |
View all notes |
Set NEW NOTE alert |
Company Profile |
SEC
News |
Chart |
Request a new note
C
A
S
I |
RMD
-
NYSE
ResMed
Medical-Products
|
$247.79
|
+8.01
3.34% |
$249.31
|
1,047,362
134.28% of 50 DAV
50 DAV is 780,000
|
$260.49
-4.88%
|
10/25/2024
|
$256.64
|
PP = $255.28
|
|
MB = $268.04
|
Most Recent Note - 1/21/2025 3:45:22 PM
Y - Gapped up today rebounding above its 50 DMA line ($239.49) helping its outlook to improve and its color code is changed to yellow. Its Relative Strength Rating is 83, at the 80+ minimum guideline for buy candidates. Faces near-term resistance due to overhead supply up to the $260 level.
>>> FEATURED STOCK ARTICLE : Recent Slump Below 50-Day Moving Average Raised Concerns - 11/18/2024 |
View all notes |
Set NEW NOTE alert |
Company Profile |
SEC
News |
Chart |
Request a new note
C
A
S
I |
ATGE
-
NYSE
Adtalem Global Education
Consumer Svcs-Education
|
$99.10
|
+0.93
0.95% |
$100.05
|
384,919
97.70% of 50 DAV
50 DAV is 394,000
|
$99.17
-0.07%
|
12/31/2024
|
$91.50
|
PP = $93.03
|
|
MB = $97.68
|
Most Recent Note - 1/17/2025 10:06:48 AM
G - After a noted "positive reversal" today's 4th consecutive gain has it wedging to new all-time highs above its "max buy" level and its color code is changed to green. New pivot point was cited based on its 11/06/24 high plus 10 cents. It did not produce gains above its pivot point with heavy enough volume to trigger a proper new (or add-on) technical buy signal. Its 50 DMA line ($90.34) defines initial support above the prior low ($84.79 on 12/18/24). Fundamentals remain strong.
>>> FEATURED STOCK ARTICLE : Hovering Near High With Volume Totals Cooling - 12/4/2024 |
View all notes |
Set NEW NOTE alert |
Company Profile |
SEC
News |
Chart |
Request a new note
C
A
S
I |
TW
-
NASDAQ
Tradeweb Markets Cl A
Financial Svcs-Specialty
|
$127.91
|
-1.11
-0.86% |
$129.87
|
1,154,862
135.75% of 50 DAV
50 DAV is 850,700
|
$141.69
-9.73%
|
11/19/2024
|
$134.41
|
PP = $136.23
|
|
MB = $143.04
|
Most Recent Note - 1/15/2025 12:45:56 PM
G - Slumping further below its 50 DMA line ($132) with today's big loss approaching prior lows in the $125 area which define the next very important support level to watch. More damaging losses would raise serious concerns. A rebound above the 50 DMA line is needed for its outlook to improve and it must produce a volume-driven gain above the pivot point to trigger a proper technical buy signal. It was highlighted in yellow with pivot point cited based on its 10/15/24 high plus 10 cents.
>>> FEATURED STOCK ARTICLE : Tradeweb Markets Perched Near High - 11/19/2024 |
View all notes |
Set NEW NOTE alert |
Company Profile |
SEC
News |
Chart |
Request a new note
C
A
S
I |
ATAT
-
NASDAQ
Atour Lifestyle Hldgs ADR
Leisure-Lodging
|
$26.44
|
+0.59
2.28% |
$26.94
|
684,023
54.42% of 50 DAV
50 DAV is 1,257,000
|
$29.90
-11.57%
|
12/9/2024
|
$29.34
|
PP = $29.25
|
|
MB = $30.71
|
Most Recent Note - 1/17/2025 10:02:56 AM
G - Still lingering below its 50 DMA line ($26.53) which may act as resistance. A rebound above the 50 DMA line is needed for its outlook to improve.
>>> FEATURED STOCK ARTICLE : Volume Above Average Behind Breakout Gain - 12/9/2024 |
View all notes |
Set NEW NOTE alert |
Company Profile |
SEC
News |
Chart |
Request a new note
C
A
S
I |
Symbol/Exchange
Company Name
Industry Group |
PRICE |
CHANGE
(%Change) |
Day High |
Volume
(% DAV)
(% 50 day avg vol) |
52 Wk Hi
% From Hi |
Featured
Date |
Price
Featured |
Pivot Featured |
|
Max Buy |
CRAI
-
NASDAQ
CRA International
Comml Svcs-Consulting
|
$185.95
|
+3.20
1.75% |
$189.07
|
22,717
66.81% of 50 DAV
50 DAV is 34,000
|
$210.70
-11.75%
|
12/17/2024
|
$208.34
|
PP = $208.48
|
|
MB = $218.90
|
Most Recent Note - 1/21/2025 3:46:41 PM
G - Today's gain with light volume has it rebounding toward its 50 DMA line which may act as resistance. A rebound above the 50 DMA line ($190) is needed for its outlook to improve. Its 200 DMA line ($174) defines important near-term support. Fundamentals remain strong.
>>> FEATURED STOCK ARTICLE : Volume-Driven Gain for New High Triggered Technical Buy Signal - 12/17/2024 |
View all notes |
Set NEW NOTE alert |
Company Profile |
SEC
News |
Chart |
Request a new note
C
A
S
I |
LRN
-
NYSE
Stride
Consumer Svcs-Education
|
$116.54
|
+2.38
2.08% |
$117.64
|
892,177
124.95% of 50 DAV
50 DAV is 714,000
|
$115.42
0.97%
|
1/10/2025
|
$114.31
|
PP = $112.90
|
|
MB = $118.55
|
Most Recent Note - 1/16/2025 12:47:58 PM
Y - Rising above the pivot point cited based on its 12/04/24 high and hitting a new all-time high with today's early gain. Recently consolidated in an orderly fashion above its 50 DMA line ($105). the 1/10/25 mid-day report noted - "A gain and strong close above the pivot point backed by at least +40% above average volume may clinch a technical buy signal. Reported Sep '24 quarterly earnings +755% on +15% sales revenues versus the year ago period. Three of the 4 latest quarterly comparisons were well above the +25% minimum earnings guideline (C criteria). Annual earnings (A criteria) history has been strong after a downturn in FY '20."
>>> FEATURED STOCK ARTICLE : Encountered Distributional Pressure Amid Broader Weakness - 1/10/2025 |
View all notes |
Set NEW NOTE alert |
Company Profile |
SEC
News |
Chart |
Request a new note
C
A
S
I |
|
|
|
THESE ARE NOT BUY RECOMMENDATIONS!
Comments contained in the body of this report are technical
opinions only. The material herein has been obtained
from sources believed to be reliable and accurate, however,
its accuracy and completeness cannot be guaranteed.
This site is not an investment advisor, hence it does
not endorse or recommend any securities or other investments.
Any recommendation contained in this report may not
be suitable for all investors and it is not to be deemed
an offer or solicitation on our part with respect to
the purchase or sale of any securities. All trademarks,
service marks and trade names appearing in this report
are the property of their respective owners, and are
likewise used for identification purposes only.
This report is a service available
only to active Paid Premium Members.
You may opt-out of receiving report notifications
at any time. Questions or comments may be submitted
by writing to Premium Membership Services 665 S.E. 10 Street, Suite 201 Deerfield Beach, FL 33441-5634 or by calling 1-800-965-8307
or 954-785-1121.
|
|
|