You are not logged in.
This means you
CAN ONLY VIEW reports that were published prior to Sunday, April 6, 2025.
You
MUST UPGRADE YOUR MEMBERSHIP if you want to see any current reports.
AFTER MARKET UPDATE - FRIDAY, JANUARY 21ST, 2022
Previous After Market Report Next After Market Report >>>
|
|
|
|
DOW |
-450.02 |
34,265.37 |
-1.30% |
|
Volume |
1,291,724,823 |
+37% |
|
Volume |
5,788,482,400 |
+15% |
|
NASDAQ |
-385.10 |
13,768.92 |
-2.72% |
|
Advancers |
647 |
20% |
|
Advancers |
875 |
19% |
|
S&P 500 |
-84.79 |
4,397.94 |
-1.89% |
|
Decliners |
2,600 |
80% |
|
Decliners |
3,620 |
81% |
|
Russell 2000 |
-36.12 |
1,987.92 |
-1.78% |
|
52 Wk Highs |
8 |
|
|
52 Wk Highs |
22 |
|
|
S&P 600 |
-17.84 |
1,282.27 |
-1.37% |
|
52 Wk Lows |
525 |
|
|
52 Wk Lows |
1,315 |
|
|
Damaging losses for the major averages recently signaled a market correction (M criteria). Greater caution is advised until strength returns. Disciplined investors know to avoid new buying efforts and to raise cash by selling faltering stocks on a case-by-case basis.
|
 |
Decisive Selling Continues to Sink All Major Market Indices
Kenneth J. Gruneisen - Passed the CAN SLIM® Master's Exam
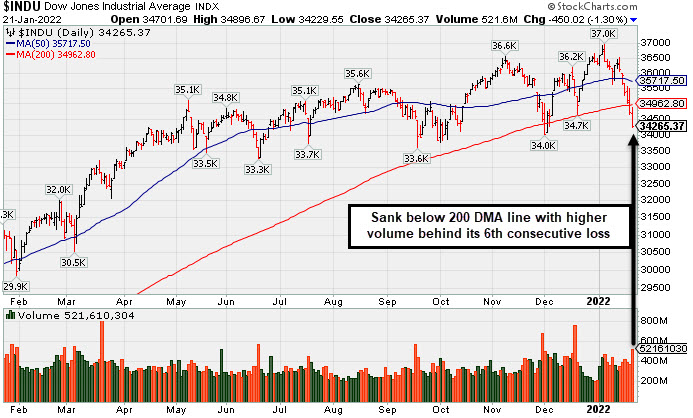
The S&P 500 fell 1.9%, dipping below its 200-day moving average, a closely watched technical level to a three-month low. The broad benchmark logged its worst weekly drawdown since March 2020 (-5.7%), as did the Nasdaq Composite, which shed 2.7% to a seven-month trough, ending a 7.6% weekly drop. The tech-heavy benchmark settled 14.2% below its most recent November 19 record and is positioned for its worst month since October 2008 (-12% month-to-date). The Dow lost 450 points, sliding 4.6% for the week--its worst showing since October 2020. Volume totals reported were inflated by options expirations as they spiked well above the prior session totals on the NYSE and on the Nasdaq exchange, indicating an increase in distributional pressure or selling from the institutional crowd. Breadth was clearly negative as decliners led advancers by a 4-1 margin on the NYSE and on the Nasdaq exchange. There were no high-ranked companies from the Leaders List that hit new 52-week highs and were listed on the BreakOuts Page, versus the total of 5 on the prior session, down from a total of 41 last Friday. New 52-week lows totals expanded and outnumbered new 52-week highs by 65-1 on the NYSE and by 60-1 on the Nasdaq exchange. The market averages (M criteria) have seen damaging losses noted that signaled a more serious market correction. Greater caution is suggested until noted strength returns. PICTURED: The Dow Jones Industrial Average slumped below its 200-day moving average (DMA) line with higher volume behind its 6th consecutive loss.
A rout in U.S. equities deepened on Friday as investors weighed corporate earnings results and remained jittery about valuations and the prospect of tighter monetary policy. Nine of 11 S&P 500 sectors closed in negative territory, with the more traditionally defensive Consumer Staples and Real Estate groups bucking the downtrend. Communication Services led the decline, with Netflix tumbling 21.8% after its current-quarter subscriber growth forecast fell well below analyst estimates. .
Treasuries caught a bid amid the perceived risk off tone, with the yield on the 10-year note down six basis points (0.06%) to 1.76%, declining modestly for the week. Still, the benchmark yield has jumped 25 basis points (0.25%) year-to-date as market participants have repositioned for a faster pace of monetary policy tightening as the Federal Reserve (Fed) has made it clear that combating elevated inflation is a top priority. Next week, the central bank’s two-day policy meeting will headline the proceedings. In commodities, West Texas Intermediate crude settled 1% lower at $84.68/barrel, still capping a fifth consecutive weekly advance, its longest winning streak since October. |
 Kenneth J. Gruneisen started out as a licensed stockbroker in August 1987, a couple of months prior to the historic stock market crash that took the Dow Jones Industrial Average down -22.6% in a single day. He has published daily fact-based fundamental and technical analysis on high-ranked stocks online for two decades. Through FACTBASEDINVESTING.COM, Kenneth provides educational articles, news, market commentary, and other information regarding proven investment systems that work in good times and bad.
Comments contained in the body of this report are technical opinions only and are not necessarily those of Gruneisen Growth Corp. The material herein has been obtained from sources believed to be reliable and accurate, however, its accuracy and completeness cannot be guaranteed. Our firm, employees, and customers may effect transactions, including transactions contrary to any recommendation herein, or have positions in the securities mentioned herein or options with respect thereto. Any recommendation contained in this report may not be suitable for all investors and it is not to be deemed an offer or solicitation on our part with respect to the purchase or sale of any securities. |
|
 |
Retail, Financial, Tech, and Commodity-Linked Groups Fell
Kenneth J. Gruneisen - Passed the CAN SLIM® Master's Exam
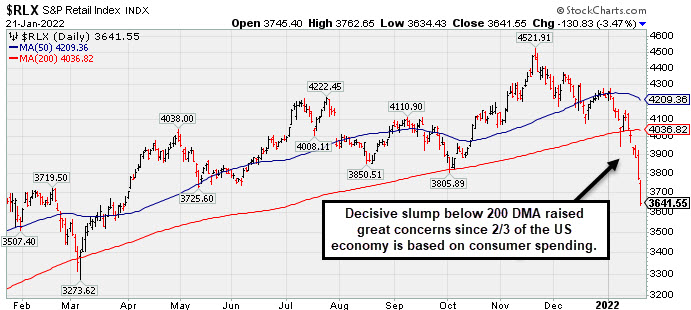
The Retail Index ($RLX -3.47%) and Bank Index ($BKX -3.23%) both suffered losses of more than -3% which weighed on the major averages, meanwhile the Broker/Dealer Index ($XBD -1.76%) also fell. The Biotech Index ($BTK -1.04%), Semiconductor Index ($SOX -1.72%), and Networking Index ($NWX -2.67%) each lost ground. Commodity-linked groups also were weak as the Gold & Silver Index ($XAU -2.92%), Oil Services Index ($OSX -3.07%), and Integrated Oil Index ($XOI -2.32%) suffered unanimous losses.
PICTURED: The Retail Index's ($RLX -3.47%) decisive slump below 200 DMA raised great concerns. Weakness in the retail index bodes poorly for the market outlook since 2/3 of the US economy is based on consumer spending.
| Oil Services |
$OSX |
60.57 |
-1.92 |
-3.07% |
+14.90% |
| Integrated Oil |
$XOI |
1,324.17 |
-31.46 |
-2.32% |
+12.39% |
| Semiconductor |
$SOX |
3,434.79 |
-59.97 |
-1.72% |
-12.96% |
| Networking |
$NWX |
854.46 |
-23.40 |
-2.67% |
-12.01% |
| Broker/Dealer |
$XBD |
461.93 |
-8.28 |
-1.76% |
-5.12% |
| Retail |
$RLX |
3,641.55 |
-130.83 |
-3.47% |
-13.84% |
| Gold & Silver |
$XAU |
129.99 |
-3.91 |
-2.92% |
-1.86% |
| Bank |
$BKX |
132.35 |
-4.42 |
-3.23% |
+0.10% |
| Biotech |
$BTK |
4,908.89 |
-51.78 |
-1.04% |
-11.05% |
|
|
|
 |
Violated 200 DMA Line With 4th Consecutive Loss
Kenneth J. Gruneisen - Passed the CAN SLIM® Master's Exam
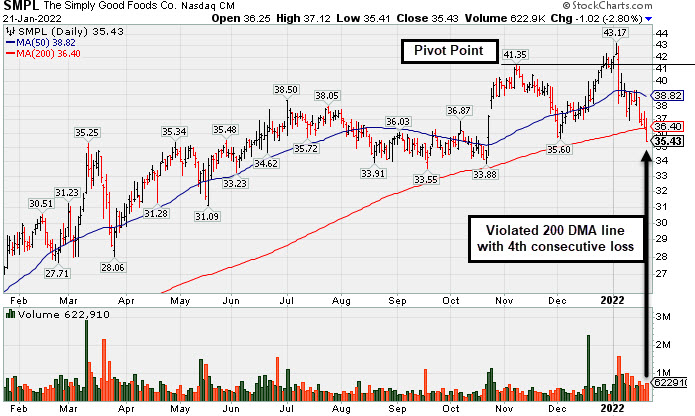
Simply Good Foods Co (SMPL -$1.02 or -2.80% to $35.43) suffered a 4th consecutive loss today triggering a more worrisome technical sell signal while slumping below its 200 DMA line ($36.40) and undercutting the prior low ($35.60 on 12/02/21) which was noted as important near-term support. It will be dropped from the Featured Stocks list tonight. A rebound above the 50 DMA line ($38.82) is needed for its outlook to improve.
Recently it reported Aug '21 quarterly earnings +45% on +17% sales revenues versus the year ago period, well above the +25% minimum earnings guideline (C criteria). In 5 of the past 7 quarterly comparisons earnings were above the +25% minimum guideline (C criteria). Its annual earnings history (A criteria) has been strong. It currently has a 95 Earnings Per Share Rating.
Its current Relative Strength Rating is 89, above the 80+ minimum guideline for buy candidates. SMPL completed a new Pubic Offering on 10/09/19. The company has a Timeliness Rating of A and Sponsorship Rating of C. The number of top-rated funds owning its shares rose from 357 in Dec '20 to 438 in Dec '21. Its current Up/Down Volume Ratio of 1.2 is an unbiased indication its shares have been under accumulation pressure over the past 50 days.
SMPL was last shown in this FSU section on 12/22/21 with an annotated graph included under the headline, "Formed New 5-Week Base and Perched Near Pivot Point". It was first highlighted in yellow with pivot point cited based on its 9/09/19 high plus 10 cents in the 12/28/20 mid-day report (read here). Some leadership has been provided by other companies in the Food/Beverage Sector, however, the Food-Confectionery industry group has a Group Relative Strength Rating of 65 (B) which is a concern regarding the L criteria. There are only 5 companies listed in the group.
|
|
|
Color Codes Explained :
Y - Better candidates highlighted by our
staff of experts.
G - Previously featured
in past reports as yellow but may no longer be buyable under the
guidelines.
***Last / Change / Volume data in this table is the closing quote data***
Symbol/Exchange
Company Name
Industry Group |
PRICE |
CHANGE
(%Change) |
Day High |
Volume
(% DAV)
(% 50 day avg vol) |
52 Wk Hi
% From Hi |
Featured
Date |
Price
Featured |
Pivot Featured |
|
Max Buy |
 BLDR
-
NYSE
BLDR
-
NYSE
Builders Firstsource Inc
Bldg-Constr Prds/Misc
|
$67.00
|
-2.74
-3.93% |
$70.31
|
3,718,537
135.56% of 50 DAV
50 DAV is 2,743,000
|
$86.48
-22.53%
|
8/12/2021
|
$52.38
|
PP = $54.09
|
|
MB = $56.79
|
 Most Recent Note - 1/21/2022 5:17:46 PM
Slumped further below its 50 DMA line ($76) and prior low ($72.60 on 12/20/21) with higher volume behind today's 6th consecutive damaging loss. It will be dropped from the Featured Stocks list tonight. A rebound above the 50 DMA line is needed for its outlook to improve.
>>> FEATURED STOCK ARTICLE : Pulling Back After Getting Very Extended From Any Sound Base - 1/10/2022 |
View all notes |
Set NEW NOTE alert |
Company Profile |
SEC
News |
Chart |
Request a new note
C
A
S
I |
REGN
-
NASDAQ
Regeneron Pharmaceutical
DRUGS - Biotechnology
|
$621.40
|
+7.02
1.14% |
$623.98
|
1,328,498
188.71% of 50 DAV
50 DAV is 704,000
|
$686.62
-9.50%
|
12/13/2021
|
$647.95
|
PP = $686.72
|
|
MB = $721.06
|
Most Recent Note - 1/18/2022 5:15:27 PM
G - Pulled back for a 3rd consecutive loss today with ever- increasing volume. A rebound above the 50 DMA line ($632.77) still is needed for its outlook to improve. Prior lows and its 200 DMA line ($584) define the next important support.
>>> FEATURED STOCK ARTICLE : Regeneron Still Lingering Below 50-Day Moving Average Line - 1/11/2022 |
View all notes |
Set NEW NOTE alert |
Company Profile |
SEC
News |
Chart |
Request a new note
C
A
S
I |
LLY
-
NYSE
Eli Lilly & Co
Medical-Diversified
|
$243.06
|
-0.07
-0.03% |
$247.88
|
2,784,100
90.42% of 50 DAV
50 DAV is 3,079,000
|
$283.91
-14.39%
|
12/16/2021
|
$279.28
|
PP = $275.97
|
|
MB = $289.77
|
Most Recent Note - 1/18/2022 5:06:24 PM
G - Posted a gain today with lighter volume, halting its slide after slumping well below its 50 DMA line ($260) with recent volume-driven losses raising concerns and triggering a technical sell signal. A prompt rebound above the 50 DMA line is needed for its outlook to improve. See the latest FSU analysis for more details and a new annotated graph.
>>> FEATURED STOCK ARTICLE : Stalled and Slumped Well Below 50 DMA Line - 1/19/2022 |
View all notes |
Set NEW NOTE alert |
Company Profile |
SEC
News |
Chart |
Request a new note
C
A
S
I |
UMC
-
NYSE
United Microelectrnc Adr
ELECTRONICS - Semiconductor - Integrated Cir
|
$10.88
|
-0.25
-2.25% |
$11.27
|
11,596,093
162.75% of 50 DAV
50 DAV is 7,125,000
|
$12.68
-14.20%
|
12/1/2021
|
$12.60
|
PP = $12.72
|
|
MB = $13.36
|
Most Recent Note - 1/19/2022 4:04:49 PM
Y - Recently consolidating near its 50 DMA line ($11.47). Any damaging losses below the prior lows ($10.86) would raise more serious concerns and trigger a technical sell signal. A gain and solid close above the pivot point may help clinch a proper new (or add-on) technical buy signal. Reported Sep '21 quarterly earnings +100% on +30% sales revenues versus the year ago period.
>>> FEATURED STOCK ARTICLE : Testing Support and Perched Not Far From Prior Highs - 1/4/2022 |
View all notes |
Set NEW NOTE alert |
Company Profile |
SEC
News |
Chart |
Request a new note
C
A
S
I |
TITN
-
NASDAQ
Titan Machinery Inc
SPECIALTY RETAIL
|
$30.03
|
-0.88
-2.85% |
$31.40
|
169,153
90.46% of 50 DAV
50 DAV is 187,000
|
$38.58
-22.16%
|
11/23/2021
|
$36.22
|
PP = $35.34
|
|
MB = $37.11
|
Most Recent Note - 1/20/2022 5:39:00 PM
G - Sank well below its 50 DMA line ($33.25) with today's 3rd consecutive loss testing the prior low ($30.27 on 12/20/21). A rebound above the 50 DMA line is needed for its outlook to improve. It faces resistance due to overhead supply up to the $38 level. Fundamentals remain strong.
>>> FEATURED STOCK ARTICLE : Recently Found Support at 50-Day Moving Average Line - 12/31/2021 |
View all notes |
Set NEW NOTE alert |
Company Profile |
SEC
News |
Chart |
Request a new note
C
A
S
I |
Symbol/Exchange
Company Name
Industry Group |
PRICE |
CHANGE
(%Change) |
Day High |
Volume
(% DAV)
(% 50 day avg vol) |
52 Wk Hi
% From Hi |
Featured
Date |
Price
Featured |
Pivot Featured |
|
Max Buy |
SMPL
-
NASDAQ
Simply Good Foods Co
Food-Confectionery
|
$35.43
|
-1.02
-2.80% |
$37.13
|
622,910
124.58% of 50 DAV
50 DAV is 500,000
|
$43.17
-17.93%
|
12/22/2021
|
$40.04
|
PP = $41.45
|
|
MB = $43.52
|
Most Recent Note - 1/21/2022 5:12:50 PM
Suffered a 4th consecutive loss today violating its 200 DMA line ($36.33) and prior low ($35.60 on 12/02/21) triggering worrisome technical sell signals. It will be dropped from the Featured Stocks list tonight. Reported Nov '21 quarterly earnings +48% on +22% sales revenues versus the year ago period. See the latest FSU analysis for more details and a new annotated graph.
>>> FEATURED STOCK ARTICLE : Violated 200 DMA Line With 4th Consecutive Loss - 1/21/2022 |
View all notes |
Set NEW NOTE alert |
Company Profile |
SEC
News |
Chart |
Request a new note
C
A
S
I |
HLI
-
NYSE
Houlihan Lokey Inc Cl A
Finance-Invest Bnk/Bkrs
|
$101.50
|
-2.57
-2.47% |
$104.10
|
570,123
148.47% of 50 DAV
50 DAV is 384,000
|
$122.62
-17.22%
|
1/12/2022
|
$118.49
|
PP = $119.99
|
|
MB = $125.99
|
Most Recent Note - 1/21/2022 5:19:56 PM
Sank further after violating its 50 DMA line with today's 6th consecutive volume-drive loss. A rebound above the 50 DMA line is needed for its outlook to improve. It will be dropped from the Featured Stocks list tonight. Reported Sep '21 quarterly earnings +128% on +95% sales revenues versus the year ago period, marking its 4th quarterly comparison above the +25% minimum earnings guideline (C criteria). Completed a new Public Offering on 5/20/20.
>>> FEATURED STOCK ARTICLE : Powerful Volume-Driven Gain for New High - 1/12/2022 |
View all notes |
Set NEW NOTE alert |
Company Profile |
SEC
News |
Chart |
Request a new note
C
A
S
I |
AVTR
-
NYSE
Avantor Inc
Medical-Research Eqp/Svc
|
$36.08
|
-0.85
-2.30% |
$37.04
|
4,054,628
111.48% of 50 DAV
50 DAV is 3,637,200
|
$44.37
-18.68%
|
12/27/2021
|
$41.96
|
PP = $44.47
|
|
MB = $46.69
|
Most Recent Note - 1/21/2022 5:15:41 PM
Slumped below its 200 DMA line ($37.19) today testing the prior low and it will be dropped from the Featured Stocks list tonight. Its Relative Strength Rating has slumped to 77, below the 80+ minimum guideline for buy candidates. A rebound above the 50 DMA line ($39.19) is needed for its outlook to improve. Reported Sep '21 quarterly earnings +46% above the year ago period.
>>> FEATURED STOCK ARTICLE : Met Resistance at 50-Day Moving Average Line - 1/20/2022 |
View all notes |
Set NEW NOTE alert |
Company Profile |
SEC
News |
Chart |
Request a new note
C
A
S
I |
|
|
|
THESE ARE NOT BUY RECOMMENDATIONS!
Comments contained in the body of this report are technical
opinions only. The material herein has been obtained
from sources believed to be reliable and accurate, however,
its accuracy and completeness cannot be guaranteed.
This site is not an investment advisor, hence it does
not endorse or recommend any securities or other investments.
Any recommendation contained in this report may not
be suitable for all investors and it is not to be deemed
an offer or solicitation on our part with respect to
the purchase or sale of any securities. All trademarks,
service marks and trade names appearing in this report
are the property of their respective owners, and are
likewise used for identification purposes only.
This report is a service available
only to active Paid Premium Members.
You may opt-out of receiving report notifications
at any time. Questions or comments may be submitted
by writing to Premium Membership Services 665 S.E. 10 Street, Suite 201 Deerfield Beach, FL 33441-5634 or by calling 1-800-965-8307
or 954-785-1121.
|
|
|