You are not logged in.
This means you
CAN ONLY VIEW reports that were published prior to Monday, January 13, 2025.
You
MUST UPGRADE YOUR MEMBERSHIP if you want to see any current reports.
AFTER MARKET UPDATE - THURSDAY, DECEMBER 19TH, 2024
Previous After Market Report Next After Market Report >>>
|
|
|
|
DOW |
+15.37 |
42,342.24 |
+0.04% |
|
Volume |
1,225,096,601 |
-8% |
|
Volume |
8,094,043,700 |
-22% |
|
NASDAQ |
-19.92 |
19,372.77 |
-0.10% |
|
Advancers |
933 |
34% |
|
Advancers |
1,805 |
42% |
|
S&P 500 |
-5.08 |
5,867.08 |
-0.09% |
|
Decliners |
1,813 |
66% |
|
Decliners |
2,490 |
58% |
|
Russell 2000 |
-10.01 |
2,221.50 |
-0.45% |
|
52 Wk Highs |
13 |
|
|
52 Wk Highs |
48 |
|
|
S&P 600 |
-5.57 |
1,408.46 |
-0.39% |
|
52 Wk Lows |
255 |
|
|
52 Wk Lows |
331 |
|
|
 |
Major Indices Sputtered With Leadership Obviously Drying Up
Kenneth J. Gruneisen - Passed the CAN SLIM® Master's Exam
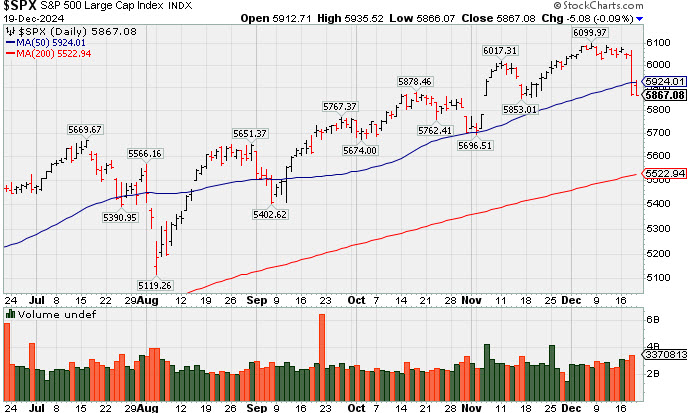
The S&P 500 and Nasdaq Composite each settled 0.1% lower while the Dow Industrials ended just above unchanged on Thursday. Volume was lighter than the prior session totals on the NYSE and on the Nasdaq exchange. Decliners led advancers by a 2-1 margin at the NYSE and by 4-3 at the Nasdaq exchange. Leadership continued to dry up as there were only 2 high-ranked companies from the Leaders List that hit new 52-week highs and were listed on the BreakOuts Page, versus the total of 8 on the prior session. New 52-week lows outnumbered new 52-week highs on the NYSE and on the Nasdaq exchange. The major indices' uptrend has come under pressure (M criteria). Disciplined investors know that new buying efforts are only to be made in stocks meeting all key criteria of the fact-based investment system.
PICTURED: The S&P 500 Index pulled back a little bit more after slumping below its 50-day moving average (DMA) line on the prior session while retreating from its all-time high.
The Bank of England voted 6-to-3 to leave its benchmark rate unchanged at 4.75% and the Bank of Japan voted 8-to-1 to leave its benchmark rate unchanged at 0.25%. The US Treasuries saw the10-yr yield jump another eight basis points to 4.57% after a batch of fresh economic data that was better than expected including initial jobless claims, estimates for Q3 GDP, existing home sales, and leading indicators.
Disappointing earnings results and guidance from Micron (MU -16.18%) and Lennar Corp. (LEN -5.18%) added to the market's negative vibe. FedEx (FDX +1.0%) and Carnival Corp. (CCL +1.5%) were gainers in front of their earnings reports.
|
 Kenneth J. Gruneisen started out as a licensed stockbroker in August 1987, a couple of months prior to the historic stock market crash that took the Dow Jones Industrial Average down -22.6% in a single day. He has published daily fact-based fundamental and technical analysis on high-ranked stocks online for two decades. Through FACTBASEDINVESTING.COM, Kenneth provides educational articles, news, market commentary, and other information regarding proven investment systems that work in good times and bad.
Comments contained in the body of this report are technical opinions only and are not necessarily those of Gruneisen Growth Corp. The material herein has been obtained from sources believed to be reliable and accurate, however, its accuracy and completeness cannot be guaranteed. Our firm, employees, and customers may effect transactions, including transactions contrary to any recommendation herein, or have positions in the securities mentioned herein or options with respect thereto. Any recommendation contained in this report may not be suitable for all investors and it is not to be deemed an offer or solicitation on our part with respect to the purchase or sale of any securities. |
|
 |
Retail Index Rose; Semiconductor and Commodity-Linked Groups Fell
Kenneth J. Gruneisen - Passed the CAN SLIM® Master's Exam
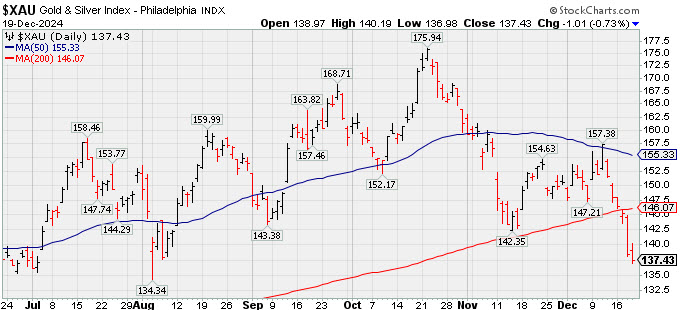
The Retail Index ($RLX +0.42%) and Broker/Dealer Index ($XBD +0.20%) both posted small gains while the Bank Index ($BKX -0.04%) finished flat on Thursday. The tech sector had a negative bias as the Semiconductor Index ($SOX -1.56%) outpaced the Biotech Index ($BTK -0.54%) and Networking Index ($NWX -0.14%) to the downside. Commodity-linked groups also had a negative bias as the Gold & Silver Index ($XAU -0.73%), Oil Services Index ($OSX -1.14%), and the Integrated Oil Index ($XOI -1.36%) each finished the session lower.
PICTURED: The Gold & Silver Index ($XAU -0.73%) suffered a 6th consecutive loss, slumping well below its 200-day moving average line and below its November low.
| Oil Services |
$OSX |
69.11 |
-0.79 |
-1.14% |
-17.61% |
| Integrated Oil |
$XOI |
1,691.77 |
-23.34 |
-1.36% |
-9.17% |
| Semiconductor |
$SOX |
4,893.47 |
-77.51 |
-1.56% |
+17.20% |
| Networking |
$NWX |
1,252.25 |
-1.71 |
-0.14% |
+50.36% |
| Broker/Dealer |
$XBD |
788.05 |
+1.53 |
+0.20% |
+41.41% |
| Retail Index |
$RLX |
5,199.81 |
+21.70 |
+0.42% |
+33.71% |
| Gold & Silver |
$XAU |
137.44 |
-1.01 |
-0.73% |
+9.34% |
| Bank |
$BKX |
124.71 |
-0.04 |
-0.04% |
+29.88% |
| Biotech |
$BTK |
5,688.26 |
-30.71 |
-0.54% |
+4.97% |
|
|
|
 |
Featured Stocks
Kenneth J. Gruneisen - Passed the CAN SLIM® Master's Exam
Symbol/Exchange
Company Name
Industry Group | PRICE | CHANGE
(%Change) | Day High | Volume
(% DAV)
(% 50 day avg vol) | 52 Wk Hi
% From Hi | Featured
Date | Price
Featured | Pivot Featured | | Max Buy |  USLM - NASDAQ USLM - NASDAQ
U.S. Lime & Minerals
Bldg-Cement/Concrt/Ag | $133.74 | +0.13
0.10% | $140.01 | 121,947
123.18% of 50 DAV
50 DAV is 99,000 | $159.53
-16.17%
| 9/17/2024 | $71.26 | PP = $87.23 | | MB = $91.59 | Most Recent Note - 12/18/2024 9:45:32 PM
G - Fell today for a 4th consecutive loss with average volume. Slumped near its 50 DMA line ($129.50) which defines important near-term support to watch.
>>> FEATURED STOCK ARTICLE : Extended From Any Sound Base After Impressive Rally - 11/12/2024 | View all notes | Set NEW NOTE alert | Company Profile | SEC News | Chart | Request a new note C A S I | GVA - NYSE
Granite Construction
Bldg-Heavy Construction | $90.00 | +0.84
0.94% | $91.79 | 572,572
84.95% of 50 DAV
50 DAV is 674,000 | $105.20
-14.45%
| 6/11/2024 | $59.76 | PP = $64.33 | | MB = $67.55 | Most Recent Note - 12/17/2024 2:02:05 PM
G - Testing its 50 DMA line ($91.17) today wit its 8th loss in the span of 9 sessions after a "negative reversal" at its all-time high. More damaging losses may trigger a technical sell signal. Reported Sep ''24 quarterly earnings +19% on +14% sales revenues versus the year-ago period, repeatedly noted as "below the +25% minimum guideline (C criteria) of the fact-based investment system."
>>> FEATURED STOCK ARTICLE : Negative Reversal After Hitting New All-Time High - 12/6/2024 | View all notes | Set NEW NOTE alert | Company Profile | SEC News | Chart | Request a new note C A S I | TXRH - NASDAQ
Texas Roadhouse
Retail-Restaurants | $182.86 | +3.91
2.18% | $185.87 | 909,543
130.12% of 50 DAV
50 DAV is 699,000 | $206.04
-11.25%
| 7/26/2024 | $173.08 | PP = $175.82 | | MB = $184.61 | Most Recent Note - 12/17/2024 3:08:24 PM
G - Quietly slumped below its 50 DMA line ($190) raising concerns with recent losses backed by light volume. A prompt rebound above the 50 DMA line is needed for its outlook to improve.
>>> FEATURED STOCK ARTICLE : Hovering Near High After Recent Volume-driven Gains - 11/15/2024 | View all notes | Set NEW NOTE alert | Company Profile | SEC News | Chart | Request a new note C A S I | HWM - NYSE
Howmet Aerospace
Aerospace/Defense | $109.35 | +1.66
1.54% | $110.80 | 2,841,562
121.28% of 50 DAV
50 DAV is 2,343,000 | $120.71
-9.41%
| 7/30/2024 | $93.95 | PP = $85.52 | | MB = $89.80 | Most Recent Note - 12/17/2024 1:57:05 PM
G - Pulling back today for a 4th consecutive loss with lighter volume. Its 50 DMA line ($110.14) and prior high ($106.93 on 10/21/24) define near-term support levels to watch. Fundamentals remain strong.
>>> FEATURED STOCK ARTICLE : Extended From Prior Base and Perched at High - 12/5/2024 | View all notes | Set NEW NOTE alert | Company Profile | SEC News | Chart | Request a new note C A S I | NGVC - NYSE
Natural Grocers
Retail-Super/Mini Mkts | $39.16 | +0.96
2.51% | $39.67 | 94,587
90.08% of 50 DAV
50 DAV is 105,000 | $47.57
-17.68%
| 11/5/2024 | $30.57 | PP = $30.42 | | MB = $31.94 | Most Recent Note - 12/18/2024 9:39:49 PM
G - Pulled back for a 5th consecutive loss, retreating from its all-time high after getting very extended from any sound base. Reported Sep '24 quarterly earnings +50% on +9% sales revenues versus the year-ago period. Its 50 DMA line ($34.77) defines near-term support above prior highs in the $30 area.
>>> FEATURED STOCK ARTICLE : Consolidating After Considerable Rally to New Highs - 12/16/2024 | View all notes | Set NEW NOTE alert | Company Profile | SEC News | Chart | Request a new note C A S I | Symbol/Exchange
Company Name
Industry Group | PRICE | CHANGE
(%Change) | Day High | Volume
(% DAV)
(% 50 day avg vol) | 52 Wk Hi
% From Hi | Featured
Date | Price
Featured | Pivot Featured | | Max Buy | CLS - NYSE
Celestica
Elec-Contract Mfg | $93.05 | +0.94
1.02% | $95.92 | 1,662,769
65.10% of 50 DAV
50 DAV is 2,554,000 | $100.51
-7.42%
| 10/11/2024 | $57.62 | PP = $63.59 | | MB = $66.77 | Most Recent Note - 12/18/2024 9:38:39 PM
G - Suffered a big loss today with higher (near average) volume while retreating from its all-time high. It is very extended from any sound base. Its 50 DMA line ($79) defines initial support to watch on pullbacks.
>>> FEATURED STOCK ARTICLE : Pulling Back After Considerable Rally - 11/13/2024 | View all notes | Set NEW NOTE alert | Company Profile | SEC News | Chart | Request a new note C A S I | PAY - NYSE
Paymentus Holdings
Finance-CrdtCard/PmtPr | $32.95 | -0.81
-2.40% | $35.18 | 310,584
72.23% of 50 DAV
50 DAV is 430,000 | $38.94
-15.38%
| 10/17/2024 | $26.15 | PP = $25.31 | | MB = $26.58 | Most Recent Note - 12/18/2024 9:41:06 PM
G - Suffered a big loss today with above average volume. Consolidating well above its 50 DMA line ($30) which defines important near-term support to watch. It is extended from any sound base.
>>> FEATURED STOCK ARTICLE : Extended From Prior Base After Considerable Spike Higher - 11/14/2024 | View all notes | Set NEW NOTE alert | Company Profile | SEC News | Chart | Request a new note C A S I | RMD - NYSE
Resmed Inc
HEALTH SERVICES - Medical Appliances and Equipment | $231.58 | +1.37
0.60% | $235.50 | 568,630
62.43% of 50 DAV
50 DAV is 910,900 | $260.49
-11.10%
| 10/25/2024 | $256.64 | PP = $255.28 | | MB = $268.04 | Most Recent Note - 12/18/2024 9:43:24 PM
G - Closed near the session low as it slumped further below its 50 DMA line ($242.68) with today''s damaging loss undercutting the prior low. Its Relative Strength Rating has slumped to 75, below the 80+ minimum guideline for buy candidates, raising concerns.
>>> FEATURED STOCK ARTICLE : Recent Slump Below 50-Day Moving Average Raised Concerns - 11/18/2024 | View all notes | Set NEW NOTE alert | Company Profile | SEC News | Chart | Request a new note C A S I | ATGE - NYSE
Adtalem Global Education
Consumer Svcs-Education | $88.41 | +2.43
2.83% | $89.10 | 537,582
150.16% of 50 DAV
50 DAV is 358,000 | $92.93
-4.86%
| 10/30/2024 | $83.34 | PP = $80.28 | | MB = $84.29 |  Most Recent Note - 12/19/2024 4:47:09 PM Most Recent Note - 12/19/2024 4:47:09 PM
G - Posted a solid gain today with above average volume. Consolidating in an orderly fashion above its 50 DMA line ($84) which defines initial support above prior highs in the $80 area. Fundamentals remain strong.
>>> FEATURED STOCK ARTICLE : Hovering Near High With Volume Totals Cooling - 12/4/2024 | View all notes | Set NEW NOTE alert | Company Profile | SEC News | Chart | Request a new note C A S I | TW - NASDAQ
Tradeweb Markets
Financial Svcs-Specialty | $130.33 | -0.11
-0.08% | $131.85 | 746,639
84.94% of 50 DAV
50 DAV is 879,000 | $141.69
-8.02%
| 11/19/2024 | $134.41 | PP = $136.23 | | MB = $143.04 | Most Recent Note - 12/17/2024 3:07:38 PM
Y - Consolidating above its 50 DMA line ($132) after encountering distributional pressure. Since recently featured it has not produced a volume-driven gain above the pivot point to trigger a proper technical buy signal. It was highlighted in yellow with pivot point cited based on its 10/15/24 high plus 10 cents.
>>> FEATURED STOCK ARTICLE : Tradeweb Markets Perched Near High - 11/19/2024 | View all notes | Set NEW NOTE alert | Company Profile | SEC News | Chart | Request a new note C A S I | Symbol/Exchange
Company Name
Industry Group | PRICE | CHANGE
(%Change) | Day High | Volume
(% DAV)
(% 50 day avg vol) | 52 Wk Hi
% From Hi | Featured
Date | Price
Featured | Pivot Featured | | Max Buy | ATAT - NASDAQ
Atour Lifestyle Hldgs ADR
Leisure-Lodging | $27.32 | +0.01
0.04% | $27.92 | 577,899
45.58% of 50 DAV
50 DAV is 1,268,000 | $29.90
-8.63%
| 12/9/2024 | $29.34 | PP = $29.25 | | MB = $30.71 | Most Recent Note - 12/17/2024 12:11:57 PM
Y - Rallying near prior highs with today's big gain backed by higher volume. Found support near its 50 DMA line ($26.66). A violation would trigger a technical sell signal.
>>> FEATURED STOCK ARTICLE : Volume Above Average Behind Breakout Gain - 12/9/2024 | View all notes | Set NEW NOTE alert | Company Profile | SEC News | Chart | Request a new note C A S I | VEEV - NYSE
Veeva Systems Inc Cl A
Computer Sftwr-Medical | $219.67 | -1.87
-0.84% | $226.95 | 1,102,088
99.19% of 50 DAV
50 DAV is 1,111,100 | $258.93
-15.16%
| 12/9/2024 | $250.70 | PP = $240.68 | | MB = $252.71 | Most Recent Note - 12/16/2024 12:48:00 PM
Y - It has slumped back well into the prior base raising concerns following a noted 12/06/24 "breakaway gap". Reported Oct '24 quarterly earnings +31% on +13% sales revenues versus the year-ago period, its 3rd consecutive quarterly comparison above the +25% minimum earnings guideline (C criteria). Annual earnings growth has been strong.
>>> FEATURED STOCK ARTICLE : Veeva Systems Consolidating After "Breakaway Gap" - 12/10/2024 | View all notes | Set NEW NOTE alert | Company Profile | SEC News | Chart | Request a new note C A S I | CRAI - NASDAQ
CRA International
Comml Svcs-Consulting | $189.96 | +1.39
0.74% | $191.42 | 27,394
76.09% of 50 DAV
50 DAV is 36,000 | $210.70
-9.84%
| 12/17/2024 | $208.34 | PP = $208.48 | | MB = $218.90 | Most Recent Note - 12/18/2024 9:35:53 PM
Y - Negated the prior breakout with a big loss today. Highlighted in yellow in the prior mid-day report with pivot point cited based on its 11/06/24 high plus 10 cents after a 6-week base. Reported Sep ''24 quarterly earnings +57% on +14% sales revenues versus the year-ago period, its 3rd strong quarter above the +25% minimum earnings guideline (C criteria). Annual earnings (A criteria) growth has been strong and steady. See the latest FSU analysis for more details and an annotated graph.
>>> FEATURED STOCK ARTICLE : Volume-Driven Gain for New High Triggered Technical Buy Signal - 12/17/2024 | View all notes | Set NEW NOTE alert | Company Profile | SEC News | Chart | Request a new note C A S I |
|
|
|
Color Codes Explained :
Y - Better candidates highlighted by our
staff of experts.
G - Previously featured
in past reports as yellow but may no longer be buyable under the
guidelines.
***Last / Change / Volume data in this table is the closing quote data***
Symbol/Exchange
Company Name
Industry Group |
PRICE |
CHANGE
(%Change) |
Day High |
Volume
(% DAV)
(% 50 day avg vol) |
52 Wk Hi
% From Hi |
Featured
Date |
Price
Featured |
Pivot Featured |
|
Max Buy |
 USLM
-
NASDAQ
USLM
-
NASDAQ
U.S. Lime & Minerals
Bldg-Cement/Concrt/Ag
|
$133.61
|
-7.79
-5.51% |
$144.20
|
103,017
105.12% of 50 DAV
50 DAV is 98,000
|
$159.53
-16.25%
|
9/17/2024
|
$71.26
|
PP = $87.23
|
|
MB = $91.59
|
 Most Recent Note - 12/18/2024 9:45:32 PM
G - Fell today for a 4th consecutive loss with average volume. Slumped near its 50 DMA line ($129.50) which defines important near-term support to watch.
>>> FEATURED STOCK ARTICLE : Extended From Any Sound Base After Impressive Rally - 11/12/2024 |
View all notes |
Set NEW NOTE alert |
Company Profile |
SEC
News |
Chart |
Request a new note
C
A
S
I |
GVA
-
NYSE
Granite Construction
Bldg-Heavy Construction
|
$89.16
|
-2.62
-2.85% |
$93.75
|
640,334
95.86% of 50 DAV
50 DAV is 668,000
|
$105.20
-15.25%
|
6/11/2024
|
$59.76
|
PP = $64.33
|
|
MB = $67.55
|
Most Recent Note - 12/17/2024 2:02:05 PM
G - Testing its 50 DMA line ($91.17) today wit its 8th loss in the span of 9 sessions after a "negative reversal" at its all-time high. More damaging losses may trigger a technical sell signal. Reported Sep '24 quarterly earnings +19% on +14% sales revenues versus the year-ago period, repeatedly noted as "below the +25% minimum guideline (C criteria) of the fact-based investment system."
>>> FEATURED STOCK ARTICLE : Negative Reversal After Hitting New All-Time High - 12/6/2024 |
View all notes |
Set NEW NOTE alert |
Company Profile |
SEC
News |
Chart |
Request a new note
C
A
S
I |
TXRH
-
NASDAQ
Texas Roadhouse
Retail-Restaurants
|
$178.95
|
-7.97
-4.26% |
$187.46
|
788,721
113.81% of 50 DAV
50 DAV is 693,000
|
$206.04
-13.15%
|
7/26/2024
|
$173.08
|
PP = $175.82
|
|
MB = $184.61
|
Most Recent Note - 12/17/2024 3:08:24 PM
G - Quietly slumped below its 50 DMA line ($190) raising concerns with recent losses backed by light volume. A prompt rebound above the 50 DMA line is needed for its outlook to improve.
>>> FEATURED STOCK ARTICLE : Hovering Near High After Recent Volume-driven Gains - 11/15/2024 |
View all notes |
Set NEW NOTE alert |
Company Profile |
SEC
News |
Chart |
Request a new note
C
A
S
I |
HWM
-
NYSE
Howmet Aerospace
Aerospace/Defense
|
$107.69
|
-4.24
-3.79% |
$112.31
|
2,448,450
105.35% of 50 DAV
50 DAV is 2,324,000
|
$120.71
-10.79%
|
7/30/2024
|
$93.95
|
PP = $85.52
|
|
MB = $89.80
|
Most Recent Note - 12/17/2024 1:57:05 PM
G - Pulling back today for a 4th consecutive loss with lighter volume. Its 50 DMA line ($110.14) and prior high ($106.93 on 10/21/24) define near-term support levels to watch. Fundamentals remain strong.
>>> FEATURED STOCK ARTICLE : Extended From Prior Base and Perched at High - 12/5/2024 |
View all notes |
Set NEW NOTE alert |
Company Profile |
SEC
News |
Chart |
Request a new note
C
A
S
I |
NGVC
-
NYSE
Natural Grocers
Retail-Super/Mini Mkts
|
$38.20
|
-2.43
-5.98% |
$41.17
|
120,033
115.42% of 50 DAV
50 DAV is 104,000
|
$47.57
-19.70%
|
11/5/2024
|
$30.57
|
PP = $30.42
|
|
MB = $31.94
|
Most Recent Note - 12/18/2024 9:39:49 PM
G - Pulled back for a 5th consecutive loss, retreating from its all-time high after getting very extended from any sound base. Reported Sep '24 quarterly earnings +50% on +9% sales revenues versus the year-ago period. Its 50 DMA line ($34.77) defines near-term support above prior highs in the $30 area.
>>> FEATURED STOCK ARTICLE : Consolidating After Considerable Rally to New Highs - 12/16/2024 |
View all notes |
Set NEW NOTE alert |
Company Profile |
SEC
News |
Chart |
Request a new note
C
A
S
I |
Symbol/Exchange
Company Name
Industry Group |
PRICE |
CHANGE
(%Change) |
Day High |
Volume
(% DAV)
(% 50 day avg vol) |
52 Wk Hi
% From Hi |
Featured
Date |
Price
Featured |
Pivot Featured |
|
Max Buy |
CLS
-
NYSE
Celestica
Elec-Contract Mfg
|
$92.11
|
-5.70
-5.83% |
$99.60
|
2,639,157
104.23% of 50 DAV
50 DAV is 2,532,000
|
$100.51
-8.36%
|
10/11/2024
|
$57.62
|
PP = $63.59
|
|
MB = $66.77
|
Most Recent Note - 12/18/2024 9:38:39 PM
G - Suffered a big loss today with higher (near average) volume while retreating from its all-time high. It is very extended from any sound base. Its 50 DMA line ($79) defines initial support to watch on pullbacks.
>>> FEATURED STOCK ARTICLE : Pulling Back After Considerable Rally - 11/13/2024 |
View all notes |
Set NEW NOTE alert |
Company Profile |
SEC
News |
Chart |
Request a new note
C
A
S
I |
PAY
-
NYSE
Paymentus Holdings
Finance-CrdtCard/PmtPr
|
$33.76
|
-1.95
-5.46% |
$35.84
|
668,103
159.45% of 50 DAV
50 DAV is 419,000
|
$38.94
-13.30%
|
10/17/2024
|
$26.15
|
PP = $25.31
|
|
MB = $26.58
|
Most Recent Note - 12/18/2024 9:41:06 PM
G - Suffered a big loss today with above average volume. Consolidating well above its 50 DMA line ($30) which defines important near-term support to watch. It is extended from any sound base.
>>> FEATURED STOCK ARTICLE : Extended From Prior Base After Considerable Spike Higher - 11/14/2024 |
View all notes |
Set NEW NOTE alert |
Company Profile |
SEC
News |
Chart |
Request a new note
C
A
S
I |
RMD
-
NYSE
Resmed Inc
HEALTH SERVICES - Medical Appliances and Equipment
|
$230.21
|
-12.41
-5.11% |
$240.18
|
871,441
95.94% of 50 DAV
50 DAV is 908,300
|
$260.49
-11.62%
|
10/25/2024
|
$256.64
|
PP = $255.28
|
|
MB = $268.04
|
Most Recent Note - 12/18/2024 9:43:24 PM
G - Closed near the session low as it slumped further below its 50 DMA line ($242.68) with today's damaging loss undercutting the prior low. Its Relative Strength Rating has slumped to 75, below the 80+ minimum guideline for buy candidates, raising concerns.
>>> FEATURED STOCK ARTICLE : Recent Slump Below 50-Day Moving Average Raised Concerns - 11/18/2024 |
View all notes |
Set NEW NOTE alert |
Company Profile |
SEC
News |
Chart |
Request a new note
C
A
S
I |
ATGE
-
NYSE
Adtalem Global Education
Consumer Svcs-Education
|
$85.98
|
-4.26
-4.72% |
$90.81
|
482,386
136.65% of 50 DAV
50 DAV is 353,000
|
$92.93
-7.48%
|
10/30/2024
|
$83.34
|
PP = $80.28
|
|
MB = $84.29
|
Most Recent Note - 12/16/2024 12:44:56 PM
G - Consolidating in an orderly fashion near its all-time high. Its 50 DMA line ($83.20) defines initial support above prior highs in the $80 area. Fundamentals remain strong.
>>> FEATURED STOCK ARTICLE : Hovering Near High With Volume Totals Cooling - 12/4/2024 |
View all notes |
Set NEW NOTE alert |
Company Profile |
SEC
News |
Chart |
Request a new note
C
A
S
I |
TW
-
NASDAQ
Tradeweb Markets
Financial Svcs-Specialty
|
$130.44
|
-2.85
-2.14% |
$134.00
|
983,363
112.77% of 50 DAV
50 DAV is 872,000
|
$141.69
-7.94%
|
11/19/2024
|
$134.41
|
PP = $136.23
|
|
MB = $143.04
|
Most Recent Note - 12/17/2024 3:07:38 PM
Y - Consolidating above its 50 DMA line ($132) after encountering distributional pressure. Since recently featured it has not produced a volume-driven gain above the pivot point to trigger a proper technical buy signal. It was highlighted in yellow with pivot point cited based on its 10/15/24 high plus 10 cents.
>>> FEATURED STOCK ARTICLE : Tradeweb Markets Perched Near High - 11/19/2024 |
View all notes |
Set NEW NOTE alert |
Company Profile |
SEC
News |
Chart |
Request a new note
C
A
S
I |
Symbol/Exchange
Company Name
Industry Group |
PRICE |
CHANGE
(%Change) |
Day High |
Volume
(% DAV)
(% 50 day avg vol) |
52 Wk Hi
% From Hi |
Featured
Date |
Price
Featured |
Pivot Featured |
|
Max Buy |
ATAT
-
NASDAQ
Atour Lifestyle Hldgs ADR
Leisure-Lodging
|
$27.31
|
-0.90
-3.19% |
$28.78
|
911,340
70.70% of 50 DAV
50 DAV is 1,289,000
|
$29.90
-8.66%
|
12/9/2024
|
$29.34
|
PP = $29.25
|
|
MB = $30.71
|
Most Recent Note - 12/17/2024 12:11:57 PM
Y - Rallying near prior highs with today's big gain backed by higher volume. Found support near its 50 DMA line ($26.66). A violation would trigger a technical sell signal.
>>> FEATURED STOCK ARTICLE : Volume Above Average Behind Breakout Gain - 12/9/2024 |
View all notes |
Set NEW NOTE alert |
Company Profile |
SEC
News |
Chart |
Request a new note
C
A
S
I |
VEEV
-
NYSE
Veeva Systems Inc Cl A
Computer Sftwr-Medical
|
$221.54
|
-4.87
-2.15% |
$229.14
|
1,063,115
96.39% of 50 DAV
50 DAV is 1,102,900
|
$258.93
-14.44%
|
12/9/2024
|
$250.70
|
PP = $240.68
|
|
MB = $252.71
|
Most Recent Note - 12/16/2024 12:48:00 PM
Y - It has slumped back well into the prior base raising concerns following a noted 12/06/24 "breakaway gap". Reported Oct '24 quarterly earnings +31% on +13% sales revenues versus the year-ago period, its 3rd consecutive quarterly comparison above the +25% minimum earnings guideline (C criteria). Annual earnings growth has been strong.
>>> FEATURED STOCK ARTICLE : Veeva Systems Consolidating After "Breakaway Gap" - 12/10/2024 |
View all notes |
Set NEW NOTE alert |
Company Profile |
SEC
News |
Chart |
Request a new note
C
A
S
I |
CRAI
-
NASDAQ
CRA International
Comml Svcs-Consulting
|
$188.57
|
-17.98
-8.70% |
$206.67
|
44,726
124.24% of 50 DAV
50 DAV is 36,000
|
$210.70
-10.50%
|
12/17/2024
|
$208.34
|
PP = $208.48
|
|
MB = $218.90
|
Most Recent Note - 12/18/2024 9:35:53 PM
Y - Negated the prior breakout with a big loss today. Highlighted in yellow in the prior mid-day report with pivot point cited based on its 11/06/24 high plus 10 cents after a 6-week base. Reported Sep '24 quarterly earnings +57% on +14% sales revenues versus the year-ago period, its 3rd strong quarter above the +25% minimum earnings guideline (C criteria). Annual earnings (A criteria) growth has been strong and steady. See the latest FSU analysis for more details and an annotated graph.
>>> FEATURED STOCK ARTICLE : Volume-Driven Gain for New High Triggered Technical Buy Signal - 12/17/2024 |
View all notes |
Set NEW NOTE alert |
Company Profile |
SEC
News |
Chart |
Request a new note
C
A
S
I |
|
|
|
THESE ARE NOT BUY RECOMMENDATIONS!
Comments contained in the body of this report are technical
opinions only. The material herein has been obtained
from sources believed to be reliable and accurate, however,
its accuracy and completeness cannot be guaranteed.
This site is not an investment advisor, hence it does
not endorse or recommend any securities or other investments.
Any recommendation contained in this report may not
be suitable for all investors and it is not to be deemed
an offer or solicitation on our part with respect to
the purchase or sale of any securities. All trademarks,
service marks and trade names appearing in this report
are the property of their respective owners, and are
likewise used for identification purposes only.
This report is a service available
only to active Paid Premium Members.
You may opt-out of receiving report notifications
at any time. Questions or comments may be submitted
by writing to Premium Membership Services 665 S.E. 10 Street, Suite 201 Deerfield Beach, FL 33441-5634 or by calling 1-800-965-8307
or 954-785-1121.
|
|
|