You are not logged in.
This means you
CAN ONLY VIEW reports that were published prior to Wednesday, March 12, 2025.
You
MUST UPGRADE YOUR MEMBERSHIP if you want to see any current reports.
AFTER MARKET UPDATE - FRIDAY, DECEMBER 20TH, 2024
Previous After Market Report Next After Market Report >>>
|
|
|
|
DOW |
+498.02 |
42,840.26 |
+1.18% |
|
Volume |
3,855,751,700 |
+215% |
|
Volume |
11,711,123,100 |
+45% |
|
NASDAQ |
+199.83 |
19,572.60 |
+1.03% |
|
Advancers |
1,985 |
73% |
|
Advancers |
2,923 |
67% |
|
S&P 500 |
+63.77 |
5,930.85 |
+1.09% |
|
Decliners |
716 |
26% |
|
Decliners |
1,418 |
33% |
|
Russell 2000 |
+20.87 |
2,242.37 |
+0.94% |
|
52 Wk Highs |
27 |
|
|
52 Wk Highs |
74 |
|
|
S&P 600 |
+8.43 |
1,416.89 |
+0.60% |
|
52 Wk Lows |
171 |
|
|
52 Wk Lows |
262 |
|
|
 |
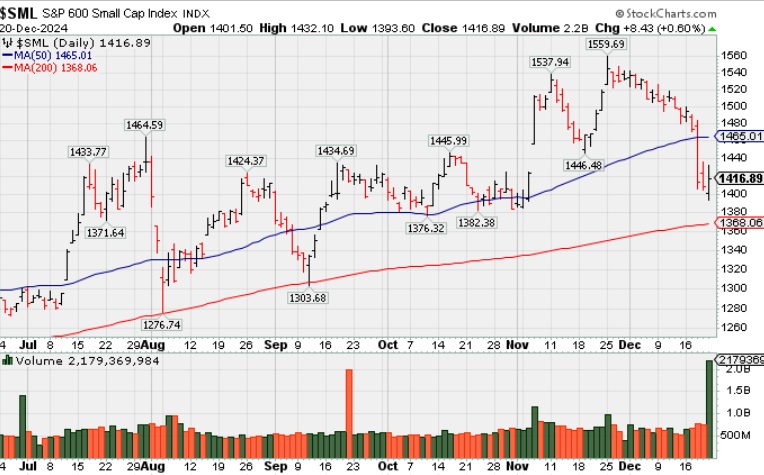
Major Indices Bounced Higher With Higher Volume
Kenneth J. Gruneisen - Passed the CAN SLIM® Master's Exam
The major indices all settled at least +1.0% higher on above-average volume on Friday. Quarterly options/futures expirations pushed volume totals higher than the prior session totals on the NYSE and on the Nasdaq exchange. Advancers led decliners by almost a 3-1 margin at the NYSE and by more than a 2-1 margin at the Nasdaq exchange. Leadership improved slightly as there were 5 high-ranked companies from the Leaders List that hit new 52-week highs and were listed on the BreakOuts Page, versus the total of 2 on the prior session. New 52-week lows outnumbered new 52-week highs on the NYSE and on the Nasdaq exchange. The major indices' uptrend has come under pressure (M criteria). Disciplined investors know that new buying efforts are only to be made in stocks meeting all key criteria of the fact-based investment system.
PICTURED: The S&P 600 Small Cap Index halted its slide after recently slumping below its 50-day moving average (DMA) line while retreating from its all-time high.
Positive price action was fueled by a drop in market rates, along with comments from Chicago Fed President Goolsbee (2025 FOMC voter) indicating he thinks rates "will come down a fair bit more." The 10-yr yield, which was as low as 4.48% earlier, settled five basis points lower than yesterday at 4.52%. The 2-yr yield dropped one basis point today to 4.31%.
Bonds and equities responded favorably to the release of the Personal Income and Spending Report for November. This morning's inflation readings didn't show any improvement, but importantly, the data was better than some had feared. The PCE Price Index rose to 2.4% on a year-over-year basis versus 2.3% in October, and core PCE was 2.8%, which was unchanged from October. Consensus estimates however, pegged them coming in at 2.5% and 2.9%, respectively.
Just about everything participated in upside moves in the stock market. All 11 S&P 500 sectors logged gains. Seven of the sectors climbed more than 1.0%, led by real estate (+1.8%), utilities (+1.5%), information technology (+1.5%), and financials (+1.4%).
23 of the 30 Dow components closed in the green led by NVIDIA (NVDA 134.70, +4.02, +3.1%) and UnitedHealth (UNH 500.13, +10.88, +2.2%). NIKE (NKE 76.94, -0.16, -0.2%) is among the DJIA component that closed lower after disappointing with its fiscal Q3 revenue guidance.
|
 Kenneth J. Gruneisen started out as a licensed stockbroker in August 1987, a couple of months prior to the historic stock market crash that took the Dow Jones Industrial Average down -22.6% in a single day. He has published daily fact-based fundamental and technical analysis on high-ranked stocks online for two decades. Through FACTBASEDINVESTING.COM, Kenneth provides educational articles, news, market commentary, and other information regarding proven investment systems that work in good times and bad.
Comments contained in the body of this report are technical opinions only and are not necessarily those of Gruneisen Growth Corp. The material herein has been obtained from sources believed to be reliable and accurate, however, its accuracy and completeness cannot be guaranteed. Our firm, employees, and customers may effect transactions, including transactions contrary to any recommendation herein, or have positions in the securities mentioned herein or options with respect thereto. Any recommendation contained in this report may not be suitable for all investors and it is not to be deemed an offer or solicitation on our part with respect to the purchase or sale of any securities. |
|
 |
Gains in Financial and Tech Indexes Led Rebound
Kenneth J. Gruneisen - Passed the CAN SLIM® Master's Exam
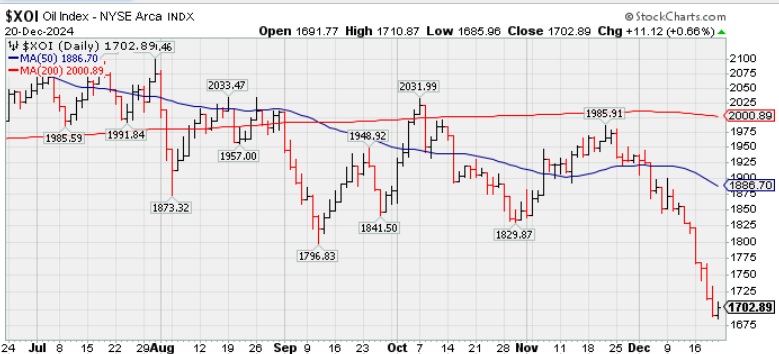
The Broker/Dealer Index ($XBD +1.50%) and the Bank Index ($BKX +2.01%) both posted influential gains as they outpaced the Retail Index ($RLX +0.94%) on Friday. The tech sector had a positive bias as the Semiconductor Index ($SOX +1.46%) outpaced the Networking Index ($NWX +1.23%) and the Biotech Index ($BTK +0.70%). The Gold & Silver Index ($XAU +1.30%) and the Integrated Oil Index ($XOI +0.66%) while the Oil Services Index ($OSX -0.34%) finished the session modestly lower.
PICTURED: The Integrated Oil Index ($XOI +0.66%) halted its slide after recently slumping to new 2024 lows well below its September low.
| Oil Services |
$OSX |
68.88 |
-0.23 |
-0.34% |
-17.89% |
| Integrated Oil |
$XOI |
1,702.89 |
+11.12 |
+0.66% |
-8.57% |
| Semiconductor |
$SOX |
4,964.91 |
+71.44 |
+1.46% |
+18.91% |
| Networking |
$NWX |
1,267.68 |
+15.43 |
+1.23% |
+52.22% |
| Broker/Dealer |
$XBD |
799.88 |
+11.83 |
+1.50% |
+43.53% |
| Retail Index |
$RLX |
5,248.90 |
+49.09 |
+0.94% |
+34.98% |
| Gold & Silver |
$XAU |
139.22 |
+1.79 |
+1.30% |
+10.77% |
| Bank |
$BKX |
127.21 |
+2.50 |
+2.01% |
+32.48% |
| Biotech |
$BTK |
5,728.01 |
+39.75 |
+0.70% |
+5.71% |
|
|
|
 |
Featured Stocks
Kenneth J. Gruneisen - Passed the CAN SLIM® Master's Exam
|
|
|
Color Codes Explained :
Y - Better candidates highlighted by our
staff of experts.
G - Previously featured
in past reports as yellow but may no longer be buyable under the
guidelines.
***Last / Change / Volume data in this table is the closing quote data***
Symbol/Exchange
Company Name
Industry Group |
PRICE |
CHANGE
(%Change) |
Day High |
Volume
(% DAV)
(% 50 day avg vol) |
52 Wk Hi
% From Hi |
Featured
Date |
Price
Featured |
Pivot Featured |
|
Max Buy |
 USLM
-
NASDAQ
USLM
-
NASDAQ
U.S. Lime & Minerals
Bldg-Cement/Concrt/Ag
|
$132.95
|
-0.79
-0.59% |
$135.27
|
265,157
265.16% of 50 DAV
50 DAV is 100,000
|
$159.53
-16.66%
|
9/17/2024
|
$71.26
|
PP = $87.23
|
|
MB = $91.59
|
Most Recent Note - 12/18/2024 9:45:32 PM
G - Fell today for a 4th consecutive loss with average volume. Slumped near its 50 DMA line ($129.50) which defines important near-term support to watch.
>>> FEATURED STOCK ARTICLE : Extended From Any Sound Base After Impressive Rally - 11/12/2024 |
View all notes |
Set NEW NOTE alert |
Company Profile |
SEC
News |
Chart |
Request a new note
C
A
S
I |
GVA
-
NYSE
Granite Construction
Bldg-Heavy Construction
|
$90.67
|
+0.67
0.74% |
$92.52
|
2,300,697
340.84% of 50 DAV
50 DAV is 675,000
|
$105.20
-13.81%
|
6/11/2024
|
$59.76
|
PP = $64.33
|
|
MB = $67.55
|
Most Recent Note - 12/17/2024 2:02:05 PM
G - Testing its 50 DMA line ($91.17) today wit its 8th loss in the span of 9 sessions after a "negative reversal" at its all-time high. More damaging losses may trigger a technical sell signal. Reported Sep '24 quarterly earnings +19% on +14% sales revenues versus the year-ago period, repeatedly noted as "below the +25% minimum guideline (C criteria) of the fact-based investment system."
>>> FEATURED STOCK ARTICLE : Negative Reversal After Hitting New All-Time High - 12/6/2024 |
View all notes |
Set NEW NOTE alert |
Company Profile |
SEC
News |
Chart |
Request a new note
C
A
S
I |
TXRH
-
NASDAQ
Texas Roadhouse
Retail-Restaurants
|
$181.38
|
-1.48
-0.81% |
$184.65
|
1,528,682
215.92% of 50 DAV
50 DAV is 708,000
|
$206.04
-11.97%
|
7/26/2024
|
$173.08
|
PP = $175.82
|
|
MB = $184.61
|
Most Recent Note - 12/17/2024 3:08:24 PM
G - Quietly slumped below its 50 DMA line ($190) raising concerns with recent losses backed by light volume. A prompt rebound above the 50 DMA line is needed for its outlook to improve.
>>> FEATURED STOCK ARTICLE : Hovering Near High After Recent Volume-driven Gains - 11/15/2024 |
View all notes |
Set NEW NOTE alert |
Company Profile |
SEC
News |
Chart |
Request a new note
C
A
S
I |
HWM
-
NYSE
Howmet Aerospace
Aerospace/Defense
|
$110.83
|
+1.48
1.35% |
$111.39
|
5,806,215
244.88% of 50 DAV
50 DAV is 2,371,000
|
$120.71
-8.18%
|
7/30/2024
|
$93.95
|
PP = $85.52
|
|
MB = $89.80
|
Most Recent Note - 12/17/2024 1:57:05 PM
G - Pulling back today for a 4th consecutive loss with lighter volume. Its 50 DMA line ($110.14) and prior high ($106.93 on 10/21/24) define near-term support levels to watch. Fundamentals remain strong.
>>> FEATURED STOCK ARTICLE : Extended From Prior Base and Perched at High - 12/5/2024 |
View all notes |
Set NEW NOTE alert |
Company Profile |
SEC
News |
Chart |
Request a new note
C
A
S
I |
NGVC
-
NYSE
Natural Grocers
Retail-Super/Mini Mkts
|
$39.20
|
+0.04
0.10% |
$39.91
|
179,599
169.43% of 50 DAV
50 DAV is 106,000
|
$47.57
-17.60%
|
11/5/2024
|
$30.57
|
PP = $30.42
|
|
MB = $31.94
|
Most Recent Note - 12/18/2024 9:39:49 PM
G - Pulled back for a 5th consecutive loss, retreating from its all-time high after getting very extended from any sound base. Reported Sep '24 quarterly earnings +50% on +9% sales revenues versus the year-ago period. Its 50 DMA line ($34.77) defines near-term support above prior highs in the $30 area.
>>> FEATURED STOCK ARTICLE : Consolidating After Considerable Rally to New Highs - 12/16/2024 |
View all notes |
Set NEW NOTE alert |
Company Profile |
SEC
News |
Chart |
Request a new note
C
A
S
I |
Symbol/Exchange
Company Name
Industry Group |
PRICE |
CHANGE
(%Change) |
Day High |
Volume
(% DAV)
(% 50 day avg vol) |
52 Wk Hi
% From Hi |
Featured
Date |
Price
Featured |
Pivot Featured |
|
Max Buy |
CLS
-
NYSE
Celestica
Elec-Contract Mfg
|
$95.45
|
+2.40
2.58% |
$98.05
|
2,058,954
81.35% of 50 DAV
50 DAV is 2,531,000
|
$100.51
-5.03%
|
10/11/2024
|
$57.62
|
PP = $63.59
|
|
MB = $66.77
|
Most Recent Note - 12/18/2024 9:38:39 PM
G - Suffered a big loss today with higher (near average) volume while retreating from its all-time high. It is very extended from any sound base. Its 50 DMA line ($79) defines initial support to watch on pullbacks.
>>> FEATURED STOCK ARTICLE : Pulling Back After Considerable Rally - 11/13/2024 |
View all notes |
Set NEW NOTE alert |
Company Profile |
SEC
News |
Chart |
Request a new note
C
A
S
I |
PAY
-
NYSE
Paymentus Holdings
Finance-CrdtCard/PmtPr
|
$34.20
|
+1.25
3.79% |
$34.39
|
1,268,322
292.24% of 50 DAV
50 DAV is 434,000
|
$38.94
-12.17%
|
10/17/2024
|
$26.15
|
PP = $25.31
|
|
MB = $26.58
|
 Most Recent Note - 12/20/2024 12:19:44 PM
G - Consolidating after losses with above average volume, still perched well above its 50 DMA line ($30.73) which defines important near-term support to watch. It is extended from any sound base.
>>> FEATURED STOCK ARTICLE : Extended From Prior Base After Considerable Spike Higher - 11/14/2024 |
View all notes |
Set NEW NOTE alert |
Company Profile |
SEC
News |
Chart |
Request a new note
C
A
S
I |
RMD
-
NYSE
Resmed Inc
HEALTH SERVICES - Medical Appliances and Equipment
|
$237.27
|
+5.69
2.46% |
$238.60
|
3,057,163
336.77% of 50 DAV
50 DAV is 907,800
|
$260.49
-8.91%
|
10/25/2024
|
$256.64
|
PP = $255.28
|
|
MB = $268.04
|
Most Recent Note - 12/18/2024 9:43:24 PM
G - Closed near the session low as it slumped further below its 50 DMA line ($242.68) with today's damaging loss undercutting the prior low. Its Relative Strength Rating has slumped to 75, below the 80+ minimum guideline for buy candidates, raising concerns.
>>> FEATURED STOCK ARTICLE : Recent Slump Below 50-Day Moving Average Raised Concerns - 11/18/2024 |
View all notes |
Set NEW NOTE alert |
Company Profile |
SEC
News |
Chart |
Request a new note
C
A
S
I |
ATGE
-
NYSE
Adtalem Global Education
Consumer Svcs-Education
|
$87.28
|
-1.13
-1.28% |
$88.94
|
2,115,564
579.61% of 50 DAV
50 DAV is 365,000
|
$92.93
-6.08%
|
10/30/2024
|
$83.34
|
PP = $80.28
|
|
MB = $84.29
|
Most Recent Note - 12/20/2024 12:01:55 PM
G - Posted a solid gain on the prior session with above average volume. Consolidating in an orderly fashion above its 50 DMA line ($84.45) which defines initial support above prior highs in the $80 area. Fundamentals remain strong.
>>> FEATURED STOCK ARTICLE : Hovering Near High With Volume Totals Cooling - 12/4/2024 |
View all notes |
Set NEW NOTE alert |
Company Profile |
SEC
News |
Chart |
Request a new note
C
A
S
I |
TW
-
NASDAQ
Tradeweb Markets
Financial Svcs-Specialty
|
$132.73
|
+2.40
1.84% |
$134.24
|
1,319,227
150.77% of 50 DAV
50 DAV is 875,000
|
$141.69
-6.32%
|
11/19/2024
|
$134.41
|
PP = $136.23
|
|
MB = $143.04
|
Most Recent Note - 12/17/2024 3:07:38 PM
Y - Consolidating above its 50 DMA line ($132) after encountering distributional pressure. Since recently featured it has not produced a volume-driven gain above the pivot point to trigger a proper technical buy signal. It was highlighted in yellow with pivot point cited based on its 10/15/24 high plus 10 cents.
>>> FEATURED STOCK ARTICLE : Tradeweb Markets Perched Near High - 11/19/2024 |
View all notes |
Set NEW NOTE alert |
Company Profile |
SEC
News |
Chart |
Request a new note
C
A
S
I |
Symbol/Exchange
Company Name
Industry Group |
PRICE |
CHANGE
(%Change) |
Day High |
Volume
(% DAV)
(% 50 day avg vol) |
52 Wk Hi
% From Hi |
Featured
Date |
Price
Featured |
Pivot Featured |
|
Max Buy |
ATAT
-
NASDAQ
Atour Lifestyle Hldgs ADR
Leisure-Lodging
|
$27.99
|
+0.67
2.45% |
$28.14
|
837,982
65.98% of 50 DAV
50 DAV is 1,270,000
|
$29.90
-6.39%
|
12/9/2024
|
$29.34
|
PP = $29.25
|
|
MB = $30.71
|
Most Recent Note - 12/17/2024 12:11:57 PM
Y - Rallying near prior highs with today's big gain backed by higher volume. Found support near its 50 DMA line ($26.66). A violation would trigger a technical sell signal.
>>> FEATURED STOCK ARTICLE : Volume Above Average Behind Breakout Gain - 12/9/2024 |
View all notes |
Set NEW NOTE alert |
Company Profile |
SEC
News |
Chart |
Request a new note
C
A
S
I |
VEEV
-
NYSE
Veeva Systems Inc Cl A
Computer Sftwr-Medical
|
$224.15
|
+4.48
2.04% |
$227.10
|
2,374,290
211.57% of 50 DAV
50 DAV is 1,122,200
|
$258.93
-13.43%
|
12/9/2024
|
$250.70
|
PP = $240.68
|
|
MB = $252.71
|
Most Recent Note - 12/20/2024 12:51:32 PM
Y - Finding prompt support today after pulling back to its 50 DMA line ($222.73). More damaging losses would. raise serious concerns. Slumped considerably following a noted 12/06/24 "breakaway gap". Reported Oct '24 quarterly earnings +31% on +13% sales revenues versus the year-ago period, its 3rd consecutive quarterly comparison above the +25% minimum earnings guideline (C criteria). Annual earnings growth has been strong.
>>> FEATURED STOCK ARTICLE : Veeva Systems Consolidating After "Breakaway Gap" - 12/10/2024 |
View all notes |
Set NEW NOTE alert |
Company Profile |
SEC
News |
Chart |
Request a new note
C
A
S
I |
CRAI
-
NASDAQ
CRA International
Comml Svcs-Consulting
|
$184.55
|
-5.41
-2.85% |
$189.20
|
60,907
169.19% of 50 DAV
50 DAV is 36,000
|
$210.70
-12.41%
|
12/17/2024
|
$208.34
|
PP = $208.48
|
|
MB = $218.90
|
Most Recent Note - 12/18/2024 9:35:53 PM
Y - Negated the prior breakout with a big loss today. Highlighted in yellow in the prior mid-day report with pivot point cited based on its 11/06/24 high plus 10 cents after a 6-week base. Reported Sep '24 quarterly earnings +57% on +14% sales revenues versus the year-ago period, its 3rd strong quarter above the +25% minimum earnings guideline (C criteria). Annual earnings (A criteria) growth has been strong and steady. See the latest FSU analysis for more details and an annotated graph.
>>> FEATURED STOCK ARTICLE : Volume-Driven Gain for New High Triggered Technical Buy Signal - 12/17/2024 |
View all notes |
Set NEW NOTE alert |
Company Profile |
SEC
News |
Chart |
Request a new note
C
A
S
I |
|
|
|
THESE ARE NOT BUY RECOMMENDATIONS!
Comments contained in the body of this report are technical
opinions only. The material herein has been obtained
from sources believed to be reliable and accurate, however,
its accuracy and completeness cannot be guaranteed.
This site is not an investment advisor, hence it does
not endorse or recommend any securities or other investments.
Any recommendation contained in this report may not
be suitable for all investors and it is not to be deemed
an offer or solicitation on our part with respect to
the purchase or sale of any securities. All trademarks,
service marks and trade names appearing in this report
are the property of their respective owners, and are
likewise used for identification purposes only.
This report is a service available
only to active Paid Premium Members.
You may opt-out of receiving report notifications
at any time. Questions or comments may be submitted
by writing to Premium Membership Services 665 S.E. 10 Street, Suite 201 Deerfield Beach, FL 33441-5634 or by calling 1-800-965-8307
or 954-785-1121.
|
|
|