You are not logged in.
This means you
CAN ONLY VIEW reports that were published prior to Monday, April 21, 2025.
You
MUST UPGRADE YOUR MEMBERSHIP if you want to see any current reports.
AFTER MARKET UPDATE - TUESDAY, DECEMBER 10TH, 2024
Previous After Market Report Next After Market Report >>>
|
|
|
|
DOW |
-154.10 |
44,247.83 |
-0.35% |
|
Volume |
972,986,161 |
-8% |
|
Volume |
6,893,693,800 |
-14% |
|
NASDAQ |
-49.45 |
19,687.24 |
-0.25% |
|
Advancers |
1,043 |
38% |
|
Advancers |
1,658 |
39% |
|
S&P 500 |
-17.94 |
6,034.91 |
-0.30% |
|
Decliners |
1,678 |
62% |
|
Decliners |
2,606 |
61% |
|
Russell 2000 |
-10.06 |
2,382.77 |
-0.42% |
|
52 Wk Highs |
63 |
|
|
52 Wk Highs |
129 |
|
|
S&P 600 |
-4.78 |
1,502.18 |
-0.32% |
|
52 Wk Lows |
29 |
|
|
52 Wk Lows |
96 |
|
|
 |
Major Indices Fell With Less Leadership and Higher Volume Totals
Kenneth J. Gruneisen - Passed the CAN SLIM® Master's Exam
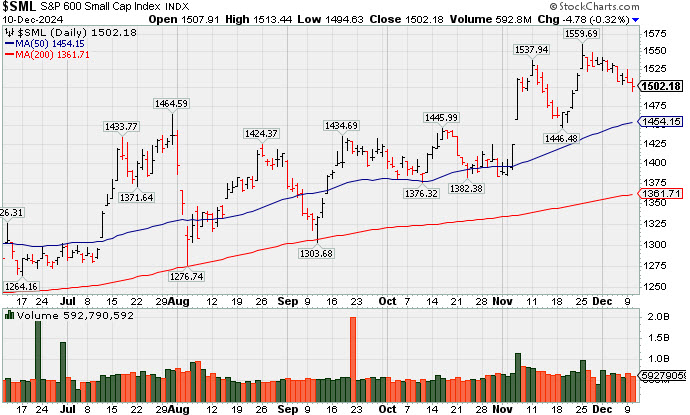
The S&P 500 (-0.3%), Nasdaq Composite (-0.3%), and Dow Jones Industrial Average (-0.4%) each lost ground and settled near their session lows. Volume totals were lighter than the prior session totals on the NYSE and on the Nasdaq exchange. Breadth was negative as decliners led advancers by a 3-2 margin at the NYSE and by a 5-3 margin at the Nasdaq exchange. There were 17 high-ranked companies from the Leaders List that hit new 52-week highs and were listed on the BreakOuts Page, versus the total of 38 on the prior session. New 52-week highs totals contracted yet still outnumbered new 52-week lows on the NYSE and on the Nasdaq exchange. The major indices are in a confirmed uptrend (M criteria). Disciplined investors know that new buying efforts are only to be made in stocks meeting all key criteria of the fact-based investment system.
PICTURED: The S&P 600 Index is consolidating near its all-time high.
Oracle (ORCL -6.7%) declined considerably after a disappointing fiscal Q2 earnings report and lower-than-expected guidance for fiscal Q3. NVIDIA (NVDA -2.7%) also had a negative influence on the indices. Alaska Air (ALK +13.2%) surged after fiscal year 2025 EPS guidance that exceeded expectations. Alphabet (GOOG +5.3%) rose after unveiling its new Willow quantum computing chip. Kroger (KR +5.1%) was another big gainer after its M&A deal with Albertson's (ACI -2.3%) was blocked by a judge.
The 10-yr yield settled two basis points higher at 4.22% and the 2-yr yield settled two basis points higher at 4.15%. Wednesday’s release of the November Consumer Price Index at 8:30 ET may trigger more decisive market action. |
 Kenneth J. Gruneisen started out as a licensed stockbroker in August 1987, a couple of months prior to the historic stock market crash that took the Dow Jones Industrial Average down -22.6% in a single day. He has published daily fact-based fundamental and technical analysis on high-ranked stocks online for two decades. Through FACTBASEDINVESTING.COM, Kenneth provides educational articles, news, market commentary, and other information regarding proven investment systems that work in good times and bad.
Comments contained in the body of this report are technical opinions only and are not necessarily those of Gruneisen Growth Corp. The material herein has been obtained from sources believed to be reliable and accurate, however, its accuracy and completeness cannot be guaranteed. Our firm, employees, and customers may effect transactions, including transactions contrary to any recommendation herein, or have positions in the securities mentioned herein or options with respect thereto. Any recommendation contained in this report may not be suitable for all investors and it is not to be deemed an offer or solicitation on our part with respect to the purchase or sale of any securities. |
|
 |
Widespread Weakness Slightly Weighed on All Groups
Kenneth J. Gruneisen - Passed the CAN SLIM® Master's Exam
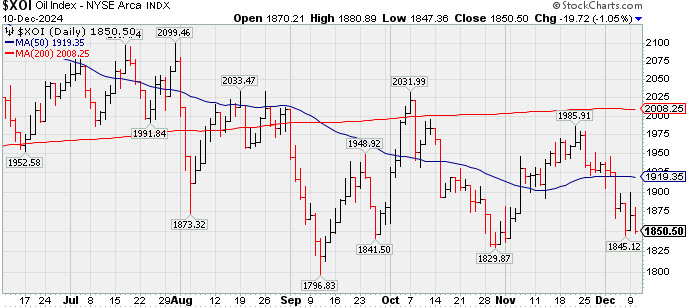
The Bank Index ($BKX -0.40%) and the Broker/Dealer Index ($XBD -0.95%) both suffered losses and the Retail Index ($RLX -0.57%) also created a drag on the major indices. The tech sector had a negative bias as the Semiconductor Index ($SOX -2.47%) and the Biotech Index ($BTK -1.18%) both outpaced the Networking Index ($NWX -0.18%) to the downside. Commodity-linked groups had a slightly negative bias as the Oil Services Index ($OSX -0.15%) and the Gold & Silver Index ($XAU -0.20%) ended slightly lower.
PICTURED: The Integrated Oil Index ($XOI -1.05%) fell, slumping further below its 50-day moving average toward its 2024 lows.
| Oil Services |
$OSX |
75.67 |
-0.11 |
-0.15% |
-9.78% |
| Integrated Oil |
$XOI |
1,850.50 |
-19.72 |
-1.05% |
-0.64% |
| Semiconductor |
$SOX |
4,894.70 |
-124.14 |
-2.47% |
+17.23% |
| Networking |
$NWX |
1,219.89 |
-2.22 |
-0.18% |
+46.48% |
| Broker/Dealer |
$XBD |
826.06 |
-7.92 |
-0.95% |
+48.23% |
| Retail Index |
$RLX |
5,349.39 |
-30.77 |
-0.57% |
+37.56% |
| Gold & Silver |
$XAU |
151.99 |
-0.30 |
-0.20% |
+20.92% |
| Bank |
$BKX |
133.18 |
-0.54 |
-0.40% |
+38.70% |
| Biotech |
$BTK |
5,999.30 |
-71.91 |
-1.18% |
+10.71% |
|
|
|
 |
Veeva Systems Consolidating After "Breakaway Gap"
Kenneth J. Gruneisen - Passed the CAN SLIM® Master's Exam
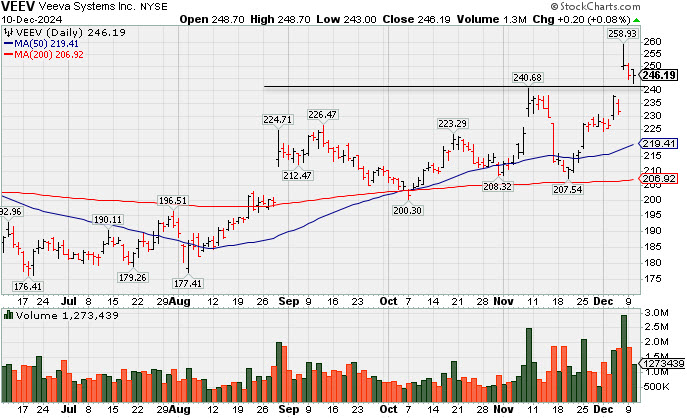
Veeva Systems Inc Cl A (VEEV +$0.20 or +0.08% to $246.19) was highlighted in yellow with new pivot point cited based on its 9/02/20 high plus 10 cents in the 12/09/24 mid-day report (read here). It is consolidating following a "breakaway gap" up on 12/06/24 for a new 52-week high as it triggered a technical buy signal.
Veeva reported Oct '24 quarterly earnings +31% on +13% sales revenues versus the year-ago period, its 3rd consecutive quarterly comparison above the +25% minimum earnings guideline (C criteria). It has a 98 Earnings Per Share (EPS) rank. Its annual earnings (A criteria) history has been strong. However, it has a 78 Relative Strength (RS) rating, slightly below the 80+ minimum guideline for buy candidates.
There are 161.9 million shares (S criteria) outstanding. The number of top-rated funds owning its shares rose from 1,917 in Dec '23 to 2,024 in Sep '24, a reassuring sign concerning the I criteria. Its current Up/Down Volume Ratio of 1.1 is an unbiased indication its shares have been under slight accumulation over the past 50 days.
|
|
|
Color Codes Explained :
Y - Better candidates highlighted by our
staff of experts.
G - Previously featured
in past reports as yellow but may no longer be buyable under the
guidelines.
***Last / Change / Volume data in this table is the closing quote data***
Symbol/Exchange
Company Name
Industry Group |
PRICE |
CHANGE
(%Change) |
Day High |
Volume
(% DAV)
(% 50 day avg vol) |
52 Wk Hi
% From Hi |
Featured
Date |
Price
Featured |
Pivot Featured |
|
Max Buy |
 USLM
-
NASDAQ
USLM
-
NASDAQ
U.S. Lime & Minerals
Bldg-Cement/Concrt/Ag
|
$143.62
|
-1.42
-0.98% |
$146.37
|
111,508
121.20% of 50 DAV
50 DAV is 92,000
|
$159.53
-9.97%
|
9/17/2024
|
$71.26
|
PP = $87.23
|
|
MB = $91.59
|
Most Recent Note - 12/9/2024 1:16:07 PM
G - Pulling back from its all-time high with today's 4th loss in the span of 5 sessions backed by above-average volume. Its 50 DMA line ($122.62) defines important near-term support to watch on pullbacks. It has been noted repeatedly as - "Very extended from any sound base".
>>> FEATURED STOCK ARTICLE : Extended From Any Sound Base After Impressive Rally - 11/12/2024 |
View all notes |
Set NEW NOTE alert |
Company Profile |
SEC
News |
Chart |
Request a new note
C
A
S
I |
GVA
-
NYSE
Granite Construction
Bldg-Heavy Construction
|
$95.70
|
-0.39
-0.41% |
$96.97
|
792,303
125.36% of 50 DAV
50 DAV is 632,000
|
$105.20
-9.03%
|
6/11/2024
|
$59.76
|
PP = $64.33
|
|
MB = $67.55
|
Most Recent Note - 12/6/2024 8:14:40 PM
G - There was a "negative reversal" on the prior session after hitting a new all-time high. Reported Sep '24 quarterly earnings +19% on +14% sales revenues versus the year-ago period, repeatedly noted as "below the +25% minimum guideline (C criteria) of the fact-based investment system." See the latest FSV analysis for more details and a new annotated graph.
>>> FEATURED STOCK ARTICLE : Negative Reversal After Hitting New All-Time High - 12/6/2024 |
View all notes |
Set NEW NOTE alert |
Company Profile |
SEC
News |
Chart |
Request a new note
C
A
S
I |
TXRH
-
NASDAQ
Texas Roadhouse
Retail-Restaurants
|
$193.20
|
+1.39
0.72% |
$194.62
|
588,778
83.99% of 50 DAV
50 DAV is 701,000
|
$206.04
-6.23%
|
7/26/2024
|
$173.08
|
PP = $175.82
|
|
MB = $184.61
|
Most Recent Note - 12/6/2024 2:52:12 PM
G - Perched near its all-time high, still consolidating well above its 50 DMA line ($188.74) which defines important support to watch on pullbacks.
>>> FEATURED STOCK ARTICLE : Hovering Near High After Recent Volume-driven Gains - 11/15/2024 |
View all notes |
Set NEW NOTE alert |
Company Profile |
SEC
News |
Chart |
Request a new note
C
A
S
I |
HWM
-
NYSE
Howmet Aerospace
Aerospace/Defense
|
$114.08
|
+0.33
0.29% |
$115.26
|
1,750,615
75.78% of 50 DAV
50 DAV is 2,310,000
|
$120.71
-5.49%
|
7/30/2024
|
$93.95
|
PP = $85.52
|
|
MB = $89.80
|
Most Recent Note - 12/5/2024 5:20:31 PM
G - Perched at its all-time high, extended from any sound base. Its prior high ($106.93 on 10/21/24) and 50 DMA line ($108) define near-term support levels to watch on pullbacks. Fundamentals remain strong. See the latest FSU analysis for more details and a new annotated graph.
>>> FEATURED STOCK ARTICLE : Extended From Prior Base and Perched at High - 12/5/2024 |
View all notes |
Set NEW NOTE alert |
Company Profile |
SEC
News |
Chart |
Request a new note
C
A
S
I |
NGVC
-
NYSE
Natural Grocers
Retail-Super/Mini Mkts
|
$43.26
|
+1.06
2.51% |
$44.05
|
115,598
110.09% of 50 DAV
50 DAV is 105,000
|
$47.57
-9.06%
|
11/5/2024
|
$30.57
|
PP = $30.42
|
|
MB = $31.94
|
Most Recent Note - 12/5/2024 5:21:07 PM
G - Pulled back further from its all-time high with today's loss backed by average volume. Reported Sep '24 quarterly earnings +50% on +9% sales revenues versus the year-ago period. Prior high in the $30 area defines initial support to watch above its 50 DMA line.
>>> FEATURED STOCK ARTICLE : New High After 6th Consecutive Gain - 11/11/2024 |
View all notes |
Set NEW NOTE alert |
Company Profile |
SEC
News |
Chart |
Request a new note
C
A
S
I |
Symbol/Exchange
Company Name
Industry Group |
PRICE |
CHANGE
(%Change) |
Day High |
Volume
(% DAV)
(% 50 day avg vol) |
52 Wk Hi
% From Hi |
Featured
Date |
Price
Featured |
Pivot Featured |
|
Max Buy |
CLS
-
NYSE
Celestica
Elec-Contract Mfg
|
$88.00
|
-2.42
-2.68% |
$92.52
|
1,582,842
64.26% of 50 DAV
50 DAV is 2,463,000
|
$96.00
-8.33%
|
10/11/2024
|
$57.62
|
PP = $63.59
|
|
MB = $66.77
|
Most Recent Note - 12/6/2024 2:58:57 PM
G - Hitting a new all-time high while posting a 4th consecutive gain today with below-average volume. It is very extended from any sound base. Its 50 DMA line ($72) defines initial support above prior highs in the $63 area.
>>> FEATURED STOCK ARTICLE : Pulling Back After Considerable Rally - 11/13/2024 |
View all notes |
Set NEW NOTE alert |
Company Profile |
SEC
News |
Chart |
Request a new note
C
A
S
I |
PAY
-
NYSE
Paymentus Holdings
Finance-CrdtCard/PmtPr
|
$32.12
|
-1.47
-4.38% |
$33.82
|
768,057
200.01% of 50 DAV
50 DAV is 384,000
|
$38.94
-17.51%
|
10/17/2024
|
$26.15
|
PP = $25.31
|
|
MB = $26.58
|
 Most Recent Note - 12/10/2024 4:54:51 PM
G - Pulled back with higher volume today for a big 6th consecutive loss. Its 50 DMA line ($28.54) defines important near-term support to watch. It has been repeatedly noted as "extended from any sound base." Bullish action came after it reported Sep '24 quarterly earnings +67% on +52% sales revenues versus the year-ago period.
>>> FEATURED STOCK ARTICLE : Extended From Prior Base After Considerable Spike Higher - 11/14/2024 |
View all notes |
Set NEW NOTE alert |
Company Profile |
SEC
News |
Chart |
Request a new note
C
A
S
I |
RMD
-
NYSE
Resmed Inc
HEALTH SERVICES - Medical Appliances and Equipment
|
$245.22
|
+0.46
0.19% |
$246.50
|
503,618
53.13% of 50 DAV
50 DAV is 947,900
|
$260.49
-5.86%
|
10/25/2024
|
$256.64
|
PP = $255.28
|
|
MB = $268.04
|
Most Recent Note - 12/5/2024 5:22:44 PM
G - Color code is changed to green after today's loss on below-average volume led to a close below its 50 DMA line ($242). A prompt rebound above the 50 DMA line is needed for its outlook to improve. Little resistance remains due to overhead supply.
>>> FEATURED STOCK ARTICLE : Recent Slump Below 50-Day Moving Average Raised Concerns - 11/18/2024 |
View all notes |
Set NEW NOTE alert |
Company Profile |
SEC
News |
Chart |
Request a new note
C
A
S
I |
ATGE
-
NYSE
Adtalem Global Education
Consumer Svcs-Education
|
$88.27
|
+0.35
0.40% |
$89.22
|
331,652
94.76% of 50 DAV
50 DAV is 350,000
|
$92.93
-5.01%
|
10/30/2024
|
$83.34
|
PP = $80.28
|
|
MB = $84.29
|
Most Recent Note - 12/9/2024 2:09:21 PM
G - Pulling back from its all-time high with light volume behind today's loss and on most down sessions in recent weeks. Its 50 DMA line ($81.70) defines initial support above prior highs in the $80 area. Fundamentals remain strong.
>>> FEATURED STOCK ARTICLE : Hovering Near High With Volume Totals Cooling - 12/4/2024 |
View all notes |
Set NEW NOTE alert |
Company Profile |
SEC
News |
Chart |
Request a new note
C
A
S
I |
TW
-
NASDAQ
Tradeweb Markets Cl A
Financial Svcs-Specialty
|
$127.87
|
+0.56
0.44% |
$128.95
|
993,541
115.21% of 50 DAV
50 DAV is 862,400
|
$141.69
-9.75%
|
11/19/2024
|
$134.41
|
PP = $136.23
|
|
MB = $143.04
|
Most Recent Note - 12/6/2024 2:55:55 PM
Y - Today's loss is testing support at its 50 DMA line ($131.49). Hit a new all-time high on the prior session but churned +67% above average volume and ended in the lower third of its intra-day range. Since recently featured it has not produced a volume-driven gain above the pivot point to trigger a proper technical buy signal. It was highlighted in yellow with pivot point cited based on its 10/15/24 high plus 10 cents.
>>> FEATURED STOCK ARTICLE : Tradeweb Markets Perched Near High - 11/19/2024 |
View all notes |
Set NEW NOTE alert |
Company Profile |
SEC
News |
Chart |
Request a new note
C
A
S
I |
Symbol/Exchange
Company Name
Industry Group |
PRICE |
CHANGE
(%Change) |
Day High |
Volume
(% DAV)
(% 50 day avg vol) |
52 Wk Hi
% From Hi |
Featured
Date |
Price
Featured |
Pivot Featured |
|
Max Buy |
ATAT
-
NASDAQ
Atour Lifestyle Hldgs ADR
Leisure-Lodging
|
$27.32
|
-2.13
-7.23% |
$28.72
|
1,597,357
118.59% of 50 DAV
50 DAV is 1,347,000
|
$29.90
-8.63%
|
12/9/2024
|
$29.34
|
PP = $29.25
|
|
MB = $30.71
|
Most Recent Note - 12/10/2024 4:54:13 PM
Y - Abruptly retreated today, promptly negating the prior breakout, raising concerns. Finished strong on the prior session after highlighted in yellow with pivot point based on its 10/07/24 high plus 10 cents. Hit a new all-time high with today's gap up and big volume-driven gain after consolidating near its 50 DMA line ($26.62). The strong close above its pivot point may clinched a proper technical buy signal. Through Sep '24 this China-based hotel operator's quarterly and annual earnings growth has been strong.
>>> FEATURED STOCK ARTICLE : Volume Above Average Behind Breakout Gain - 12/9/2024 |
View all notes |
Set NEW NOTE alert |
Company Profile |
SEC
News |
Chart |
Request a new note
C
A
S
I |
VEEV
-
NYSE
Veeva Systems Inc Cl A
Computer Sftwr-Medical
|
$246.19
|
+0.20
0.08% |
$248.70
|
1,273,757
127.67% of 50 DAV
50 DAV is 997,700
|
$258.93
-4.92%
|
12/9/2024
|
$250.70
|
PP = $240.68
|
|
MB = $252.71
|
Most Recent Note - 12/9/2024 1:24:01 PM
Y - Color code is changed to yellow with pivot point cited based on its 11/08/24 high Consolidating today following a "breakaway gap" up on the prior session for a new 52-week high as it triggered a technical buy signal. Reported Oct '24 quarterly earnings +31% on +13% sales revenues versus the year-ago period, its 3rd consecutive quarterly comparison above the +25% minimum earnings guideline (C criteria). Annual earnings growth has been strong. It was dropped from the Featured Stocks list on 12/09/20.
>>> FEATURED STOCK ARTICLE : Veeva Systems Consolidating After "Breakaway Gap" - 12/10/2024 |
View all notes |
Set NEW NOTE alert |
Company Profile |
SEC
News |
Chart |
Request a new note
C
A
S
I |
|
|
|
THESE ARE NOT BUY RECOMMENDATIONS!
Comments contained in the body of this report are technical
opinions only. The material herein has been obtained
from sources believed to be reliable and accurate, however,
its accuracy and completeness cannot be guaranteed.
This site is not an investment advisor, hence it does
not endorse or recommend any securities or other investments.
Any recommendation contained in this report may not
be suitable for all investors and it is not to be deemed
an offer or solicitation on our part with respect to
the purchase or sale of any securities. All trademarks,
service marks and trade names appearing in this report
are the property of their respective owners, and are
likewise used for identification purposes only.
This report is a service available
only to active Paid Premium Members.
You may opt-out of receiving report notifications
at any time. Questions or comments may be submitted
by writing to Premium Membership Services 665 S.E. 10 Street, Suite 201 Deerfield Beach, FL 33441-5634 or by calling 1-800-965-8307
or 954-785-1121.
|
|
|