You are not logged in.
This means you
CAN ONLY VIEW reports that were published prior to Monday, April 7, 2025.
You
MUST UPGRADE YOUR MEMBERSHIP if you want to see any current reports.
AFTER MARKET UPDATE - TUESDAY, NOVEMBER 7TH, 2023
Previous After Market Report Next After Market Report >>>
|
|
|
|
DOW |
+56.74 |
34,152.60 |
+0.17% |
|
Volume |
883,474,289 |
-2% |
|
Volume |
4,461,360,900 |
+1% |
|
NASDAQ |
+121.08 |
13,639.86 |
+0.90% |
|
Advancers |
1,197 |
42% |
|
Advancers |
2,059 |
48% |
|
S&P 500 |
+12.40 |
4,378.38 |
+0.28% |
|
Decliners |
1,635 |
58% |
|
Decliners |
2,255 |
52% |
|
Russell 2000 |
-4.79 |
1,733.15 |
-0.28% |
|
52 Wk Highs |
27 |
|
|
52 Wk Highs |
52 |
|
|
S&P 600 |
-7.83 |
1,128.55 |
-0.69% |
|
52 Wk Lows |
48 |
|
|
52 Wk Lows |
151 |
|
|
 |
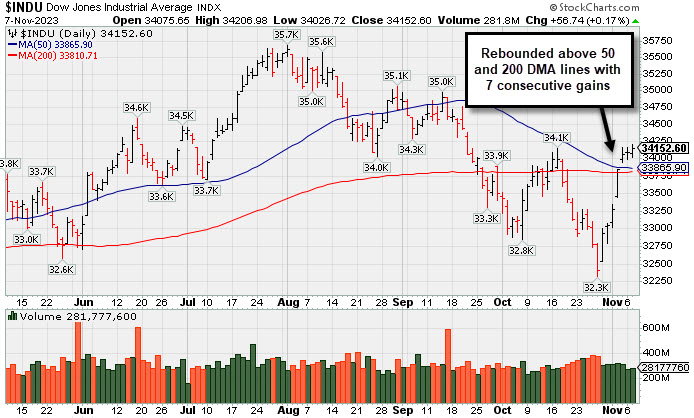
Nasdaq Composite Index Led Major Indices' Gains
Kenneth J. Gruneisen - Passed the CAN SLIM® Master's Exam
The Nasdaq Composite rose 0.9%, and the market-cap weighted S&P 500 rose 0.2%. The volume totals were mixed, lighter than the prior session on the NYSE and higher on the Nasdaq exchange. Breadth was negative as decliners led advancers by a 4-3 margin on the NYSE and by a narrow margin on the Nasdaq exchange. There were 24 high-ranked companies from the Leaders List that hit new 52-week highs and were listed on the BreakOuts Page, versus the total of 54 on the prior session. New 52-week lows outnumbered new 52-week highs on the NYSE and on the Nasdaq exchange. The major indices recently signaled a new confirmed uptrend for the market (M criteria). New buying efforts should be only made in stocks fitting all key criteria of the fact-based investment system.
PICTURED: The Dow Jones Industrial Average has rebounded above its 50-day and 200-day moving average (DMA) lines with 7 consecutive gains.
The consumer discretionary (+1.2%), information technology (+1.1%), and communication services (+0.6%) sectors closed at the top of the leaderboard, benefitting from gains in mega cap components.
Growth stocks were a source of support for the broader market. Cloud applications provider Datadog (DDOG +28.47%) following its earnings report. Uber (UBER +3.70%) and NXP Semi (NXPI + 1.6%) were modest winners after reporting earnings.
Rate-sensitive utilities (-0.7%) and real estate (-0.9%) sectors declined despite the drop in yields. The materials (-1.9%) and energy (-2.2%) sectors were also some of the worst performers. Oil prices ($77.33/bbl, -3.77, -4.7%) slumped considerably amid growth concerns coupled with geopolitical angst. The 2-yr note yield fell two basis points to 4.92% and the 10-yr note yield fell nine basis points to 4.57%. |
 Kenneth J. Gruneisen started out as a licensed stockbroker in August 1987, a couple of months prior to the historic stock market crash that took the Dow Jones Industrial Average down -22.6% in a single day. He has published daily fact-based fundamental and technical analysis on high-ranked stocks online for two decades. Through FACTBASEDINVESTING.COM, Kenneth provides educational articles, news, market commentary, and other information regarding proven investment systems that work in good times and bad.
Comments contained in the body of this report are technical opinions only and are not necessarily those of Gruneisen Growth Corp. The material herein has been obtained from sources believed to be reliable and accurate, however, its accuracy and completeness cannot be guaranteed. Our firm, employees, and customers may effect transactions, including transactions contrary to any recommendation herein, or have positions in the securities mentioned herein or options with respect thereto. Any recommendation contained in this report may not be suitable for all investors and it is not to be deemed an offer or solicitation on our part with respect to the purchase or sale of any securities. |
|
 |
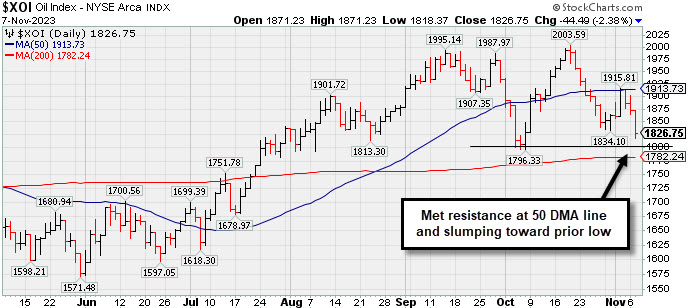
Retail and Tech Indexes Rose as Commodity-Linked Groups Fell
Kenneth J. Gruneisen - Passed the CAN SLIM® Master's Exam
The Retail Index ($RLX +1.47%) finished higher while the Broker/Dealer Index ($XBD +0.10%) held its ground and the Bank Index ($BKX -0.51%) edged lower. The tech sector had a positive bias as the Biotech Index ($BTK +1.20%) and Semiconductor Index ($SOX +0.77%) bothn notched gains while the Networking Index ($NWX -0.13%) inched lower. Commodity-linked groups clearly had a negative bias as the Gold & Silver Index ($XAU -2.36%), Oil Services Index ($OSX -3.85%) and the Integrated Oil Index ($XOI -2.38%) lost ground.
PICTURED: The Integrated Oil Index ($XOI -2.38%) met resistance at its 50-day moving average (DMA) line and is slumping toward its prior low and its 200 DMA line.
| Oil Services |
$OSX |
84.08 |
-3.37 |
-3.85% |
+0.26% |
| Integrated Oil |
$XOI |
1,826.75 |
-44.49 |
-2.38% |
+2.21% |
| Semiconductor |
$SOX |
3,471.46 |
+26.57 |
+0.77% |
+37.10% |
| Networking |
$NWX |
683.98 |
-0.90 |
-0.13% |
-12.68% |
| Broker/Dealer |
$XBD |
482.47 |
+0.47 |
+0.10% |
+7.42% |
| Retail |
$RLX |
3,583.81 |
+51.85 |
+1.47% |
+30.13% |
| Gold & Silver |
$XAU |
112.33 |
-2.72 |
-2.36% |
-7.06% |
| Bank |
$BKX |
78.58 |
-0.40 |
-0.51% |
-22.08% |
| Biotech |
$BTK |
4,834.18 |
+57.26 |
+1.20% |
-8.46% |
|
|
|
 |
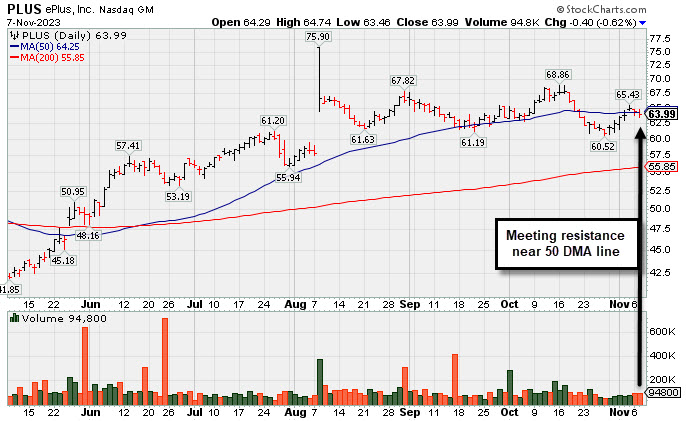
Just Below 50-Day Moving Average and a Subpar September Report
Kenneth J. Gruneisen - Passed the CAN SLIM® Master's Exam
ePlus (PLUS -$0.40 or -0.62% to $63.99) has recently been sputtering and meeting resistance near its 50-day moving average (DMA) line ($64.25) after rebounding near that important short-term average with a spurt of low-volume gains. It reported Sep '23 quarterly earnings +15% on +19% sales revenues versus the year ago period, below the +25% minimum earnings guideline (C criteria), raising concerns with regard to the fundamental guidelines of the fact-based investment system.
PLUS was highlighted in yellow in the 8/08/23 mid-day report (read here) with pivot point cited based on its May '22 high plus 10 cents. It was last shown in this FSU section on 9/28/23 with an annotated graph under the headline, "Orderly Consolidation Continues for ePlus".
It stalled following the bullish action after it reported earnings +42% on +25% sales revenues for the Jun '23 quarter versus the year ago period, its 3rd consecutive quarterly earnings increase above the +25% minimum guideline (C criteria). Annual earnings growth (A criteria) has been strong. It has a 97 earnings Per Share rating.
It hails from the Computer-Tech Services group which is currently ranked 59th on the 197 Industry Groups list. The small supply of only 26.9 million shares outstanding (S criteria) can contribute to greater price volatility in the event of institutional buying or selling. The number of top-rated funds owning its shares reportedly rose from 407 in Jun '23 to 427 in Sep '23, a reassuring sign concerning the I criteria. Its current Up/Down Volume ratio of 1.1 is an unbiased indication its shares have been under slight accumulation over the past 50 days. |
|
|
Color Codes Explained :
Y - Better candidates highlighted by our
staff of experts.
G - Previously featured
in past reports as yellow but may no longer be buyable under the
guidelines.
***Last / Change / Volume data in this table is the closing quote data***
Symbol/Exchange
Company Name
Industry Group |
PRICE |
CHANGE
(%Change) |
Day High |
Volume
(% DAV)
(% 50 day avg vol) |
52 Wk Hi
% From Hi |
Featured
Date |
Price
Featured |
Pivot Featured |
|
Max Buy |
 PLUS
-
NASDAQ
PLUS
-
NASDAQ
ePlus
Computer-Tech Services
|
$63.99
|
-0.40
-0.62% |
$64.74
|
94,800
87.78% of 50 DAV
50 DAV is 108,000
|
$75.90
-15.69%
|
8/8/2023
|
$67.60
|
PP = $62.92
|
|
MB = $66.07
|
 Most Recent Note - 11/7/2023 6:53:46 PM
Y - Sputtering below its 50 DMA line ($64.25). Reported subpar Sep '23 quarterly results raising fundamental concerns. See the latest FSU analysis for more details and a new annotated graph.
>>> FEATURED STOCK ARTICLE : Just Below 50-Day Moving Average and a Subpar September Report - 11/7/2023 |
View all notes |
Set NEW NOTE alert |
Company Profile |
SEC
News |
Chart |
Request a new note
C
A
S
I |
ANET
-
NYSE
Arista Networks
Computer-Networking
|
$212.60
|
-0.21
-0.10% |
$216.15
|
1,876,688
87.57% of 50 DAV
50 DAV is 2,143,000
|
$216.29
-1.71%
|
10/31/2023
|
$188.84
|
PP = $198.80
|
|
MB = $208.74
|
Most Recent Note - 11/7/2023 7:03:15 PM
G - On pullbacks the prior highs in the $198 area define near-term support above its 50 DMA line ($190.64). Paused today after 5 consecutive gains to new all-time highs. Bullish action came after it reported Sep '23 quarterly earnings +46% on +28% sales revenues versus the year-ago period.
>>> FEATURED STOCK ARTICLE : Powerful Gain Following Earnings Report for Arista Networks - 10/31/2023 |
View all notes |
Set NEW NOTE alert |
Company Profile |
SEC
News |
Chart |
Request a new note
C
A
S
I |
NVO
-
NYSE
Novo Nordisk ADR
Medical-Ethical Drugs
|
$101.69
|
+0.61
0.60% |
$102.00
|
4,358,617
94.44% of 50 DAV
50 DAV is 4,615,000
|
$104.00
-2.22%
|
11/2/2023
|
$100.97
|
PP = $104.10
|
|
MB = $109.31
|
Most Recent Note - 11/7/2023 7:05:23 PM
Y - Posted a gain with near-average volume for its second-best-ever close. Subsequent gains for new highs backed by at least +40% above average volume are needed to trigger a technical buy signal. This Denmark-based Medical - Ethical Drugs firm found support after briefly undercutting its 50 DMA line in recent weeks. Shares split 2-1 on 9/20/23. Reported Sep '23 quarterly earnings +69% on +39% sales revenues versus the year-ago period, its 3rd strong quarter, well above the +25% minimum earnings guideline (C criteria). Annual earnings growth has been slow and steady.
>>> FEATURED STOCK ARTICLE : Approaching Prior High With Strong Fundamentals - 11/2/2023 |
View all notes |
Set NEW NOTE alert |
Company Profile |
SEC
News |
Chart |
Request a new note
C
A
S
I |
QLYS
-
NASDAQ
Qualys
Computer Sftwr-Security
|
$172.18
|
+1.72
1.01% |
$172.83
|
331,683
98.42% of 50 DAV
50 DAV is 337,000
|
$171.77
0.24%
|
11/3/2023
|
$167.50
|
PP = $165.03
|
|
MB = $173.28
|
Most Recent Note - 11/7/2023 7:00:07 PM
Y - Hit another new all-time high with average volume today's 4th consecutive gain. Featured in yellow in the 11/03/23 mid-day report with pivot point cited based on its 10/11/23 high after a cup-with-handle base. Reported Sep '23 quarterly earnings +61% on +13% sales revenues versus the year-ago period, its 2nd strong quarterly comparison well above the +25% minimum earnings guideline (C criteria).
>>> FEATURED STOCK ARTICLE : Powerful Breakout for Qualys - 11/3/2023 |
View all notes |
Set NEW NOTE alert |
Company Profile |
SEC
News |
Chart |
Request a new note
C
A
S
I |
|
|
|
THESE ARE NOT BUY RECOMMENDATIONS!
Comments contained in the body of this report are technical
opinions only. The material herein has been obtained
from sources believed to be reliable and accurate, however,
its accuracy and completeness cannot be guaranteed.
This site is not an investment advisor, hence it does
not endorse or recommend any securities or other investments.
Any recommendation contained in this report may not
be suitable for all investors and it is not to be deemed
an offer or solicitation on our part with respect to
the purchase or sale of any securities. All trademarks,
service marks and trade names appearing in this report
are the property of their respective owners, and are
likewise used for identification purposes only.
This report is a service available
only to active Paid Premium Members.
You may opt-out of receiving report notifications
at any time. Questions or comments may be submitted
by writing to Premium Membership Services 665 S.E. 10 Street, Suite 201 Deerfield Beach, FL 33441-5634 or by calling 1-800-965-8307
or 954-785-1121.
|
|
|