You are not logged in.
This means you
CAN ONLY VIEW reports that were published prior to Thursday, March 20, 2025.
You
MUST UPGRADE YOUR MEMBERSHIP if you want to see any current reports.
AFTER MARKET UPDATE - THURSDAY, SEPTEMBER 28TH, 2023
Previous After Market Report Next After Market Report >>>
|
|
|
|
DOW |
+116.07 |
33,666.34 |
+0.35% |
|
Volume |
907,902,738 |
-2% |
|
Volume |
4,673,181,200 |
-4% |
|
NASDAQ |
+108.43 |
13,201.28 |
+0.83% |
|
Advancers |
1,937 |
68% |
|
Advancers |
2,610 |
60% |
|
S&P 500 |
+25.19 |
4,299.70 |
+0.59% |
|
Decliners |
900 |
32% |
|
Decliners |
1,729 |
40% |
|
Russell 2000 |
+15.41 |
1,794.31 |
+0.87% |
|
52 Wk Highs |
37 |
|
|
52 Wk Highs |
42 |
|
|
S&P 600 |
+12.97 |
1,159.12 |
+1.13% |
|
52 Wk Lows |
208 |
|
|
52 Wk Lows |
306 |
|
|
Damaging losses have signaled a more serious market correction (M criteria). During market corrections, disciplined investors know to reduce exposure and raise cash by selling any weakening stocks on a case-by-case basis.
|
 |
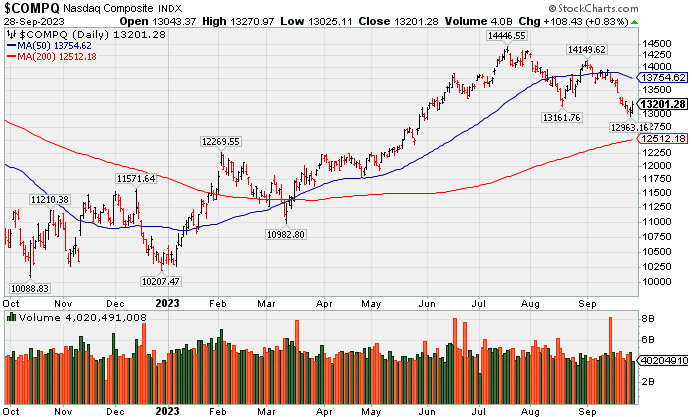
Major Indices Posted Gains With Lighter Volume Totals
Kenneth J. Gruneisen - Passed the CAN SLIM® Master's Exam
The major indices all registered gains, but closed off their highs of the day. The volume totals were lighter than the prior session on the NYSE and on the Nasdaq exchange. Advancers led decliners by more than a 2-1 margin on the NYSE and by a 3-2 margin on the Nasdaq exchange. There were 12 high-ranked companies from the Leaders List that hit a new 52-week high and were listed on the BreakOuts Page versus the total of 8 on the prior session. New 52-week lows totals solidly outnumbered new 52-week highs totals on the NYSE and on the Nasdaq exchange. The major indices are in a correction (M criteria). New buying efforts should be avoided until a new rally is confirmed by a solid follow-through day.
PICTURED: The Nasdaq Composite Index posted a 2nd consecutive gain. After recently undercutting its August low, its 200-day moving average (DMA) line defines the next important chart support.
Ten of the 11 S&P 500 sectors logged a gain. The communication services sector (+1.2%) led the outperformers while the rate-sensitive utilities sector (-2.2%) logged the biggest decline. The 10-yr note yield settled the session at 4.60%, down three basis points. The 2-yr note yield also saw some volatility before settling at 5.08%, five basis points lower.
Mega caps Apple (AAPL +0.15%) and Microsoft (MSFT +0.27%) were down 1.7% and 1.1%, respectively, at their lows of the day yet rebounded. Semiconductor stocks were a notable pocket of strength. The PHLX Semiconductor Index (SOX) rose 1.8%. Micron (MU -4.41%) was the only SOX component to close in the red, trading down after its earnings report.
|
 Kenneth J. Gruneisen started out as a licensed stockbroker in August 1987, a couple of months prior to the historic stock market crash that took the Dow Jones Industrial Average down -22.6% in a single day. He has published daily fact-based fundamental and technical analysis on high-ranked stocks online for two decades. Through FACTBASEDINVESTING.COM, Kenneth provides educational articles, news, market commentary, and other information regarding proven investment systems that work in good times and bad.
Comments contained in the body of this report are technical opinions only and are not necessarily those of Gruneisen Growth Corp. The material herein has been obtained from sources believed to be reliable and accurate, however, its accuracy and completeness cannot be guaranteed. Our firm, employees, and customers may effect transactions, including transactions contrary to any recommendation herein, or have positions in the securities mentioned herein or options with respect thereto. Any recommendation contained in this report may not be suitable for all investors and it is not to be deemed an offer or solicitation on our part with respect to the purchase or sale of any securities. |
|
 |
Financial, Networking, and Semiconductor Indexes Led Gainers
Kenneth J. Gruneisen - Passed the CAN SLIM® Master's Exam
The Bank Index ($BKX +1.04%) and the Broker/Dealer Index ($XBD +1.24%) both posted solid gains while the Retail Index ($RLX +0.29%) posted a smaller gain. The Semiconductor Index ($SOX +1.77%) and the Networking Index ($NWX +1.51%) each posted gains but the Biotech Index ($BTK -0.69%) edged lower. The Oil Services Index ($OSX -0.15%) inched loower as the Integrated Oil Index ($XOI +0.33%) eked out a small gain and the Gold & Silver Index ($XAU +0.62%) edged higher.
PICTURED: The Broker/Dealer Index ($XBD +1.24%) recently slumped below its 50-day moving average (DMA) line toward its prior low and is 200 DMA line.
| Oil Services |
$OSX |
97.32 |
-0.15 |
-0.15% |
+16.05% |
| Integrated Oil |
$XOI |
1,973.62 |
+6.42 |
+0.33% |
+10.43% |
| Semiconductor |
$SOX |
3,420.99 |
+59.58 |
+1.77% |
+35.10% |
| Networking |
$NWX |
744.19 |
+11.06 |
+1.51% |
-4.99% |
| Broker/Dealer |
$XBD |
485.92 |
+5.93 |
+1.24% |
+8.19% |
| Retail |
$RLX |
3,347.28 |
+9.74 |
+0.29% |
+21.54% |
| Gold & Silver |
$XAU |
107.86 |
+0.67 |
+0.62% |
-10.76% |
| Bank |
$BKX |
78.18 |
+0.80 |
+1.04% |
-22.48% |
| Biotech |
$BTK |
5,025.68 |
-34.75 |
-0.69% |
-4.84% |
|
|
|
 |
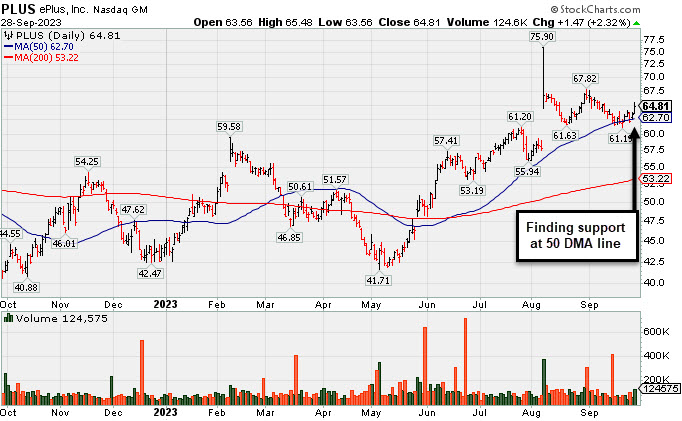
Orderly Consolidation Continues for ePlus
Kenneth J. Gruneisen - Passed the CAN SLIM® Master's Exam
ePlus (PLUS +$1.47 or +2.32% to $64.81) found support while recently consolidating near its 50-day moving average (DMA) line ($62.70). More damaging losses may trigger a technical sell signal.
PLUS was highlighted in yellow in the 8/08/23 mid-day report (read here) with pivot point cited based on its May '22 high plus 10 cents. It was last shown in this FSU section on 9/12/23 with an annotated graph under the headline, "Still Consolidating Above 50 DMA Line".
Bullish action came after it reported earnings +42% on +25% sales revenues for the Jun '23 quarter versus the year ago period, its 3rd consecutive quarterly earnings increase above the +25% minimum guideline (C criteria), helping it better match the winning models of the fact-based investment system. Annual earnings growth (A criteria) has been strong. It has a 97 earnings Per Share rating.
It hails from the Computer-Tech Services group which is currently ranked 76th on the 197 Industry Groups list. The small supply of only 26.9 million shares outstanding (S criteria) can contribute to greater price volatility in the event of institutional buying or selling. The number of top-rated funds owning its shares reportedly fell from 422 in Sep '22 to 409 in Jun '23, not a reassuring sign concerning the I criteria. Meanwhile, its current Up/Down Volume ratio of 0.8 is an unbiased indication its shares have been under slight accumulation over the past 50 days. |
|
|
Color Codes Explained :
Y - Better candidates highlighted by our
staff of experts.
G - Previously featured
in past reports as yellow but may no longer be buyable under the
guidelines.
***Last / Change / Volume data in this table is the closing quote data***
Symbol/Exchange
Company Name
Industry Group |
PRICE |
CHANGE
(%Change) |
Day High |
Volume
(% DAV)
(% 50 day avg vol) |
52 Wk Hi
% From Hi |
Featured
Date |
Price
Featured |
Pivot Featured |
|
Max Buy |
 STRL
-
NASDAQ
STRL
-
NASDAQ
Sterling Infrastructure
Bldg-Heavy Construction
|
$73.70
|
+0.52
0.71% |
$75.70
|
280,394
68.89% of 50 DAV
50 DAV is 407,000
|
$84.00
-12.26%
|
12/14/2022
|
$32.41
|
PP = $33.72
|
|
MB = $35.41
|
Most Recent Note - 9/27/2023 5:04:08 PM
G - Rebounded above its 50 DMA line ($72.39) with today's gain backed by higher (but still below-average) volume. Fundamentals remain strong. See the latest FSU analysis for more details and a new annotated graph.
>>> FEATURED STOCK ARTICLE : Found Support and Rebounded Above 50-Day Moving Average - 9/27/2023 |
View all notes |
Set NEW NOTE alert |
Company Profile |
SEC
News |
Chart |
Request a new note
C
A
S
I |
FIX
-
NYSE
Comfort Systems USA
Bldg-A/C and Heating Prds
|
$176.47
|
+3.70
2.14% |
$177.69
|
249,128
100.86% of 50 DAV
50 DAV is 247,000
|
$192.33
-8.25%
|
4/27/2023
|
$148.85
|
PP = $152.23
|
|
MB = $159.84
|
 Most Recent Note - 9/28/2023 5:17:49 PM
G - Posted a 2nd consecutive gain with near-average volume. A rebound above the 50 DMA line ($178.24) is still needed for its outlook to improve. Fundamentals remain strong.
>>> FEATURED STOCK ARTICLE : Violated 50-Day Moving Average With a Damaging Gap Down - 9/21/2023 |
View all notes |
Set NEW NOTE alert |
Company Profile |
SEC
News |
Chart |
Request a new note
C
A
S
I |
ANET
-
NYSE
Arista Networks
Computer-Networking
|
$184.43
|
+2.83
1.56% |
$184.92
|
1,709,831
65.24% of 50 DAV
50 DAV is 2,621,000
|
$198.70
-7.18%
|
8/1/2023
|
$188.84
|
PP = $178.46
|
|
MB = $187.38
|
Most Recent Note - 9/26/2023 5:51:38 PM
G - Quietly sputtering below its 50 DMA line ($181) today with another loss on light volume. Only a prompt rebound above the 50 DMA line would help its outlook improve. Fundamentals remain strong.
>>> FEATURED STOCK ARTICLE : Orderly Pullback Below "Max Buy" Level - 9/15/2023 |
View all notes |
Set NEW NOTE alert |
Company Profile |
SEC
News |
Chart |
Request a new note
C
A
S
I |
MEDP
-
NASDAQ
Medpace Holdings
Medical-Research Eqp/Svc
|
$246.37
|
-1.63
-0.66% |
$248.69
|
255,076
88.57% of 50 DAV
50 DAV is 288,000
|
$282.73
-12.86%
|
7/25/2023
|
$196.32
|
PP = $241.57
|
|
MB = $253.65
|
Most Recent Note - 9/27/2023 5:06:39 PM
G - Holding its ground for the past week after violating its 50 DMA line ($259.53) with volume-driven losses. A rebound above the 50 DMA line is needed for its outlook to improve. Fundamentals remain strong.
>>> FEATURED STOCK ARTICLE : Damaging Streak of Losses Violated 50-Day Moving Average Line - 9/22/2023 |
View all notes |
Set NEW NOTE alert |
Company Profile |
SEC
News |
Chart |
Request a new note
C
A
S
I |
COKE
-
NASDAQ
Coca-Cola Consolidated
Beverages-Non-Alcoholic
|
$643.43
|
+6.83
1.07% |
$648.55
|
22,036
56.50% of 50 DAV
50 DAV is 39,000
|
$745.53
-13.69%
|
8/3/2023
|
$718.56
|
PP = $694.30
|
|
MB = $729.02
|
Most Recent Note - 9/28/2023 5:15:52 PM
G - Posted a gain today with light volume. A rebound above the 50 DMA line ($673) is still needed to help its outlook improve.
>>> FEATURED STOCK ARTICLE : Lingering Below 50 DMA Line and Perched -12.3% Off High - 9/25/2023 |
View all notes |
Set NEW NOTE alert |
Company Profile |
SEC
News |
Chart |
Request a new note
C
A
S
I |
Symbol/Exchange
Company Name
Industry Group |
PRICE |
CHANGE
(%Change) |
Day High |
Volume
(% DAV)
(% 50 day avg vol) |
52 Wk Hi
% From Hi |
Featured
Date |
Price
Featured |
Pivot Featured |
|
Max Buy |
PLUS
-
NASDAQ
ePlus
Computer-Tech Services
|
$64.81
|
+1.47
2.32% |
$65.48
|
124,271
116.14% of 50 DAV
50 DAV is 107,000
|
$75.90
-14.61%
|
8/8/2023
|
$67.60
|
PP = $62.92
|
|
MB = $66.07
|
Most Recent Note - 9/28/2023 5:14:40 PM
Y - Recently found support near its 50 DMA line ($62.70). More damaging losses may trigger a technical sell signal. See the latest FSU analysis for more details and a new annotated graph.
>>> FEATURED STOCK ARTICLE : Orderly Consolidation Continues for ePlus - 9/28/2023 |
View all notes |
Set NEW NOTE alert |
Company Profile |
SEC
News |
Chart |
Request a new note
C
A
S
I |
|
|
|
THESE ARE NOT BUY RECOMMENDATIONS!
Comments contained in the body of this report are technical
opinions only. The material herein has been obtained
from sources believed to be reliable and accurate, however,
its accuracy and completeness cannot be guaranteed.
This site is not an investment advisor, hence it does
not endorse or recommend any securities or other investments.
Any recommendation contained in this report may not
be suitable for all investors and it is not to be deemed
an offer or solicitation on our part with respect to
the purchase or sale of any securities. All trademarks,
service marks and trade names appearing in this report
are the property of their respective owners, and are
likewise used for identification purposes only.
This report is a service available
only to active Paid Premium Members.
You may opt-out of receiving report notifications
at any time. Questions or comments may be submitted
by writing to Premium Membership Services 665 S.E. 10 Street, Suite 201 Deerfield Beach, FL 33441-5634 or by calling 1-800-965-8307
or 954-785-1121.
|
|
|