You are not logged in.
This means you
CAN ONLY VIEW reports that were published prior to Wednesday, April 16, 2025.
You
MUST UPGRADE YOUR MEMBERSHIP if you want to see any current reports.
AFTER MARKET UPDATE - MONDAY, OCTOBER 7TH, 2019
Previous After Market Report Next After Market Report >>>
|
|
|
|
DOW |
-95.70 |
26,478.02 |
-0.36% |
|
Volume |
841,516,180 |
+17% |
|
Volume |
1,734,482,320 |
-0% |
|
NASDAQ |
-26.18 |
7,956.29 |
-0.33% |
|
Advancers |
952 |
37% |
|
Advancers |
1,317 |
43% |
|
S&P 500 |
-13.22 |
2,938.79 |
-0.45% |
|
Decliners |
1,615 |
63% |
|
Decliners |
1,753 |
57% |
|
Russell 2000 |
-2.91 |
1,497.79 |
-0.19% |
|
52 Wk Highs |
77 |
|
|
52 Wk Highs |
28 |
|
|
S&P 600 |
-1.75 |
928.71 |
-0.19% |
|
52 Wk Lows |
35 |
|
|
52 Wk Lows |
87 |
|
|
 |
Major Indices Fell While Breadth Had a Positive Bias
Kenneth J. Gruneisen - Passed the CAN SLIM® Master's Exam
The Dow dropped 95 points, while the S&P 500 fell 0.5%. The Nasdaq Composite lost 0.3%. Volume totals reported were near the prior session total on the Nasdaq exchange and higher on the NYSE. Breadth was positive as advancers led decliners by 8-5 on the NYSE and by a 3-2 margin on the Nasdaq exchange. There were 15 high-ranked companies from the Leaders List that hit a new 52-week high and were listed on the BreakOuts Page, versus the total of 13 on the prior session. New 52-week lows outnumbered new 52-week highs again on the Nasdaq exchange, meanwhile new highs outnumbered new lows on the NYSE. The uptrend for the major indices (M criteria) has recently come under greater pressure, having the look of a more serious correction. Disciplined investors know to reduce exposure to stocks during market corrections. The Featured Stocks Page provides the most timely analysis on high-ranked leaders. Charts used courtesy of www.stockcharts.com
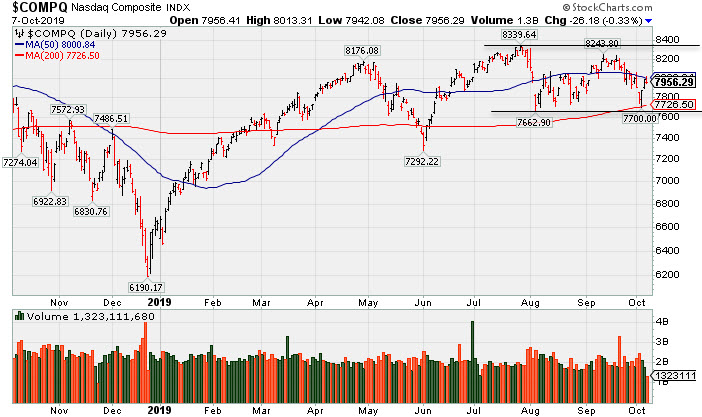
PICTURED: The Nasdaq Composite Index's prior low and its 200-day moving average (DMA) line define important near-term support to watch. More damaging losses may bode poorly for the market outlook. Meanwhile, it remains perched only -4.6% off its record high.
Stocks ended the session lower Monday, as investors assessed the latest U.S.-China trade headlines. Investors monitored mid-level negotiations that continue tomorrow, ahead of high-level talks scheduled to start on Thursday.
Stocks were pressured earlier after Beijing indicated that its negotiators would not provide commitments on industrial reform, government subsidies, or intellectual property. However, China’s Commerce of Ministry said the country is open to a partial deal contingent on a timetable for more complex issues. This follows a volatile start to October, with disappointing domestic PMI readings reigniting concerns of an economic slowdown. The ISM’s gauges showed U.S. manufacturing activity hitting the worst level in a decade last month, while activity in the services sector fell to a three-year low. Monday’s consumer credit report topped analyst forecasts driven by school loans and non-revolving debt. Treasuries declined along the curve, with the yield on the benchmark 10-year note advancing one basis points to 1.55%. In commodities, WTI crude jumped 0.2% to $52.92/barrel. COMEX gold fell 1.0% to $1,490.60/ounce amid a stronger dollar.
Ten of 11 S&P 500 sectors closed in negative territory, with the Communication Services the lone advancer. In corporate news, General Electric (GE -0.12%) finished slightly lower after announcing plans to reduce its pension plan deficit by up to $8 billion and net debt by up to $6 billion. Shares of Uber (UBER +2.36%) rose after the ridesharing company was upgraded by an analyst citing better ride fundamentals and conservative management forecasts.
|
 Kenneth J. Gruneisen started out as a licensed stockbroker in August 1987, a couple of months prior to the historic stock market crash that took the Dow Jones Industrial Average down -22.6% in a single day. He has published daily fact-based fundamental and technical analysis on high-ranked stocks online for two decades. Through FACTBASEDINVESTING.COM, Kenneth provides educational articles, news, market commentary, and other information regarding proven investment systems that work in good times and bad.
Comments contained in the body of this report are technical opinions only and are not necessarily those of Gruneisen Growth Corp. The material herein has been obtained from sources believed to be reliable and accurate, however, its accuracy and completeness cannot be guaranteed. Our firm, employees, and customers may effect transactions, including transactions contrary to any recommendation herein, or have positions in the securities mentioned herein or options with respect thereto. Any recommendation contained in this report may not be suitable for all investors and it is not to be deemed an offer or solicitation on our part with respect to the purchase or sale of any securities. |
|
 |
Retail, Tech, Financial, and Commodity-Linked Groups Fell
Kenneth J. Gruneisen - Passed the CAN SLIM® Master's Exam
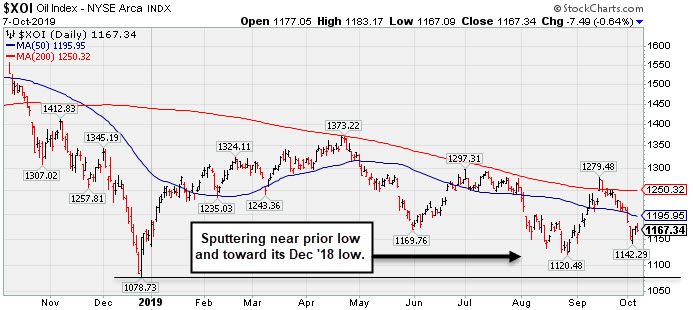
The Broker/Dealer Index ($XBD -0.16%) and the Bank Index ($BKX -0.31%) both ended the session with modest losses while the Retail Index ($RLX -0.46%) had an even bigger loss. The tech sector had a negative bias as the Semiconductor Index ($SOX -0.71%) and the Biotech Index ($BTK -0.27%) fell while the Networking Index ($NWX +0.04%) finished flat. Commodity-linked groups had a negative bias as the Oil Services Index ($OSX -0.92%), Integrated Oil Index ($XOI -0.64%), and the Gold & Silver Index ($XAU -0.90%) each ended lower.
PICTURED: The Integrated Oil Index ($XOI -0.64%) is sputtering below its 50-day moving average (DMA) line and near the prior low. Its December 2018 low defines the next important support level.
| Oil Services |
$OSX |
62.24 |
-0.57 |
-0.91% |
-22.78% |
| Integrated Oil |
$XOI |
1,167.34 |
-7.49 |
-0.64% |
+0.71% |
| Semiconductor |
$SOX |
1,563.17 |
-11.22 |
-0.71% |
+35.32% |
| Networking |
$NWX |
547.51 |
+0.23 |
+0.04% |
+12.04% |
| Broker/Dealer |
$XBD |
247.01 |
-0.39 |
-0.16% |
+4.07% |
| Retail |
$RLX |
2,324.95 |
-10.83 |
-0.46% |
+19.14% |
| Gold & Silver |
$XAU |
90.29 |
-0.82 |
-0.90% |
+27.78% |
| Bank |
$BKX |
96.93 |
-0.29 |
-0.30% |
+12.99% |
| Biotech |
$BTK |
4,206.63 |
-11.40 |
-0.27% |
-0.34% |
|
|
|
 |
Near High After Finding Support at 50-Day Average
Kenneth J. Gruneisen - Passed the CAN SLIM® Master's Exam
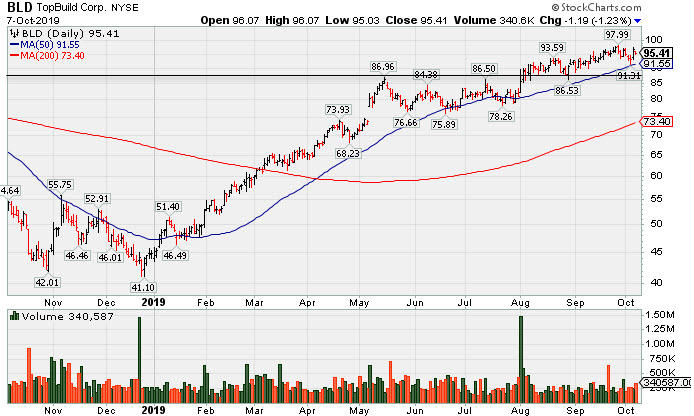
Topbuild Corp (BLD -$1.19 or -1.23% to $95.41) recently stayed above its 50-day moving average (DMA) line and remains perched near its all-time high. It is extended from the prior base after wedging higher with gains lacking great volume conviction. Its 50 DMA line ($91.55) defines important support to watch along with its prior low ($86.53 on 8/28/19).
It reported earnings +39% on +9% sales revenues for the Jun '19 quarter versus the year ago period, continuing its strong earnings track record of quarterly earnings increases above the +25% minimum guideline (C criteria). It has a 99 Earnings Per Share Rating, as its annual earnings (A criteria) history has also been strong and steady since turning profitable in FY '14.
BLD was last shown in this FSU section on 9/23/19 with an annotated graph under the headline, "Perched Near Record High, Extended From Prior Base". It was highlighted in yellow with new pivot point cited based on its 8/12/18 high plus 10 cents in the 5/17/19 mid-day report (read here).
The number of top-rated funds owning its shares rose from 380 in Dec '18 to 417 in Sep '19. Its current Up/Down Volume Ratio of 1.4 is an unbiased indication its shares have been under accumulation over the past 50 days. It has a Timeliness Rating of A and a Sponsorship Rating of D.
|
|
|
Color Codes Explained :
Y - Better candidates highlighted by our
staff of experts.
G - Previously featured
in past reports as yellow but may no longer be buyable under the
guidelines.
***Last / Change / Volume data in this table is the closing quote data***
Symbol/Exchange
Company Name
Industry Group |
PRICE |
CHANGE
(%Change) |
Day High |
Volume
(% DAV)
(% 50 day avg vol) |
52 Wk Hi
% From Hi |
Featured
Date |
Price
Featured |
Pivot Featured |
|
Max Buy |
 MLR
-
NYSE
MLR
-
NYSE
Miller Industries Inc
AUTOMOTIVE - Auto Parts
|
$31.23
|
-0.30
-0.95% |
$32.04
|
31,246
89.53% of 50 DAV
50 DAV is 34,900
|
$35.26
-11.43%
|
9/24/2019
|
$34.00
|
PP = $35.36
|
|
MB = $37.13
|
Most Recent Note - 10/4/2019 5:39:13 PM
G - Color code is changed to green after suffering a 7th consecutive loss and slumping below its 50 DMA line ($32.24). A rebound and subsequent gains above the pivot point backed by at least +40% above average volume may trigger a technical buy signal. Reported June '19 quarterly earnings +40% on +26% sales revenues versus the year ago period, and 3 of the past 4 comparisons were above the +25% minimum earnings guideline (C criteria).
>>> FEATURED STOCK ARTICLE : Encountered Distributional Pressure After Challenging Prior High - 9/24/2019 |
View all notes |
Set NEW NOTE alert |
Company Profile |
SEC
News |
Chart |
Request a new note
C
A
S
I |
CCBG
-
NASDAQ
Capital City Bk Gp
BANKING - Regional - Mid-Atlantic Banks
|
$26.57
|
-0.36
-1.34% |
$27.10
|
33,811
120.75% of 50 DAV
50 DAV is 28,000
|
$28.00
-5.11%
|
9/13/2019
|
$27.03
|
PP = $27.05
|
|
MB = $28.40
|
Most Recent Note - 10/4/2019 5:31:09 PM
Y - Hovering near its 52-week high. Prior highs define initial support to watch above its 50 DMA line ($25.48).
>>> FEATURED STOCK ARTICLE : Stalled After Recent Rally for New High - 9/27/2019 |
View all notes |
Set NEW NOTE alert |
Company Profile |
SEC
News |
Chart |
Request a new note
C
A
S
I |
EPAM
-
NYSE
Epam Systems Inc
COMPUTER SOFTWARE and SERVICES - Information Technology Service
|
$190.03
|
+1.12
0.59% |
$191.64
|
473,691
134.57% of 50 DAV
50 DAV is 352,000
|
$201.00
-5.46%
|
5/9/2019
|
$169.25
|
PP = $180.55
|
|
MB = $189.58
|
Most Recent Note - 10/4/2019 5:36:37 PM
G - Rebounded above its 50 DMA line ($187.33) helping its outlook to improve. Faces resistance due to overhead supply up to the $201 level. Prior lows in the $174-175 area define the next important support level. Reported earnings +27% on +24% sales revenues for the Jun '19 quarter.
>>> FEATURED STOCK ARTICLE : Slumped and Sputtered Below 50-Day Moving Average - 9/30/2019 |
View all notes |
Set NEW NOTE alert |
Company Profile |
SEC
News |
Chart |
Request a new note
C
A
S
I |
AUDC
-
NASDAQ
Audiocodes Ltd
ELECTRONICS - Scientific and Technical Instrum
|
$18.52
|
-0.54
-2.83% |
$18.96
|
245,455
117.44% of 50 DAV
50 DAV is 209,000
|
$22.50
-17.69%
|
9/13/2019
|
$19.68
|
PP = $19.84
|
|
MB = $20.83
|
Most Recent Note - 10/4/2019 5:41:28 PM
Y - Rebounded above its 50 DMA line ($18.55) promptly helping its outlook improve and the color code is changed to yellow. See the latest FSU analysis for more details and an annotated graph.
>>> FEATURED STOCK ARTICLE : Sank Below 50-Day Average as 7 Straight Losses Follow Reversal - 10/2/2019 |
View all notes |
Set NEW NOTE alert |
Company Profile |
SEC
News |
Chart |
Request a new note
C
A
S
I |
CHDN
-
NASDAQ
Churchill Downs Inc
LEISURE - Gaming Activities
|
$128.70
|
+0.36
0.28% |
$129.16
|
212,794
92.92% of 50 DAV
50 DAV is 229,000
|
$132.73
-3.04%
|
7/22/2019
|
$118.45
|
PP = $118.89
|
|
MB = $124.83
|
Most Recent Note - 10/4/2019 5:33:06 PM
G - Posted a big gain on near average volume rallying for a best-ever close above its "max buy" level and its color code is changed to green. Found support when consolidating near its 50 DMA line ($122). That important short-term average has acted as support in recent weeks during its consolidation. Prior lows define the next important support to watch. Jun '19 earnings +10% on +26% sales revenues versus the year ago period were below the +25% minimum earnings guideline (C criteria), noted recently raising fundamental concerns.
>>> FEATURED STOCK ARTICLE : Consolidating Above 50-Day Moving Average Line - 9/20/2019 |
View all notes |
Set NEW NOTE alert |
Company Profile |
SEC
News |
Chart |
Request a new note
C
A
S
I |
Symbol/Exchange
Company Name
Industry Group |
PRICE |
CHANGE
(%Change) |
Day High |
Volume
(% DAV)
(% 50 day avg vol) |
52 Wk Hi
% From Hi |
Featured
Date |
Price
Featured |
Pivot Featured |
|
Max Buy |
LULU
-
NASDAQ
Lululemon Athletica
MANUFACTURING - Textile Manufacturing
|
$191.66
|
-1.46
-0.76% |
$193.40
|
1,162,217
65.11% of 50 DAV
50 DAV is 1,785,000
|
$204.44
-6.25%
|
9/6/2019
|
$201.25
|
PP = $194.35
|
|
MB = $204.07
|
 Most Recent Note - 10/7/2019 5:57:49 PM
Y - Found support at its 50 DMA line ($187.23) but recently sputtering below the prior high ($194.25) raising concerns. More damaging losses would raise serious concerns and trigger a technical sell signal.
>>> FEATURED STOCK ARTICLE : Found Support After Undercutting 50-Day Moving Average - 10/3/2019 |
View all notes |
Set NEW NOTE alert |
Company Profile |
SEC
News |
Chart |
Request a new note
C
A
S
I |
CPRT
-
NASDAQ
Copart Inc
SPECIALTY RETAIL - Auto Dealerships
|
$79.76
|
-0.23
-0.29% |
$80.22
|
857,275
58.16% of 50 DAV
50 DAV is 1,474,000
|
$83.70
-4.71%
|
9/5/2019
|
$79.13
|
PP = $79.84
|
|
MB = $83.83
|
Most Recent Note - 10/4/2019 5:28:26 PM
G - Found prompt support and rebounded above its 50 DMA line ($78.06) and back above its pivot point helping its outlook improve. See the latest FSU analysis for more details and a new annotated graph.
>>> FEATURED STOCK ARTICLE : Found Prompt Support Near 50-Day Moving Average - 10/4/2019 |
View all notes |
Set NEW NOTE alert |
Company Profile |
SEC
News |
Chart |
Request a new note
C
A
S
I |
PFPT
-
NASDAQ
Proofpoint Inc
Computer Sftwr-Security
|
$130.24
|
+1.45
1.13% |
$131.74
|
1,331,260
193.22% of 50 DAV
50 DAV is 689,000
|
$133.00
-2.08%
|
10/1/2019
|
$129.59
|
PP = $132.95
|
|
MB = $139.60
|
Most Recent Note - 10/7/2019 12:31:23 PM
Y - Perched within close striking distance of its all-time high with today's volume-driven gain. Reversed into the red on 10/01/19 after touching a new all-time high. Met stubborn resistance in the $132 area in recent months. Subsequent gains above the pivot point backed by at least +40% above average volume may trigger a technical buy signal.
>>> FEATURED STOCK ARTICLE : Challenging Previously Stubborn Resistance - 10/1/2019 |
View all notes |
Set NEW NOTE alert |
Company Profile |
SEC
News |
Chart |
Request a new note
C
A
S
I |
BLD
-
NYSE
Topbuild Corp
Bldg-Constr Prds/Misc
|
$95.41
|
-1.19
-1.23% |
$96.07
|
340,587
114.68% of 50 DAV
50 DAV is 297,000
|
$97.99
-2.63%
|
5/17/2019
|
$82.19
|
PP = $87.31
|
|
MB = $91.68
|
Most Recent Note - 10/4/2019 5:34:58 PM
G - Posted a quiet gain, staying above its 50 DMA line and challenging its all-time high. It is extended from the prior base after wedging higher with gains lacking great volume conviction. Earnings rose +39% on +9% sales revenues for the Jun '19 quarter versus the year ago period. Its 50 DMA line ($91.26) defines important support to watch along with its prior low ($86.53 on 8/28/19).
>>> FEATURED STOCK ARTICLE : Near High After Finding Support at 50-Day Average - 10/7/2019 |
View all notes |
Set NEW NOTE alert |
Company Profile |
SEC
News |
Chart |
Request a new note
C
A
S
I |
PAGS
-
NYSE
Pagseguro Digital Cl A
Finance-CrdtCard/PmtPr
|
$45.49
|
-0.67
-1.45% |
$46.46
|
639,290
34.35% of 50 DAV
50 DAV is 1,861,000
|
$53.43
-14.86%
|
6/25/2019
|
$37.69
|
PP = $40.07
|
|
MB = $42.07
|
Most Recent Note - 10/7/2019 5:55:25 PM
G - A rebound above the 50 DMA line ($47.36) is needed for its outlook to improve. Recently testing prior lows in the $42-43 area noted as important near-term chart support to watch where violations may trigger a worrisome technical sell signal.
>>> FEATURED STOCK ARTICLE : Recent Lows Define Important Near-Term Support While Consolidating - 9/25/2019 |
View all notes |
Set NEW NOTE alert |
Company Profile |
SEC
News |
Chart |
Request a new note
C
A
S
I |
Symbol/Exchange
Company Name
Industry Group |
PRICE |
CHANGE
(%Change) |
Day High |
Volume
(% DAV)
(% 50 day avg vol) |
52 Wk Hi
% From Hi |
Featured
Date |
Price
Featured |
Pivot Featured |
|
Max Buy |
|
|
|
THESE ARE NOT BUY RECOMMENDATIONS!
Comments contained in the body of this report are technical
opinions only. The material herein has been obtained
from sources believed to be reliable and accurate, however,
its accuracy and completeness cannot be guaranteed.
This site is not an investment advisor, hence it does
not endorse or recommend any securities or other investments.
Any recommendation contained in this report may not
be suitable for all investors and it is not to be deemed
an offer or solicitation on our part with respect to
the purchase or sale of any securities. All trademarks,
service marks and trade names appearing in this report
are the property of their respective owners, and are
likewise used for identification purposes only.
This report is a service available
only to active Paid Premium Members.
You may opt-out of receiving report notifications
at any time. Questions or comments may be submitted
by writing to Premium Membership Services 665 S.E. 10 Street, Suite 201 Deerfield Beach, FL 33441-5634 or by calling 1-800-965-8307
or 954-785-1121.
|
|
|