You are not logged in.
This means you
CAN ONLY VIEW reports that were published prior to Wednesday, April 9, 2025.
You
MUST UPGRADE YOUR MEMBERSHIP if you want to see any current reports.
AFTER MARKET UPDATE - TUESDAY, OCTOBER 1ST, 2019
Previous After Market Report Next After Market Report >>>
|
|
|
|
DOW |
-343.79 |
26,573.04 |
-1.28% |
|
Volume |
792,954,960 |
-12% |
|
Volume |
2,234,213,620 |
+27% |
|
NASDAQ |
-90.66 |
7,908.68 |
-1.13% |
|
Advancers |
761 |
27% |
|
Advancers |
762 |
25% |
|
S&P 500 |
-36.49 |
2,940.25 |
-1.23% |
|
Decliners |
2,020 |
73% |
|
Decliners |
2,314 |
75% |
|
Russell 2000 |
-29.94 |
1,493.43 |
-1.97% |
|
52 Wk Highs |
57 |
|
|
52 Wk Highs |
39 |
|
|
S&P 600 |
-18.45 |
929.27 |
-1.95% |
|
52 Wk Lows |
53 |
|
|
52 Wk Lows |
132 |
|
|
 |
Indices Hit as Broker/Dealer Index Dives on Schwab Move
Kenneth J. Gruneisen - Passed the CAN SLIM® Master's Exam
The Dow lost 343 points, while the S&P 500 dropped 1.2% for its largest decline in more than a month. The Nasdaq Composite slipped 1.1%. Volume totals reported were mixed, lighter than the prior session on the NYSE and higher on the Nasdaq exchange. Breadth was negative as decliners led advancers by a 3-1 margin on the Nasdaq exchange and by nearly 3-1 on the NYSE. There were 29 high-ranked companies from the Leaders List hit new 52-week highs and were listed on the BreakOuts Page, versus the total of 27 on the prior session. New 52-week highs totals still outnumbered new 52-week lows totals on the NYSE, but new 52-week lows outnumbered new highs on the Nasdaq exchange for the sixth consecutive session. The uptrend for the major indices (M criteria) has come under pressure while leadership has recently been waning. Disciplined investors know to make new buying efforts only in stocks fitting all of the key criteria of the fact-based investment system. The Featured Stocks Page provides the most timely analysis on high-ranked leaders. Charts used courtesy of www.stockcharts.com
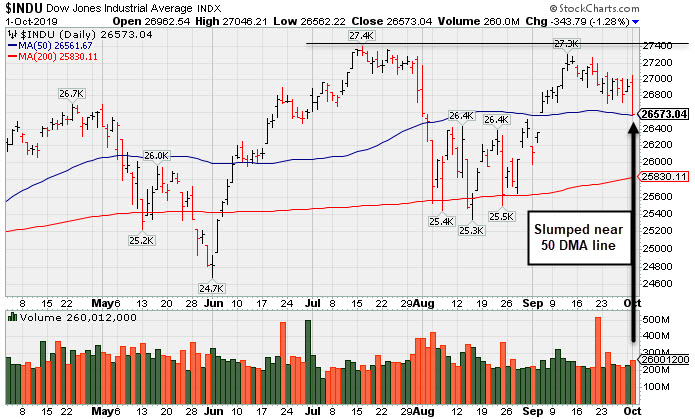
PICTURED: The Dow Jones Industrial Average sank near its 50-day moving average (DMA) line. More damaging losses may bode poorly for the market outllook, meanwhile, it remains perched only -3% off its record high.
Stocks traded lower Tuesday as disappointing economic data sparked concerns over the U.S. economy. On the data front, the ISM’s manufacturing PMI showed U.S. factory activity falling deeper into contractionary territory in September to a decade low of 47.8 versus August’s 49.1 figure. This follows soft manufacturing reports out of Europe, with Eurozone PMI coming in at the lowest level since October 2012. Separately, domestic construction spending edged up 0.1% in August, below estimates for a 0.5% gain. U.S. Treasuries gained with the yield on the 10-year note slipping three basis points to 1.64%. In commodities, WTI crude declined 1.0% to $53.56/barrel. COMEX gold climbed 0.9% attributed to investors seeking perceived safe haven assets.
All 11 S&P 500 sectors ended the day in negative territory today with Financials, Industrials, Energy, and Materials all declining more than 2.0%. In corporate news, Charles Schwab (SCHW -9.73%) after the brokerage firm announced it will be eliminating online trading commissions for stocks, ETFs, and options. McDonalds (MCD -2.65%) fell following negative analyst commentary concerning same-store sales forecasts. In earnings, McCormick (MKC +6.81%) rose after the spice maker topped profit estimates and raised its forward guidance.
The major averages ended the third quarter on a high note Monday. The S&P 500 rose 0.5% as trade optimism boosted investor sentiment. The advance pushed the benchmark index September gain to 1.7% to finish the third-quarter with a 1.2% increase and its best January-September performance since 1997 (+18.7%).
|
 Kenneth J. Gruneisen started out as a licensed stockbroker in August 1987, a couple of months prior to the historic stock market crash that took the Dow Jones Industrial Average down -22.6% in a single day. He has published daily fact-based fundamental and technical analysis on high-ranked stocks online for two decades. Through FACTBASEDINVESTING.COM, Kenneth provides educational articles, news, market commentary, and other information regarding proven investment systems that work in good times and bad.
Comments contained in the body of this report are technical opinions only and are not necessarily those of Gruneisen Growth Corp. The material herein has been obtained from sources believed to be reliable and accurate, however, its accuracy and completeness cannot be guaranteed. Our firm, employees, and customers may effect transactions, including transactions contrary to any recommendation herein, or have positions in the securities mentioned herein or options with respect thereto. Any recommendation contained in this report may not be suitable for all investors and it is not to be deemed an offer or solicitation on our part with respect to the purchase or sale of any securities. |
|
 |
Financial, Tech, and Energy-Linked Groups Fell
Kenneth J. Gruneisen - Passed the CAN SLIM® Master's Exam
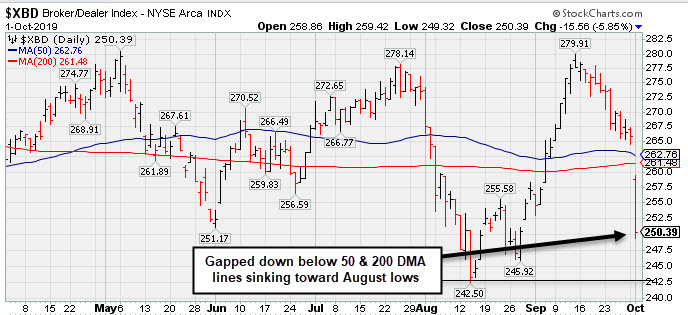
The Broker/Dealer Index ($XBD -5.85%) and the Bank Index ($BKX -2.59%) both ended the session solidly lower. The Retail Index ($RLX -0.16%) ended only slightly lower. The tech sector had a negative bias as the Semiconductor Index ($SOX -0.93%), Biotech Index ($BTK -1.63%), and the Networking Index ($NWX -1.86%) finished unanimously lower. Energy-linked groups also had a negative bias as the Oil Services Index ($OSX -3.41%) and the Integrated Oil Index ($XOI -1.87%) slumped. Meanwhile, the Gold & Silver Index ($XAU +0.16%) eked out a tiny gain.
PICTURED: The Broker/Dealer Index ($XBD -5.85%) gapped down and violated its 50-day and 200-day moving average (DMA) lines slumping toward its August low.
| Oil Services |
$OSX |
63.27 |
-2.23 |
-3.40% |
-21.50% |
| Integrated Oil |
$XOI |
1,186.19 |
-22.57 |
-1.87% |
+2.34% |
| Semiconductor |
$SOX |
1,544.20 |
-14.55 |
-0.93% |
+33.68% |
| Networking |
$NWX |
540.33 |
-15.93 |
-2.86% |
+10.57% |
| Broker/Dealer |
$XBD |
250.40 |
-15.56 |
-5.85% |
+5.50% |
| Retail |
$RLX |
2,344.06 |
-3.78 |
-0.16% |
+20.12% |
| Gold & Silver |
$XAU |
88.54 |
+0.14 |
+0.16% |
+25.30% |
| Bank |
$BKX |
97.44 |
-2.59 |
-2.59% |
+13.58% |
| Biotech |
$BTK |
4,146.91 |
-68.74 |
-1.63% |
-1.75% |
|
|
|
 |
Challenging Previously Stubborn Resistance
Kenneth J. Gruneisen - Passed the CAN SLIM® Master's Exam
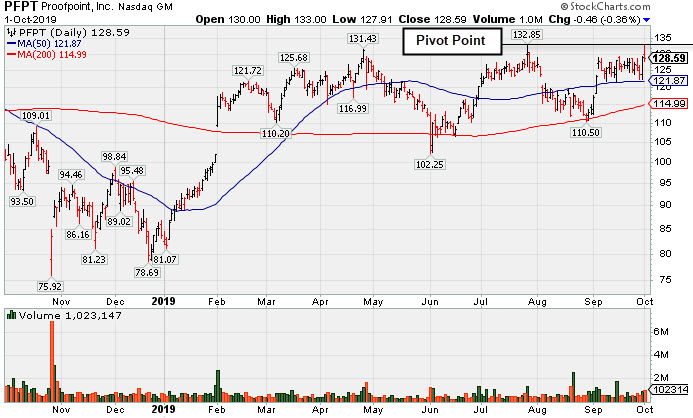
Proofpoint Inc (PFPT-$0.46 or -0.36% to $128.59) was highlighted in yellow with pivot point cited based on its 7/26/19 high in the earlier mid-day report (read here). It reversed into the red after touching a new all-time high today. The Computer Software-Security firm has met stubborn resistance in the $132 area in recent months. Subsequent gains above the pivot point backed by at least +40% above average volume may trigger a technical buy signal. yellow with pivot point cited based on its 7/26/19 high.
It has an Earnings Per Share Rating of 97. Prior mid-day reports noted - "Three of the past 4 quarterly comparisons through Jun '19 were above the +25% minimum earnings guideline (C criteria). Annual earnings (A criteria) history has been strong since turning profitable in FY '16 ".
The number of top-rated funds owning its shares rose from 517 in Dec '18 to 576 in Jun '19, a reassuring sign concerning the I criteria. Its current Up/Down Volume ration of 1.4 is an unbiased indication its shares have been under accumulation over the past 50 days. Its small supply of 56.1 million shares outstanding (S criteria) can contribute to greater price volatility in the event of institutional buying or selling.
|
|
|
Color Codes Explained :
Y - Better candidates highlighted by our
staff of experts.
G - Previously featured
in past reports as yellow but may no longer be buyable under the
guidelines.
***Last / Change / Volume data in this table is the closing quote data***
Symbol/Exchange
Company Name
Industry Group |
PRICE |
CHANGE
(%Change) |
Day High |
Volume
(% DAV)
(% 50 day avg vol) |
52 Wk Hi
% From Hi |
Featured
Date |
Price
Featured |
Pivot Featured |
|
Max Buy |
 MLR
-
NYSE
MLR
-
NYSE
Miller Industries Inc
AUTOMOTIVE - Auto Parts
|
$32.73
|
-0.57
-1.71% |
$33.78
|
28,063
80.18% of 50 DAV
50 DAV is 35,000
|
$35.26
-7.18%
|
9/24/2019
|
$34.00
|
PP = $35.36
|
|
MB = $37.13
|
Most Recent Note - 9/30/2019 5:13:27 PM
Y - Suffered another loss with above average volume today and finished near the session low. Subsequent gains above the pivot point backed by at least +40% above average volume may trigger a technical buy signal. Very little resistance remains due to overhead supply. Reported June '19 quarterly earnings +40% on +26% sales revenues versus the year ago period, and 3 of the past 4 comparisons were above the +25% minimum earnings guideline (C criteria).
>>> FEATURED STOCK ARTICLE : Encountered Distributional Pressure After Challenging Prior High - 9/24/2019 |
View all notes |
Set NEW NOTE alert |
Company Profile |
SEC
News |
Chart |
Request a new note
C
A
S
I |
CCBG
-
NASDAQ
Capital City Bk Gp
BANKING - Regional - Mid-Atlantic Banks
|
$26.71
|
-0.74
-2.70% |
$27.88
|
29,978
111.03% of 50 DAV
50 DAV is 27,000
|
$28.00
-4.61%
|
9/13/2019
|
$27.03
|
PP = $27.05
|
|
MB = $28.40
|
Most Recent Note - 9/27/2019 6:35:54 PM
Y - Stalled after hitting a new 52-week high on 9/20/19 with a solid gain above the pivot point backed by +339% above average volume triggering a technical buy signal. Prior highs define initial support to watch above its 50 DMA line ($25.33). See the latest FSU analysis for more details and a new annotated graph.
>>> FEATURED STOCK ARTICLE : Stalled After Recent Rally for New High - 9/27/2019 |
View all notes |
Set NEW NOTE alert |
Company Profile |
SEC
News |
Chart |
Request a new note
C
A
S
I |
EPAM
-
NYSE
Epam Systems Inc
COMPUTER SOFTWARE and SERVICES - Information Technology Service
|
$181.44
|
-0.88
-0.48% |
$183.99
|
218,434
64.06% of 50 DAV
50 DAV is 341,000
|
$201.00
-9.73%
|
5/9/2019
|
$169.25
|
PP = $180.55
|
|
MB = $189.58
|
Most Recent Note - 9/30/2019 5:09:31 PM
G - A rebound above its 50 DMA line ($188.31) is still needed for its outlook to improve. Prior lows in the $174-175 area define the next important support level. Reported earnings +27% on +24% sales revenues for the Jun '19 quarter. See the latest FSU analysis for more details and a new annotated graph.
>>> FEATURED STOCK ARTICLE : Slumped and Sputtered Below 50-Day Moving Average - 9/30/2019 |
View all notes |
Set NEW NOTE alert |
Company Profile |
SEC
News |
Chart |
Request a new note
C
A
S
I |
AUDC
-
NASDAQ
Audiocodes Ltd
ELECTRONICS - Scientific and Technical Instrum
|
$18.40
|
-0.51
-2.70% |
$18.80
|
443,449
190.32% of 50 DAV
50 DAV is 233,000
|
$22.50
-18.22%
|
9/13/2019
|
$19.68
|
PP = $19.84
|
|
MB = $20.83
|
 Most Recent Note - 10/1/2019 5:50:15 PM
G - Color code is changed to green after today's 6th consecutive loss was backed by higher volume and undercut its 50 DMA line ($18.53) raising greater concerns. Only a prompt rebound would help its outlook improve.
>>> FEATURED STOCK ARTICLE : Recent Spurt of Gains for New Highs Marked By Volume - 9/17/2019 |
View all notes |
Set NEW NOTE alert |
Company Profile |
SEC
News |
Chart |
Request a new note
C
A
S
I |
LHCG
-
NASDAQ
L H C Group Inc
HEALTH SERVICES - Home Health Care
|
$108.60
|
-4.96
-4.37% |
$114.36
|
309,305
142.34% of 50 DAV
50 DAV is 217,300
|
$129.37
-16.05%
|
7/1/2019
|
$110.94
|
PP = $122.20
|
|
MB = $128.31
|
Most Recent Note - 10/1/2019 5:48:06 PM
Violated its 200 DMA line ($112.28) with today's volume-driven loss. Its Relative Strength Rating has slumped to 61, well below the 80+ minimum guideline for buy candidates. A rebound above its 50 DMA line ($119.75) is needed to help its outlook. It will be dropped from the Featured Stocks list tonight.
>>> FEATURED STOCK ARTICLE : Testing 200-Day Average as Relatve Strength Fades - 9/26/2019 |
View all notes |
Set NEW NOTE alert |
Company Profile |
SEC
News |
Chart |
Request a new note
C
A
S
I |
Symbol/Exchange
Company Name
Industry Group |
PRICE |
CHANGE
(%Change) |
Day High |
Volume
(% DAV)
(% 50 day avg vol) |
52 Wk Hi
% From Hi |
Featured
Date |
Price
Featured |
Pivot Featured |
|
Max Buy |
CHDN
-
NASDAQ
Churchill Downs Inc
LEISURE - Gaming Activities
|
$122.97
|
-0.49
-0.39% |
$125.05
|
153,116
65.16% of 50 DAV
50 DAV is 235,000
|
$132.73
-7.35%
|
7/22/2019
|
$118.45
|
PP = $118.89
|
|
MB = $124.83
|
Most Recent Note - 9/30/2019 5:14:25 PM
Y - Consolidating near its 50 DMA line ($121.68). That important short-term average has acted as support in recent weeks during its consolidation. Prior lows define the next important support to watch. Jun '19 earnings +10% on +26% sales revenues versus the year ago period were below the +25% minimum earnings guideline (C criteria), noted recently raising fundamental concerns.
>>> FEATURED STOCK ARTICLE : Consolidating Above 50-Day Moving Average Line - 9/20/2019 |
View all notes |
Set NEW NOTE alert |
Company Profile |
SEC
News |
Chart |
Request a new note
C
A
S
I |
LULU
-
NASDAQ
Lululemon Athletica
MANUFACTURING - Textile Manufacturing
|
$192.69
|
+0.16
0.08% |
$194.07
|
1,317,645
74.82% of 50 DAV
50 DAV is 1,761,000
|
$204.44
-5.75%
|
9/6/2019
|
$201.25
|
PP = $194.35
|
|
MB = $204.07
|
Most Recent Note - 9/30/2019 5:11:25 PM
Y - Recently sputtering below the prior high ($194.25) raising concerns. Its 50 DMA line ($187.12) defines important near-term support to watch.
>>> FEATURED STOCK ARTICLE : Consolidating Near Prior High Following Latest Breakout - 9/18/2019 |
View all notes |
Set NEW NOTE alert |
Company Profile |
SEC
News |
Chart |
Request a new note
C
A
S
I |
CPRT
-
NASDAQ
Copart Inc
SPECIALTY RETAIL - Auto Dealerships
|
$79.53
|
-0.80
-1.00% |
$81.06
|
1,945,834
143.29% of 50 DAV
50 DAV is 1,358,000
|
$83.70
-4.98%
|
9/5/2019
|
$79.13
|
PP = $79.84
|
|
MB = $83.83
|
Most Recent Note - 9/30/2019 5:08:26 PM
Y - Consolidating above its prior high ($79.74 on 7/26/19) and 50 DMA line ($78.06). More damaging losses would raise concerns and trigger technical sell signals. Remains perched near its all-time high. Fundamentals are strong.
>>> FEATURED STOCK ARTICLE : Hovering Near All-Time High Following Recent Breakout - 9/19/2019 |
View all notes |
Set NEW NOTE alert |
Company Profile |
SEC
News |
Chart |
Request a new note
C
A
S
I |
PFPT
-
NASDAQ
Proofpoint Inc
Computer Sftwr-Security
|
$128.59
|
-0.46
-0.36% |
$133.00
|
1,016,816
154.53% of 50 DAV
50 DAV is 658,000
|
$132.85
-3.21%
|
10/1/2019
|
$129.59
|
PP = $132.95
|
|
MB = $139.60
|
Most Recent Note - 10/1/2019 5:45:14 PM
Y - Finished the session lower after highlighted in yellow with pivot point cited based on its 7/26/19 high. Reversed into the red after touching a new all-time high today. Met stubborn resistance in the $132 area in recent months. Subsequent gains above the pivot point backed by at least +40% above average volume may trigger a technical buy signal. Prior mid-day reports noted - "Three of the past 4 quarterly comparisons through Jun '19 were above the +25% minimum earnings guideline (C criteria). Annual earnings (A criteria) history has been strong since turning profitable in FY '16 ". See the latest FSU analysis for more details and a new annotated graph.
>>> FEATURED STOCK ARTICLE : Challenging Previously Stubborn Resistance - 10/1/2019 |
View all notes |
Set NEW NOTE alert |
Company Profile |
SEC
News |
Chart |
Request a new note
C
A
S
I |
BLD
-
NYSE
Topbuild Corp
Bldg-Constr Prds/Misc
|
$94.80
|
-1.63
-1.69% |
$96.98
|
196,260
66.30% of 50 DAV
50 DAV is 296,000
|
$97.99
-3.26%
|
5/17/2019
|
$82.19
|
PP = $87.31
|
|
MB = $91.68
|
Most Recent Note - 9/30/2019 12:21:23 PM
G - Perched near its all-time high, extended from the prior base after wedging higher with gains lacking great volume conviction. Earnings rose +39% on +9% sales revenues for the Jun '19 quarter versus the year ago period. Its 50 DMA line ($90.12) defines important support to watch along with its prior low ($86.53 on 8/28/19).
>>> FEATURED STOCK ARTICLE : Perched Near Record High, Extended From Prior Base - 9/23/2019 |
View all notes |
Set NEW NOTE alert |
Company Profile |
SEC
News |
Chart |
Request a new note
C
A
S
I |
Symbol/Exchange
Company Name
Industry Group |
PRICE |
CHANGE
(%Change) |
Day High |
Volume
(% DAV)
(% 50 day avg vol) |
52 Wk Hi
% From Hi |
Featured
Date |
Price
Featured |
Pivot Featured |
|
Max Buy |
PAGS
-
NYSE
Pagseguro Digital Cl A
Finance-CrdtCard/PmtPr
|
$46.18
|
-0.13
-0.28% |
$48.16
|
1,586,528
82.98% of 50 DAV
50 DAV is 1,912,000
|
$53.43
-13.57%
|
6/25/2019
|
$37.69
|
PP = $40.07
|
|
MB = $42.07
|
Most Recent Note - 9/27/2019 6:39:06 PM
G - Slumped below its 50 DMA line ($47.51) with a big loss today on higher volume yet the total was below average. Prior lows in the $42-43 area define important near-term chart support to watch where violations may trigger a worrisome technical sell signal. Fundamentals are strong.
>>> FEATURED STOCK ARTICLE : Recent Lows Define Important Near-Term Support While Consolidating - 9/25/2019 |
View all notes |
Set NEW NOTE alert |
Company Profile |
SEC
News |
Chart |
Request a new note
C
A
S
I |
|
|
|
THESE ARE NOT BUY RECOMMENDATIONS!
Comments contained in the body of this report are technical
opinions only. The material herein has been obtained
from sources believed to be reliable and accurate, however,
its accuracy and completeness cannot be guaranteed.
This site is not an investment advisor, hence it does
not endorse or recommend any securities or other investments.
Any recommendation contained in this report may not
be suitable for all investors and it is not to be deemed
an offer or solicitation on our part with respect to
the purchase or sale of any securities. All trademarks,
service marks and trade names appearing in this report
are the property of their respective owners, and are
likewise used for identification purposes only.
This report is a service available
only to active Paid Premium Members.
You may opt-out of receiving report notifications
at any time. Questions or comments may be submitted
by writing to Premium Membership Services 665 S.E. 10 Street, Suite 201 Deerfield Beach, FL 33441-5634 or by calling 1-800-965-8307
or 954-785-1121.
|
|
|