You are not logged in.
This means you
CAN ONLY VIEW reports that were published prior to Thursday, April 17, 2025.
You
MUST UPGRADE YOUR MEMBERSHIP if you want to see any current reports.
AFTER MARKET UPDATE - TUESDAY, OCTOBER 8TH, 2019
Previous After Market Report Next After Market Report >>>
|
|
|
|
DOW |
-313.98 |
26,164.04 |
-1.19% |
|
Volume |
805,674,910 |
-4% |
|
Volume |
1,927,903,970 |
+11% |
|
NASDAQ |
-132.47 |
7,823.82 |
-1.66% |
|
Advancers |
686 |
26% |
|
Advancers |
666 |
22% |
|
S&P 500 |
-45.73 |
2,893.06 |
-1.56% |
|
Decliners |
1,926 |
74% |
|
Decliners |
2,416 |
78% |
|
Russell 2000 |
-25.19 |
1,472.60 |
-1.68% |
|
52 Wk Highs |
67 |
|
|
52 Wk Highs |
19 |
|
|
S&P 600 |
-16.07 |
912.64 |
-1.73% |
|
52 Wk Lows |
94 |
|
|
52 Wk Lows |
132 |
|
|
 |
Breadth Negative as Major Indices Slump Again Decisively
Kenneth J. Gruneisen - Passed the CAN SLIM® Master's Exam
The Dow retreated 313 points, while the S&P 500 lost 1.6%. The Nasdaq Composite was down 1.7%. Volume totals reported were mixed, higher than the prior session total on the Nasdaq exchange and lighter on the NYSE. Breadth was negative as decliners led advancers by almost 3-1 on the NYSE and by nearly 4-1 on the Nasdaq exchange. There were only 5 high-ranked companies from the Leaders List that hit a new 52-week high and were listed on the BreakOuts Page, versus the total of 15 on the prior session. New 52-week lows outnumbered new 52-week highs on the Nasdaq exchange and on the NYSE. The uptrend for the major indices (M criteria) has recently come under greater pressure, having the look of a more serious correction. Disciplined investors know to reduce exposure to stocks during market corrections. The Featured Stocks Page provides the most timely analysis on high-ranked leaders. Charts used courtesy of www.stockcharts.com
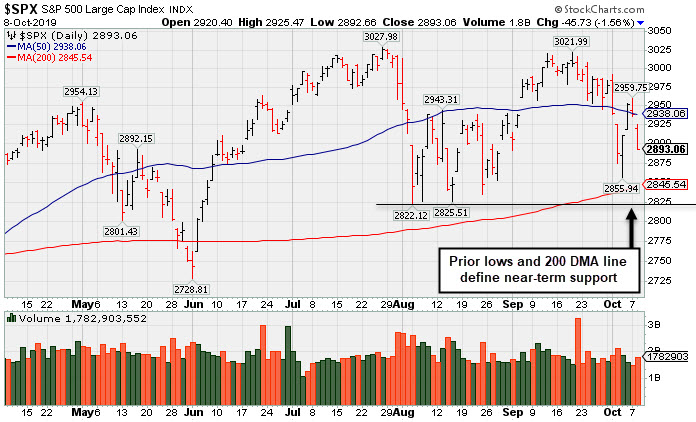
PICTURED: The S&P 500 Index's prior low and its 200-day moving average (DMA) line define important near-term support to watch. More damaging losses may bode poorly for the market outlook. Meanwhile, it remains perched only -4.4% off its record high.
Stocks finished lower Tuesday as investors digested a series of downbeat geopolitical news. The Trump Administration announced the addition of 28 Chinese entities to a blacklist, including several Tech giants. Human rights violations were cited as the catalyst, with the U.S. subsequently implementing visa bans on Chinese officials associated with the alleged abuses. Meanwhile, reports indicated the White House is considering limiting Chinese investments in government pension funds. The raft of headlines coincided with the second day of mid-level trade negotiations between Washington and Beijing, with high-level talks slated for Thursday.
All 11 S&P 500 sectors ended in negative territory, with Financials leading decliners. The Philadelphia Semiconductor Index dropped more than 3%, as U.S.-China tensions pressured Tech shares. In corporate news, Boeing (BA -0.6%) fell on worries that heightened European safety concerns could further delay the 737 MAX aircraft’s return to operation.
In central bank news, Federal Reserve Chair Jerome Powell noted that the Fed will soon resume the purchase of short-term government securities. He reiterated that this would not be a return to quantitative easing, but only meant to prevent the money market volatility seen last month. Treasuries strengthened, with the yield on the 10-year note down two basis points to 1.53%. On the data front, the NFIB’s small business optimism index fell to 101.8 last month, the lowest since March. Separately, core producer prices fell 0.3% in September, posting the largest monthly decline in more than four years. In commodities, WTI crude dipped 0.2% to $52.63/barrel.
|
 Kenneth J. Gruneisen started out as a licensed stockbroker in August 1987, a couple of months prior to the historic stock market crash that took the Dow Jones Industrial Average down -22.6% in a single day. He has published daily fact-based fundamental and technical analysis on high-ranked stocks online for two decades. Through FACTBASEDINVESTING.COM, Kenneth provides educational articles, news, market commentary, and other information regarding proven investment systems that work in good times and bad.
Comments contained in the body of this report are technical opinions only and are not necessarily those of Gruneisen Growth Corp. The material herein has been obtained from sources believed to be reliable and accurate, however, its accuracy and completeness cannot be guaranteed. Our firm, employees, and customers may effect transactions, including transactions contrary to any recommendation herein, or have positions in the securities mentioned herein or options with respect thereto. Any recommendation contained in this report may not be suitable for all investors and it is not to be deemed an offer or solicitation on our part with respect to the purchase or sale of any securities. |
|
 |
Financial, Retail, Tech, and Energy-Linked Groups Fell
Kenneth J. Gruneisen - Passed the CAN SLIM® Master's Exam
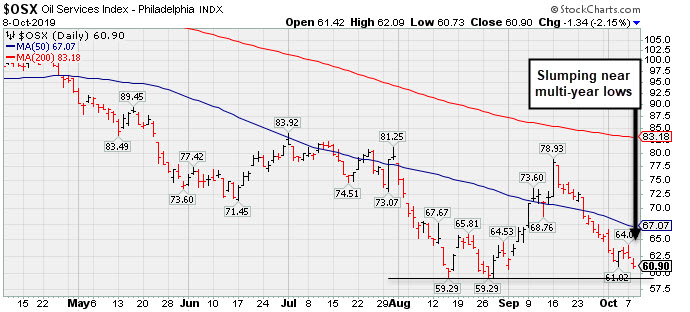
The Broker/Dealer Index ($XBD -1.59%), Bank Index ($BKX -2.41%) and the Retail Index ($RLX -1.04%) suffered unanimous losses. The tech sector had a negative bias as the Semiconductor Index ($SOX -3.12%) and Biotech Index ($BTK -2.57%) both outpaced the Networking Index ($NWX -1.68%) to the downside. Commodity-linked groups were mixed as the Oil Services Index ($OSX -2.15%) and Integrated Oil Index ($XOI -1.35%) fell, meanwhile, the Gold & Silver Index ($XAU +2.29%) was a standout gainer.
PICTURED: The Oil Services Index ($OSX -2.15%) is slumping near multi-year lows after 14 losses in the span of 16 sessions.
| Oil Services |
$OSX |
60.90 |
-1.34 |
-2.15% |
-24.44% |
| Integrated Oil |
$XOI |
1,151.58 |
-15.76 |
-1.35% |
-0.65% |
| Semiconductor |
$SOX |
1,514.45 |
-48.72 |
-3.12% |
+31.10% |
| Networking |
$NWX |
538.33 |
-9.18 |
-1.68% |
+10.16% |
| Broker/Dealer |
$XBD |
243.09 |
-3.92 |
-1.59% |
+2.42% |
| Retail |
$RLX |
2,300.84 |
-24.11 |
-1.04% |
+17.91% |
| Gold & Silver |
$XAU |
92.36 |
+2.07 |
+2.29% |
+30.71% |
| Bank |
$BKX |
94.59 |
-2.34 |
-2.41% |
+10.26% |
| Biotech |
$BTK |
4,098.37 |
-108.26 |
-2.57% |
-2.90% |
|
|
|
 |
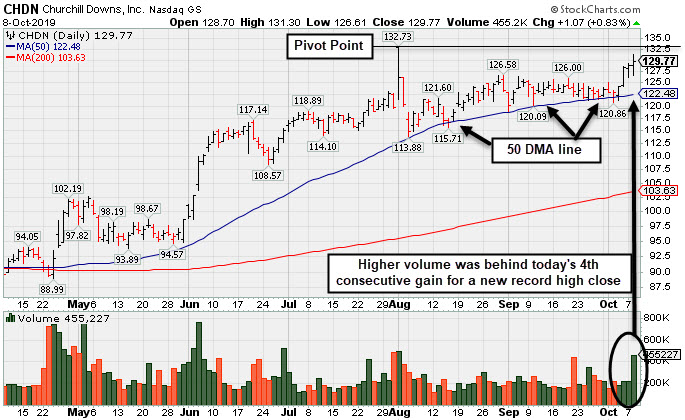
Volume-Driven Gain for Record High Close
Kenneth J. Gruneisen - Passed the CAN SLIM® Master's Exam
Churchill Downs Inc (CHDN +$1.07 or +0.83% to $129.77) tallied a 4th consecutive gain with higher volume today and finished at a record high close. It is perched within close striking distance of its all-time high. A new pivot point is cited based on its 8/01/19 high plus 10 cents. Subsequent gains above the pivot point backed by at least +40% above average volume may trigger a new (or add-on) technical buy signal.
CHDN found support when consolidating near its 50 DMA line ($122.48) in recent weeks. That important short-term average and prior lows define important support levels to watch.
Keep in mind that it is due to report earnings news on 10/29/19. Volume and volatility often increase near earnings news. Jun '19 earnings +10% on +26% sales revenues versus the year ago period were below the +25% minimum earnings guideline (C criteria), noted recently as the results raised fundamental concerns. It still has an Earnings Per Share Rating of 95.
The L criteria of the fact-based investment system guides investors toward buying leading stocks that are in leading industry groups. The Leisure - Gaming/Equipment industry group has a Group Relative Strength Rating of C-.
CHDN was highlighted in yellow in the 6/05/19 mid-day report (read here). It was last shown in this FSU section on 9/20/19 with an annotated graph under the headline, "Consolidating Above 50-Day Moving Average Line". Annual earnings (A criteria) growth has been strong since a downturn in FY '14.
The number of top-rated funds owning its shares rose from 333 in Jun '17 to 449 in Sep '19, a reassuring sign concerning the I criteria. Its current Up/Down Volume Ratio of 1.2 is an unbiased indication its shares have been under accumulation over the past 50 days. It has a small supply of 35.2 million shares (S criteria) outstanding following a 3:1 split effective 1/28/19, and this small supply can contribute to greater price volatility in the event of institutional buying or selling.
|
|
|
Color Codes Explained :
Y - Better candidates highlighted by our
staff of experts.
G - Previously featured
in past reports as yellow but may no longer be buyable under the
guidelines.
***Last / Change / Volume data in this table is the closing quote data***
Symbol/Exchange
Company Name
Industry Group |
PRICE |
CHANGE
(%Change) |
Day High |
Volume
(% DAV)
(% 50 day avg vol) |
52 Wk Hi
% From Hi |
Featured
Date |
Price
Featured |
Pivot Featured |
|
Max Buy |
 MLR
-
NYSE
MLR
-
NYSE
Miller Industries Inc
AUTOMOTIVE - Auto Parts
|
$30.96
|
-0.27
-0.86% |
$31.20
|
24,399
69.91% of 50 DAV
50 DAV is 34,900
|
$35.26
-12.20%
|
9/24/2019
|
$34.00
|
PP = $35.36
|
|
MB = $37.13
|
Most Recent Note - 10/4/2019 5:39:13 PM
G - Color code is changed to green after suffering a 7th consecutive loss and slumping below its 50 DMA line ($32.24). A rebound and subsequent gains above the pivot point backed by at least +40% above average volume may trigger a technical buy signal. Reported June '19 quarterly earnings +40% on +26% sales revenues versus the year ago period, and 3 of the past 4 comparisons were above the +25% minimum earnings guideline (C criteria).
>>> FEATURED STOCK ARTICLE : Encountered Distributional Pressure After Challenging Prior High - 9/24/2019 |
View all notes |
Set NEW NOTE alert |
Company Profile |
SEC
News |
Chart |
Request a new note
C
A
S
I |
CCBG
-
NASDAQ
Capital City Bk Gp
BANKING - Regional - Mid-Atlantic Banks
|
$26.18
|
-0.39
-1.47% |
$26.53
|
23,753
84.83% of 50 DAV
50 DAV is 28,000
|
$28.00
-6.50%
|
9/13/2019
|
$27.03
|
PP = $27.05
|
|
MB = $28.40
|
Most Recent Note - 10/4/2019 5:31:09 PM
Y - Hovering near its 52-week high. Prior highs define initial support to watch above its 50 DMA line ($25.48).
>>> FEATURED STOCK ARTICLE : Stalled After Recent Rally for New High - 9/27/2019 |
View all notes |
Set NEW NOTE alert |
Company Profile |
SEC
News |
Chart |
Request a new note
C
A
S
I |
EPAM
-
NYSE
Epam Systems Inc
COMPUTER SOFTWARE and SERVICES - Information Technology Service
|
$184.51
|
-5.52
-2.90% |
$188.65
|
275,000
76.82% of 50 DAV
50 DAV is 358,000
|
$201.00
-8.20%
|
5/9/2019
|
$169.25
|
PP = $180.55
|
|
MB = $189.58
|
 Most Recent Note - 10/8/2019 5:52:43 PM
G - Slumped back below its 50 DMA line ($186.83) again hurting its outlook. Faces resistance due to overhead supply up to the $201 level. Prior lows in the $174-175 area define the next important support level. Reported earnings +27% on +24% sales revenues for the Jun '19 quarter.
>>> FEATURED STOCK ARTICLE : Slumped and Sputtered Below 50-Day Moving Average - 9/30/2019 |
View all notes |
Set NEW NOTE alert |
Company Profile |
SEC
News |
Chart |
Request a new note
C
A
S
I |
AUDC
-
NASDAQ
Audiocodes Ltd
ELECTRONICS - Scientific and Technical Instrum
|
$17.60
|
-0.92
-4.97% |
$18.41
|
151,267
72.72% of 50 DAV
50 DAV is 208,000
|
$22.50
-21.78%
|
9/13/2019
|
$19.68
|
PP = $19.84
|
|
MB = $20.83
|
Most Recent Note - 10/8/2019 5:49:16 PM
G - Color code is changed to green after slumping back below its 50 DMA line ($18.51) again. Prior lows in the $16.50 area define the next important support.
>>> FEATURED STOCK ARTICLE : Sank Below 50-Day Average as 7 Straight Losses Follow Reversal - 10/2/2019 |
View all notes |
Set NEW NOTE alert |
Company Profile |
SEC
News |
Chart |
Request a new note
C
A
S
I |
CHDN
-
NASDAQ
Churchill Downs Inc
LEISURE - Gaming Activities
|
$129.77
|
+1.07
0.83% |
$131.30
|
455,423
198.01% of 50 DAV
50 DAV is 230,000
|
$132.73
-2.23%
|
10/8/2019
|
$129.77
|
PP = $132.83
|
|
MB = $139.47
|
Most Recent Note - 10/8/2019 5:47:18 PM
Y - Color code is changed to yellow with new pivot point cited based on its 8/01/19 high plus 10 cents. Posted a 4th consecutive gain with higher volume today and finished at a record high close while challenging its all-time high. Subsequent gains above the pivot point backed by at least +40% above average volume may trigger a new (or add-on) technical buy signal. Its 50 DMA line ($122.48) acted as support in recent weeks during its consolidation. Jun '19 earnings +10% on +26% sales revenues versus the year ago period were below the +25% minimum earnings guideline (C criteria), noted recently raising fundamental concerns. See the latest FSU analysis for more details and a new annotated graph.
>>> FEATURED STOCK ARTICLE : Volume-Driven Gain for Record High Close - 10/8/2019 |
View all notes |
Set NEW NOTE alert |
Company Profile |
SEC
News |
Chart |
Request a new note
C
A
S
I |
Symbol/Exchange
Company Name
Industry Group |
PRICE |
CHANGE
(%Change) |
Day High |
Volume
(% DAV)
(% 50 day avg vol) |
52 Wk Hi
% From Hi |
Featured
Date |
Price
Featured |
Pivot Featured |
|
Max Buy |
LULU
-
NASDAQ
Lululemon Athletica
MANUFACTURING - Textile Manufacturing
|
$191.37
|
-0.29
-0.15% |
$194.24
|
1,150,503
64.27% of 50 DAV
50 DAV is 1,790,000
|
$204.44
-6.39%
|
9/6/2019
|
$201.25
|
PP = $194.35
|
|
MB = $204.07
|
Most Recent Note - 10/7/2019 5:57:49 PM
Y - Found support at its 50 DMA line ($187.23) but recently sputtering below the prior high ($194.25) raising concerns. More damaging losses would raise serious concerns and trigger a technical sell signal.
>>> FEATURED STOCK ARTICLE : Found Support After Undercutting 50-Day Moving Average - 10/3/2019 |
View all notes |
Set NEW NOTE alert |
Company Profile |
SEC
News |
Chart |
Request a new note
C
A
S
I |
CPRT
-
NASDAQ
Copart Inc
SPECIALTY RETAIL - Auto Dealerships
|
$80.15
|
+0.39
0.49% |
$80.84
|
1,216,045
82.78% of 50 DAV
50 DAV is 1,469,000
|
$83.70
-4.24%
|
9/5/2019
|
$79.13
|
PP = $79.84
|
|
MB = $83.83
|
Most Recent Note - 10/4/2019 5:28:26 PM
G - Found prompt support and rebounded above its 50 DMA line ($78.06) and back above its pivot point helping its outlook improve. See the latest FSU analysis for more details and a new annotated graph.
>>> FEATURED STOCK ARTICLE : Found Prompt Support Near 50-Day Moving Average - 10/4/2019 |
View all notes |
Set NEW NOTE alert |
Company Profile |
SEC
News |
Chart |
Request a new note
C
A
S
I |
PFPT
-
NASDAQ
Proofpoint Inc
Computer Sftwr-Security
|
$125.05
|
-5.19
-3.98% |
$130.54
|
1,039,270
150.62% of 50 DAV
50 DAV is 690,000
|
$133.00
-5.98%
|
10/1/2019
|
$129.59
|
PP = $132.95
|
|
MB = $139.60
|
Most Recent Note - 10/8/2019 5:51:10 PM
Y - Retreated from its all-time high with another volume-driven loss today. Its 50 DMA line ($121.91) defines near-term support. Met stubborn resistance in the $132 area in recent months. Subsequent gains above the pivot point backed by at least +40% above average volume may trigger a technical buy signal.
>>> FEATURED STOCK ARTICLE : Challenging Previously Stubborn Resistance - 10/1/2019 |
View all notes |
Set NEW NOTE alert |
Company Profile |
SEC
News |
Chart |
Request a new note
C
A
S
I |
BLD
-
NYSE
Topbuild Corp
Bldg-Constr Prds/Misc
|
$95.45
|
+0.04
0.04% |
$96.61
|
206,587
68.86% of 50 DAV
50 DAV is 300,000
|
$97.99
-2.59%
|
5/17/2019
|
$82.19
|
PP = $87.31
|
|
MB = $91.68
|
Most Recent Note - 10/4/2019 5:34:58 PM
G - Posted a quiet gain, staying above its 50 DMA line and challenging its all-time high. It is extended from the prior base after wedging higher with gains lacking great volume conviction. Earnings rose +39% on +9% sales revenues for the Jun '19 quarter versus the year ago period. Its 50 DMA line ($91.26) defines important support to watch along with its prior low ($86.53 on 8/28/19).
>>> FEATURED STOCK ARTICLE : Near High After Finding Support at 50-Day Average - 10/7/2019 |
View all notes |
Set NEW NOTE alert |
Company Profile |
SEC
News |
Chart |
Request a new note
C
A
S
I |
PAGS
-
NYSE
Pagseguro Digital Cl A
Finance-CrdtCard/PmtPr
|
$44.27
|
-1.22
-2.68% |
$45.28
|
707,194
38.60% of 50 DAV
50 DAV is 1,832,000
|
$53.43
-17.14%
|
6/25/2019
|
$37.69
|
PP = $40.07
|
|
MB = $42.07
|
Most Recent Note - 10/7/2019 5:55:25 PM
G - A rebound above the 50 DMA line ($47.36) is needed for its outlook to improve. Recently testing prior lows in the $42-43 area noted as important near-term chart support to watch where violations may trigger a worrisome technical sell signal.
>>> FEATURED STOCK ARTICLE : Recent Lows Define Important Near-Term Support While Consolidating - 9/25/2019 |
View all notes |
Set NEW NOTE alert |
Company Profile |
SEC
News |
Chart |
Request a new note
C
A
S
I |
Symbol/Exchange
Company Name
Industry Group |
PRICE |
CHANGE
(%Change) |
Day High |
Volume
(% DAV)
(% 50 day avg vol) |
52 Wk Hi
% From Hi |
Featured
Date |
Price
Featured |
Pivot Featured |
|
Max Buy |
|
|
|
THESE ARE NOT BUY RECOMMENDATIONS!
Comments contained in the body of this report are technical
opinions only. The material herein has been obtained
from sources believed to be reliable and accurate, however,
its accuracy and completeness cannot be guaranteed.
This site is not an investment advisor, hence it does
not endorse or recommend any securities or other investments.
Any recommendation contained in this report may not
be suitable for all investors and it is not to be deemed
an offer or solicitation on our part with respect to
the purchase or sale of any securities. All trademarks,
service marks and trade names appearing in this report
are the property of their respective owners, and are
likewise used for identification purposes only.
This report is a service available
only to active Paid Premium Members.
You may opt-out of receiving report notifications
at any time. Questions or comments may be submitted
by writing to Premium Membership Services 665 S.E. 10 Street, Suite 201 Deerfield Beach, FL 33441-5634 or by calling 1-800-965-8307
or 954-785-1121.
|
|
|