You are not logged in.
This means you
CAN ONLY VIEW reports that were published prior to Saturday, April 5, 2025.
You
MUST UPGRADE YOUR MEMBERSHIP if you want to see any current reports.
AFTER MARKET UPDATE - TUESDAY, AUGUST 30TH, 2022
Previous After Market Report Next After Market Report >>>
|
|
|
|
DOW |
-308.12 |
31,790.87 |
-0.96% |
|
Volume |
819,662,848 |
+15% |
|
Volume |
4,622,060,500 |
+11% |
|
NASDAQ |
-134.53 |
11,883.14 |
-1.12% |
|
Advancers |
631 |
21% |
|
Advancers |
1,328 |
33% |
|
S&P 500 |
-44.45 |
3,986.16 |
-1.10% |
|
Decliners |
2,418 |
79% |
|
Decliners |
2,734 |
67% |
|
Russell 2000 |
-27.35 |
1,855.59 |
-1.45% |
|
52 Wk Highs |
12 |
|
|
52 Wk Highs |
19 |
|
|
S&P 600 |
-18.06 |
1,195.79 |
-1.49% |
|
52 Wk Lows |
147 |
|
|
52 Wk Lows |
259 |
|
|
 |
Leadership Wanes as Market Averages Endure More Pressure
Kenneth J. Gruneisen - Passed the CAN SLIM® Master's Exam
The S&P 500 fell 1.1%, closing below the 4,000 level for the first time in a month. The Dow lost 308 points, while the Nasdaq Composite slid 1.1%. The volume totals reported were higher than the prior session on the NYSE and on the Nasdaq exchange, indicative of greater institutional selling pressure. Breadth was clearly negative as decliners led advancers by almost a 4-1 margin on the NYSE and by more than 2-1 on the Nasdaq exchange. There were 0 high-ranked companies from the Leaders List that hit new 52-week highs and were listed on the BreakOuts Page, versus the total of 3 on the prior session. New 52-week lows totals expanded and outnumbered shrinking new 52-week highs on the NYSE and on the Nasdaq exchange. The market uptrend is now under pressure (M criteria). Any sustainable rally requires a healthy crop of leading stocks hitting new highs.
Chart courtesy of www.stockcharts.com%20on%20Tuesday.%20Yesterday,%20the%20broad%20benchmark%20eclipsed%20the%204,300%20level%20for%20the%20first%20time%20since%20late%20April.%20The%20Nasdaq%20Composite%20fell%201.3%%20amid%20weakness%20in%20mega-cap%20tech%20shares.%20The%20volume%20totals%20reported%20were%20mixed,%20lighter%20than%20the%20prior%20session%20on%20the%20NYSE%20and%20higher%20on%20the%20Nasdaq%20exchange.%20Decliners%20led%20advancers%20by%20a%204-1%20margin%20on%20the%20NYSE%20ad%20by%20a%203-1%20margin%20on%20the%20Nasdaq%20exchange.%20There%20were%2017%20high-ranked%20companies%20from%20the%20Leaders%20List%20that%20hit%20new%2052-week%20highs%20and%20were%20listed%20on%20the%20BreakOuts%20Page,%20down%20from%20the%20total%20of%2045%20on%20the%20prior%20session.%20New%2052-week%20highs%20outnumbered%20new%2052-week%20lows%20on%20the%20NYSE,%20but%20new%20lows%20outnumbered%20new%20highs%20on%20the%20Nasdaq%20exchange.%20The%20market%20is%20in%20a%20confirmed%20uptrend%20(M%20criteria).%20Any%20sustainable%20rally%20requires%20a%20healthy%20crop%20of%20leading%20stocks%20hitting%20new%20highs,%20so%20the%20recent%20improvement%20in%20leadership%20was%20a%20reassuring%20sign.) 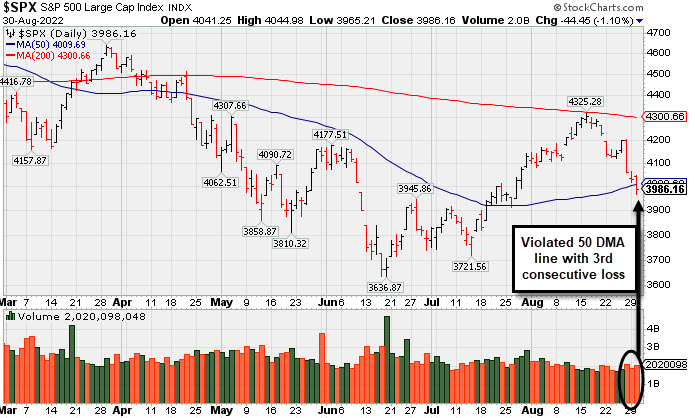 PICTURED: The S&P 500 Index violated its 50-day moving average (DMA) line with an increase in volume behind its third consecutive loss. Its rebound met resistance right at its 200 DMA line in recent weeks.
U.S. stocks finished lower on Tuesday, marking the third-straight day of declines for the major averages. Sentiment remained pressured by a parade of Federal Reserve (Fed) commentary reiterating the need for further interest rate hikes to tame elevated inflation. The latest remarks came from New York Fed President John Williams, who repeated calls for more restrictive monetary policy to slow demand, stating “we’re not there yet.”
Meanwhile, economic data was also in focus. The Conference Board’s gauge of consumer confidence improved more than expected in August to a three-month high of 103.2. Separately, the Jobs Openings and Labor Turnover Survey (JOLTS) showed available positions unexpectedly increased to 11.2 million in July. The report underscored a tight labor market that could continue putting upward pressure on wage inflation. Following the update, the yield on the more Fed-sensitive two-year Treasury note briefly touched 3.49%, a peak not seen since 2007. The yield on the 10-year note settled one basis point (0.01%) higher at 3.11%, on track to have climbed 0.45% since the end of July. In other data, S&P CoreLogic Case Shiller’s measure of home prices in 20 U.S. cities eased more than forecasted in June to reflect a year-over-year growth rate of 18.65%.
All 11 S&P 500 sectors ended in negative territory, with Energy leading the downturn amid a drop in oil prices. West Texas Intermediate crude retreated 5% to $92.14/barrel as demand concerns overshadowed the possibility of the Organization of Petroleum Exporting Countries and its allies (OPEC+) production cuts. |
 Kenneth J. Gruneisen started out as a licensed stockbroker in August 1987, a couple of months prior to the historic stock market crash that took the Dow Jones Industrial Average down -22.6% in a single day. He has published daily fact-based fundamental and technical analysis on high-ranked stocks online for two decades. Through FACTBASEDINVESTING.COM, Kenneth provides educational articles, news, market commentary, and other information regarding proven investment systems that work in good times and bad.
Comments contained in the body of this report are technical opinions only and are not necessarily those of Gruneisen Growth Corp. The material herein has been obtained from sources believed to be reliable and accurate, however, its accuracy and completeness cannot be guaranteed. Our firm, employees, and customers may effect transactions, including transactions contrary to any recommendation herein, or have positions in the securities mentioned herein or options with respect thereto. Any recommendation contained in this report may not be suitable for all investors and it is not to be deemed an offer or solicitation on our part with respect to the purchase or sale of any securities. |
|
 |
Commodity-Linked Groups Led Widespread Losses
Kenneth J. Gruneisen - Passed the CAN SLIM® Master's Exam
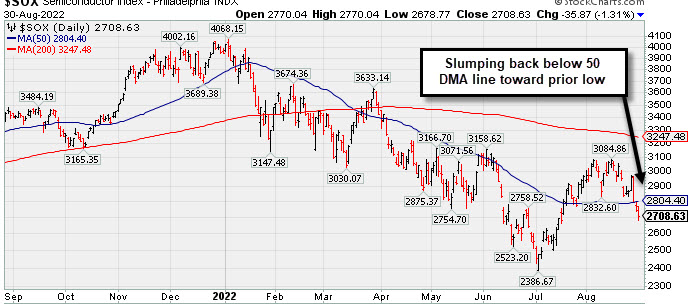
The Retail Index ($RLX -0.77%) and Broker/Dealer Index ($XBD -0.79%) both fell modestly and created a drag on the major averages while the Bank Index ($BKX -0.14%) ended with a smaller loss. The Semiconductor Index ($SOX -1.31%) led the tech sector lower, followed by the Networking Index ($NWX -0.76%) and the Biotech Index ($BTK -0.66%). Commodity-linked groups clearly had a negative bias as the Oil Services Index ($OSX -4.83%) and Integrated Oil Index ($XOI -3.58%) both outpaced the Gold & Silver Index ($XAU -2.83%) to the downside.
PICTURED: The Semiconductor Index ($SOX -1.31%) is slumping back below its 50-day moving average (DMA) line toward the prior low.
| Oil Services |
$OSX |
69.42 |
-3.52 |
-4.83% |
+31.67% |
| Integrated Oil |
$XOI |
1,666.99 |
-61.96 |
-3.58% |
+41.49% |
| Semiconductor |
$SOX |
2,708.63 |
-35.87 |
-1.31% |
-31.36% |
| Networking |
$NWX |
815.69 |
-6.21 |
-0.76% |
-16.00% |
| Broker/Dealer |
$XBD |
440.42 |
-3.49 |
-0.79% |
-9.54% |
| Retail |
$RLX |
3,259.59 |
-25.31 |
-0.77% |
-22.88% |
| Gold & Silver |
$XAU |
99.61 |
-2.90 |
-2.83% |
-24.80% |
| Bank |
$BKX |
106.58 |
-0.15 |
-0.14% |
-19.40% |
| Biotech |
$BTK |
4,667.23 |
-30.93 |
-0.66% |
-15.42% |
|
|
|
 |
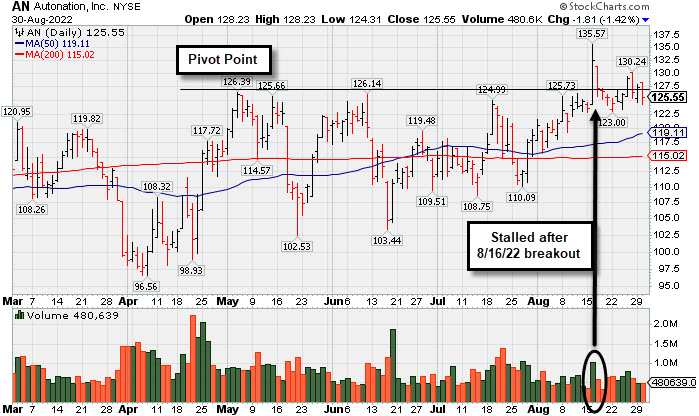
Autonation Stalled After Recent Breakout
Kenneth J. Gruneisen - Passed the CAN SLIM® Master's Exam
Autonation Inc (AN -$1.81 or -1.42% to $125.55) is still hovering near prior highs in the $126 area which were noted as initial support to watch. It faces no resistance due to overhead supply after its 8/16/22 volume-driven gain triggered a noted technical buy signal, however it has been stalling. Its 50-day moving average (DMA) line ($119.11) defines near-term support to watch on pullbacks.
AN has a 97 Earnings Per Share Rating. Recently it reported Jun '22 quarterly earnings +34% on -2% sales revenues versus the year ago period, its 8th strong earnings comparison well above the +25% minimum guideline (C criteria). Annual earnings growth has been strong. The stock was was highlighted in yellow with pivot point cited based on its 5/04/22 high plus 10 cents in the 7/20/22 mid-day report (read here). It was last shown in this FSU section on 8/11/22 with an annotated graph under the headline, "Autonation Hovering Near Stubborn Resistance".
AN hails from the Retail/Wholesale Automobile group which is currently ranked 75th on the 197 Industry Groups list (L criteria). It has 56 million shares outstanding (S criteria) which can contribute to greater price volatility in the event of institutional buying or selling. The number of top-rated funds owning its shares rose from 671 in Sep '21 to 731 in Jun '22, a reassuring sign concerning the I criteria.
|
|
|
Color Codes Explained :
Y - Better candidates highlighted by our
staff of experts.
G - Previously featured
in past reports as yellow but may no longer be buyable under the
guidelines.
***Last / Change / Volume data in this table is the closing quote data***
Symbol/Exchange
Company Name
Industry Group |
PRICE |
CHANGE
(%Change) |
Day High |
Volume
(% DAV)
(% 50 day avg vol) |
52 Wk Hi
% From Hi |
Featured
Date |
Price
Featured |
Pivot Featured |
|
Max Buy |
 IMXI
-
NASDAQ
IMXI
-
NASDAQ
International Money Exp
Financial Svcs-Specialty
|
$23.18
|
-0.51
-2.15% |
$23.69
|
397,728
76.34% of 50 DAV
50 DAV is 521,000
|
$26.23
-11.63%
|
7/1/2022
|
$21.27
|
PP = $21.38
|
|
MB = $22.45
|
Most Recent Note - 8/29/2022 12:38:16 PM
G - Retreating from its all-time high, slumping near its 50 DMA line ($23.07) which defines initial support to watch above prior highs in the $22 area. Reported Jun '22 quarterly earnings +21% on +17% sales revenues versus the year ago period, below the +25% minimum earnings guideline (C criteria), raising fundamental concerns.
>>> FEATURED STOCK ARTICLE : June Quarter Was Below +25% Minimum Earnings Guideline - 8/23/2022 |
View all notes |
Set NEW NOTE alert |
Company Profile |
SEC
News |
Chart |
Request a new note
C
A
S
I |
CI
-
NYSE
Cigna Corp
Medical-Managed Care
|
$285.07
|
-2.12
-0.74% |
$288.51
|
1,235,455
61.83% of 50 DAV
50 DAV is 1,998,000
|
$293.96
-3.02%
|
7/7/2022
|
$276.55
|
PP = $273.68
|
|
MB = $287.36
|
 Most Recent Note - 8/30/2022 5:43:20 PM
Y - Pulled back below its "max buy" level today with below average volume and its color code is changed to yellow. Volume totals have been cooling while hovering near its all-time high. Reported earnings for the Jun '22 quarter rose +19% on +5% sales revenues versus the year ago period, breaking a streak of 3 quarterly earnings increases above the +25% minimum guideline (C criteria), raising fundamental concerns. Near-term support to watch is at its 50 DMA line ($276.53).
>>> FEATURED STOCK ARTICLE : Cigna Hovering Near High Despite Earnings Under +25% Minimum - 8/26/2022 |
View all notes |
Set NEW NOTE alert |
Company Profile |
SEC
News |
Chart |
Request a new note
C
A
S
I |
AN
-
NYSE
Autonation Inc
SPECIALTY RETAIL - Auto Dealerships
|
$125.55
|
-1.81
-1.42% |
$128.23
|
478,867
68.70% of 50 DAV
50 DAV is 697,000
|
$135.57
-7.39%
|
7/20/2022
|
$122.03
|
PP = $126.49
|
|
MB = $132.81
|
Most Recent Note - 8/30/2022 5:40:32 PM
Y - Stalled after its recent breakout and sputtering near prior highs in the $126 area which were noted as initial support to watch. Faces no resistance due to overhead supply. Reported Jun '22 quarterly earnings +34% on -2% sales revenues versus the year ago period. See the latest FSU analysis for more details and a new annotated graph.
>>> FEATURED STOCK ARTICLE : Autonation Stalled After Recent Breakout - 8/30/2022 |
View all notes |
Set NEW NOTE alert |
Company Profile |
SEC
News |
Chart |
Request a new note
C
A
S
I |
ESQ
-
NASDAQ
Esquire Financial Hldgs
Finance-Commercial Loans
|
$37.55
|
-0.37
-0.98% |
$37.74
|
24,478
42.20% of 50 DAV
50 DAV is 58,000
|
$41.68
-9.91%
|
7/26/2022
|
$37.74
|
PP = $39.19
|
|
MB = $41.15
|
Most Recent Note - 8/26/2022 1:14:16 PM
Y - Volume totals have remained lighter than average volume while sputtering back and testing support near prior resistance in the $39 area. Confirming gains above the pivot point backed by at least +40% above average volume would be a reassuring sign of fresh institutional buying. Its 50 DMA line ($36.13) defines important near-term support.
>>> FEATURED STOCK ARTICLE : Closed at Session High With Gain for New All-Time High - 8/12/2022 |
View all notes |
Set NEW NOTE alert |
Company Profile |
SEC
News |
Chart |
Request a new note
C
A
S
I |
GPK
-
NYSE
Graphic Packaging Hldg
CONSUMER NON-DURABLES - Packaging and Containers
|
$22.63
|
-0.31
-1.35% |
$23.06
|
2,311,330
77.04% of 50 DAV
50 DAV is 3,000,000
|
$23.71
-4.56%
|
7/26/2022
|
$22.63
|
PP = $23.09
|
|
MB = $24.24
|
Most Recent Note - 8/29/2022 5:39:26 PM
Y - Still holding its ground but it has made no real progress since its 8/10/22 breakout. Its 50 DMA line ($21.73) defines near-term support.
>>> FEATURED STOCK ARTICLE : Churned Heavy Volume Perched at High After 6 Straight Gains - 8/15/2022 |
View all notes |
Set NEW NOTE alert |
Company Profile |
SEC
News |
Chart |
Request a new note
C
A
S
I |
Symbol/Exchange
Company Name
Industry Group |
PRICE |
CHANGE
(%Change) |
Day High |
Volume
(% DAV)
(% 50 day avg vol) |
52 Wk Hi
% From Hi |
Featured
Date |
Price
Featured |
Pivot Featured |
|
Max Buy |
CSL
-
NYSE
Carlisle Cos Inc
Diversified Operations
|
$295.41
|
-7.03
-2.32% |
$304.96
|
443,733
107.70% of 50 DAV
50 DAV is 412,000
|
$318.71
-7.31%
|
7/28/2022
|
$282.31
|
PP = $275.23
|
|
MB = $288.99
|
Most Recent Note - 8/30/2022 5:45:37 PM
G - Pulled back with higher volume behind today's 3rd consecutive loss. Its 50 DMA line ($276.43) and prior highs in the $275 area define important near-term support to watch.
>>> FEATURED STOCK ARTICLE : Pulling Back From All-Time High After Volume-Driven Gains - 8/22/2022 |
View all notes |
Set NEW NOTE alert |
Company Profile |
SEC
News |
Chart |
Request a new note
C
A
S
I |
ENPH
-
NASDAQ
Enphase Energy Inc
Energy-Solar
|
$285.77
|
+0.95
0.33% |
$296.82
|
3,436,984
103.37% of 50 DAV
50 DAV is 3,325,000
|
$308.88
-7.48%
|
7/28/2022
|
$276.66
|
PP = $282.55
|
|
MB = $296.68
|
Most Recent Note - 8/26/2022 1:09:36 PM
Y - Pulling back today with light volume. Volume totals cooled while hovering near its all-time high in recent weeks. The prior high in the $282 area has been noted as initial support to watch above its 50 DMA line ($241). Fundamentals remain strong.
>>> FEATURED STOCK ARTICLE : Enphase Energy Consolidating After Rallying to New Highs - 8/19/2022 |
View all notes |
Set NEW NOTE alert |
Company Profile |
SEC
News |
Chart |
Request a new note
C
A
S
I |
PWR
-
NYSE
Quanta Services Inc
MATERIALS and CONSTRUCTION - General Contractors
|
$140.76
|
-4.11
-2.84% |
$146.66
|
758,290
65.48% of 50 DAV
50 DAV is 1,158,000
|
$149.33
-5.74%
|
7/28/2022
|
$141.83
|
PP = $140.14
|
|
MB = $147.15
|
Most Recent Note - 8/30/2022 5:20:27 PM
Y - Pulled back today with light volume. Volume totals have been below average while recently wedging back above its pivot point since encountering some distributional pressure. Confirming volume-driven gains for new highs would be a reassuring sign of serious institutional buying demand. Its 50 DMA line ($134.26) defines important near-term support to watch. Fundamentals remain strong.
>>> FEATURED STOCK ARTICLE : Stalled After Breakout But Still Quietly Hovering Near High - 8/16/2022 |
View all notes |
Set NEW NOTE alert |
Company Profile |
SEC
News |
Chart |
Request a new note
C
A
S
I |
CLFD
-
NASDAQ
Clearfield Inc
TELECOMMUNICATIONS - Cables / Satalite Equipment
|
$118.68
|
-2.20
-1.82% |
$121.71
|
247,277
72.09% of 50 DAV
50 DAV is 343,000
|
$130.01
-8.71%
|
7/29/2022
|
$94.10
|
PP = $86.81
|
|
MB = $91.15
|
Most Recent Note - 8/29/2022 5:37:08 PM
G - Pulled back from its all-time high with today's 3rd consecutive loss with below average volume. Very extended from any sound base. Its 50 DMA line ($89.93) and prior high in the $86 area define important support to watch. Fundamentals remain strong.
>>> FEATURED STOCK ARTICLE : Clearfield Showed Resilience After Considerable Rally - 8/17/2022 |
View all notes |
Set NEW NOTE alert |
Company Profile |
SEC
News |
Chart |
Request a new note
C
A
S
I |
GFF
-
NYSE
Griffon Corporation
MATERIALS and CONSTRUCTION - General Building Materials
|
$32.32
|
-0.46
-1.40% |
$33.00
|
252,374
54.98% of 50 DAV
50 DAV is 459,000
|
$34.35
-5.91%
|
8/8/2022
|
$32.46
|
PP = $31.12
|
|
MB = $32.68
|
Most Recent Note - 8/26/2022 1:07:27 PM
G - Pulling back near its "max buy" level with light volume behind today's loss. Prior highs in the $31 area define initial support to watch above its 50 DMA line ($28.70). See the latest FSU analysis for more details and an annotated graph.
>>> FEATURED STOCK ARTICLE : Best Ever Close With Gain on Lighter Volume - 8/25/2022 |
View all notes |
Set NEW NOTE alert |
Company Profile |
SEC
News |
Chart |
Request a new note
C
A
S
I |
Symbol/Exchange
Company Name
Industry Group |
PRICE |
CHANGE
(%Change) |
Day High |
Volume
(% DAV)
(% 50 day avg vol) |
52 Wk Hi
% From Hi |
Featured
Date |
Price
Featured |
Pivot Featured |
|
Max Buy |
CLH
-
NYSE
Clean Harbors Inc
Pollution Control
|
$117.73
|
-1.30
-1.09% |
$119.67
|
198,390
61.42% of 50 DAV
50 DAV is 323,000
|
$124.33
-5.31%
|
8/10/2022
|
$111.78
|
PP = $115.10
|
|
MB = $120.86
|
Most Recent Note - 8/29/2022 5:34:29 PM
Y - Color code is changed to yellow while consolidating below its "max buy" level. Previously noted gain and strong close above the pivot point backed by +116% above average volume on 8/12/22 triggered a technical buy signal. No resistance remains due to overhead supply. Fundamentals remain strong. Prior high in the $115 area defines important near-term support to watch on pullbacks. See latest FSU analysis for more details and a new annotated graph.
>>> FEATURED STOCK ARTICLE : Quietly Consolidating Below "Max Buy" Level After Breakout - 8/29/2022 |
View all notes |
Set NEW NOTE alert |
Company Profile |
SEC
News |
Chart |
Request a new note
C
A
S
I |
SNPS
-
NASDAQ
Synopsys Inc
COMPUTER SOFTWARE and SERVICES - Technical and System Software
|
$346.00
|
-1.49
-0.43% |
$351.39
|
1,034,975
107.92% of 50 DAV
50 DAV is 959,000
|
$391.17
-11.55%
|
8/17/2022
|
$381.37
|
PP = $377.70
|
|
MB = $396.59
|
Most Recent Note - 8/30/2022 5:24:20 PM
G - Tested its 50 DMA line ($341.44) with today's 3rd consecutive loss. More damaging losses would raise greater concerns. Encountered distributional pressure while retreating from its all-time high in recent weeks. Reported Jul '22 quarterly earnings +16% on +18% sales revenues versus the year ago period, below the +25% minimum earnings guideline (C criteria), raising fundamental concerns. Renewed strength and subsequent gains above the pivot point backed by at least +40% above average volume are needed to clinch a technical buy signal.
>>> FEATURED STOCK ARTICLE : Earnings Report Below +25% Minimum and Encountering Distributional Pressure - 8/18/2022 |
View all notes |
Set NEW NOTE alert |
Company Profile |
SEC
News |
Chart |
Request a new note
C
A
S
I |
|
|
|
THESE ARE NOT BUY RECOMMENDATIONS!
Comments contained in the body of this report are technical
opinions only. The material herein has been obtained
from sources believed to be reliable and accurate, however,
its accuracy and completeness cannot be guaranteed.
This site is not an investment advisor, hence it does
not endorse or recommend any securities or other investments.
Any recommendation contained in this report may not
be suitable for all investors and it is not to be deemed
an offer or solicitation on our part with respect to
the purchase or sale of any securities. All trademarks,
service marks and trade names appearing in this report
are the property of their respective owners, and are
likewise used for identification purposes only.
This report is a service available
only to active Paid Premium Members.
You may opt-out of receiving report notifications
at any time. Questions or comments may be submitted
by writing to Premium Membership Services 665 S.E. 10 Street, Suite 201 Deerfield Beach, FL 33441-5634 or by calling 1-800-965-8307
or 954-785-1121.
|
|
|