You are not logged in.
This means you
CAN ONLY VIEW reports that were published prior to Monday, March 24, 2025.
You
MUST UPGRADE YOUR MEMBERSHIP if you want to see any current reports.
AFTER MARKET UPDATE - MONDAY, JULY 18TH, 2022
Previous After Market Report Next After Market Report >>>
|
|
|
|
DOW |
-215.65 |
31,072.61 |
-0.69% |
|
Volume |
862,561,760 |
-14% |
|
Volume |
4,976,965,000 |
+15% |
|
NASDAQ |
-92.37 |
11,360.05 |
-0.81% |
|
Advancers |
1,648 |
53% |
|
Advancers |
2,112 |
48% |
|
S&P 500 |
-32.31 |
3,830.85 |
-0.84% |
|
Decliners |
1,455 |
47% |
|
Decliners |
2,306 |
52% |
|
Russell 2000 |
-5.96 |
1,738.42 |
-0.34% |
|
52 Wk Highs |
17 |
|
|
52 Wk Highs |
30 |
|
|
S&P 600 |
-0.56 |
1,136.58 |
-0.05% |
|
52 Wk Lows |
60 |
|
|
52 Wk Lows |
108 |
|
|
 |
Major Indices Sputter With Advancers and Decliners Evenly Mixed
Kenneth J. Gruneisen - Passed the CAN SLIM® Master's Exam
The S&P 500 shed 0.8%, trimming an earlier advance of more than 1%, while the Nasdaq Composite also slipped 0.8%. The Dow fell 215 points, erasing an earlier gain of more than 350 points. The volume totals reported were mixed, lighter than the prior session on the NYSE and higher on the Nasdaq exchange. Breadth was fairly even as advancers led decliners by a narrow 8-7 margin on the NYSE while decliners led advancers by a narrow margin on the Nasdaq exchange. There were 9 high-ranked companies from the Leaders List that hit new 52-week high and were listed on the BreakOuts Page, versus the total of 6 on the prior session. New 52-week lows totals still outnumbered new 52-week highs totals on the NYSE and on the Nasdaq exchange. The brief new market uptrend is already under pressure (M criteria). Any sustainable rally requires a healthy crop of leading stocks hitting new highs, but leadership has been very thin.
Chart courtesy of www.stockcharts.com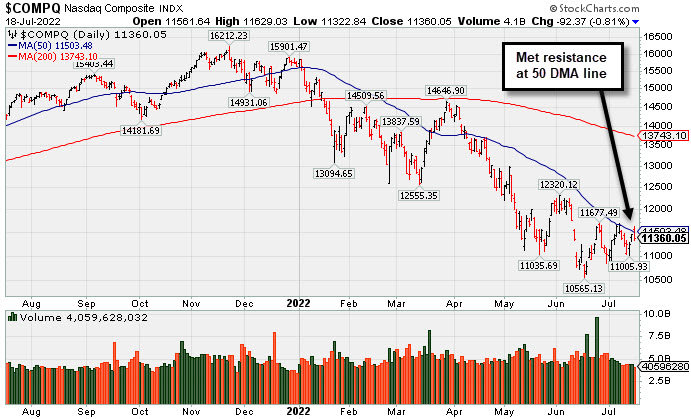 PICTURED: The Nasdaq Composite Index remains below its 50-day moving average (DMA) line after meeting resistance there. It is well below its 200 DMA after slumping as much as -34.8% from its November 22, 2021 record high.
U.S. stocks finished lower on Monday as worries about inflation and a looming recession overshadowed mostly upbeat bank earnings. An early session rally lost steam after a report indicated that Apple Inc. planned to slow hiring and spending growth. Treasuries declined, with the yield on the 10-year note up five basis points (0.05%) to 2.97%, still lower than the two-year note yield (3.16%), leaving a key portion of the curve inverted and signaling recessionary concerns. On the data front, a measure of homebuilder sentiment deteriorated to the lowest level since May 2020, in its second-steepest drop on record.
Eight of 11 S&P 500 sectors closed in negative territory, with Energy shares bucking the downtrend amid a back-up in oil prices. West Texas Intermediate crude climbed 4.8% to $102.27/barrel. In earnings, Goldman Sachs Group Inc. (GS +2.51%) rose after surpassing analyst profit and revenue projections, supported by stronger trading activity. Shares of Bank of America Corp. (BAC) were little changed as investors weighed positive net interest income guidance against otherwise mixed results.
Last week, signs of easing inflationary expectations, along with recent remarks from Federal Reserve (Fed) officials, helped dial back market forecasts of an ultra-aggressive 1.00% central bank rate hike next week. Still, another 0.75% increase remained widely anticipated after the latest Consumer Price Index report showed inflation hitting a more than four-decade high.
|
 Kenneth J. Gruneisen started out as a licensed stockbroker in August 1987, a couple of months prior to the historic stock market crash that took the Dow Jones Industrial Average down -22.6% in a single day. He has published daily fact-based fundamental and technical analysis on high-ranked stocks online for two decades. Through FACTBASEDINVESTING.COM, Kenneth provides educational articles, news, market commentary, and other information regarding proven investment systems that work in good times and bad.
Comments contained in the body of this report are technical opinions only and are not necessarily those of Gruneisen Growth Corp. The material herein has been obtained from sources believed to be reliable and accurate, however, its accuracy and completeness cannot be guaranteed. Our firm, employees, and customers may effect transactions, including transactions contrary to any recommendation herein, or have positions in the securities mentioned herein or options with respect thereto. Any recommendation contained in this report may not be suitable for all investors and it is not to be deemed an offer or solicitation on our part with respect to the purchase or sale of any securities. |
|
 |
Commodity-Linked Groups Rose While Tech Sector Fell
Kenneth J. Gruneisen - Passed the CAN SLIM® Master's Exam
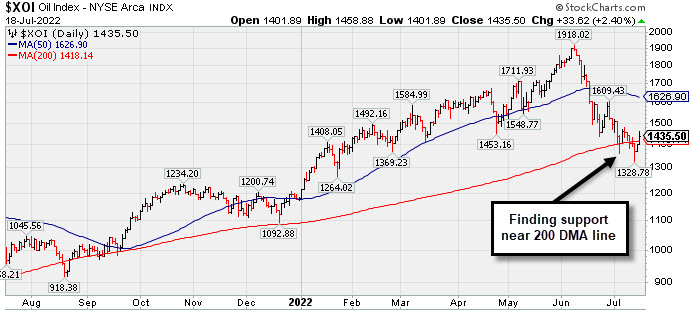
Commodity-linked groups had a positive bias as the Oil Services Index ($OSX +3.64%) and Integrated Oil Index ($XOI +2.40%) both outpaced the Gold & Silver Index ($XAU +1.36%). The tech sector had a negative bias as the Biotech Index ($BTK -2.07%) and Networking Index ($NWX -1.23%) both outpaced the Semiconductor Index ($SOX -0.53%) to the downside. The Broker/Dealer Index ($XBD -0.37%) edged lower while the Bank Index ($BKX +0.11%) eked out a tiny gain and the Retail Index ($RLX +0.22%) inched higher.
PICTURED: The Integrated Oil Index ($XOI +2.40%) ratcheted higher, finding prompt support and closing back above its 200-day moving average (DMA) line.
| Oil Services |
$OSX |
61.11 |
+2.15 |
+3.64% |
+15.92% |
| Integrated Oil |
$XOI |
1,435.50 |
+33.62 |
+2.40% |
+21.84% |
| Semiconductor |
$SOX |
2,679.57 |
-14.20 |
-0.53% |
-32.10% |
| Networking |
$NWX |
690.61 |
-8.60 |
-1.23% |
-28.88% |
| Broker/Dealer |
$XBD |
395.58 |
-1.46 |
-0.37% |
-18.75% |
| Retail |
$RLX |
3,030.43 |
+6.66 |
+0.22% |
-28.30% |
| Gold & Silver |
$XAU |
104.65 |
+1.41 |
+1.36% |
-20.99% |
| Bank |
$BKX |
104.14 |
+0.11 |
+0.11% |
-21.23% |
| Biotech |
$BTK |
4,680.69 |
-99.16 |
-2.07% |
-15.18% |
|
|
|
 |
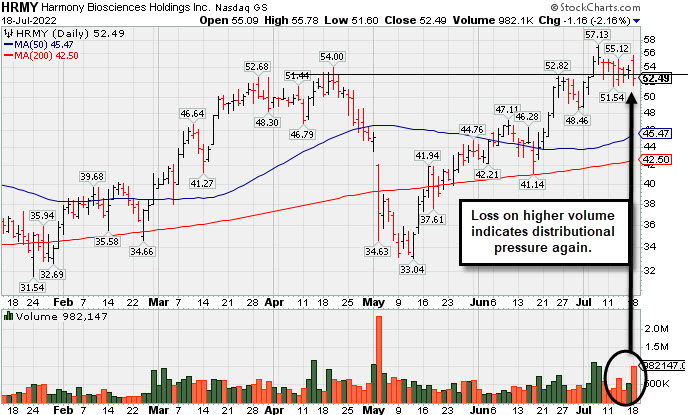
Harmony Has Been Encountering Distributional Pressure
Kenneth J. Gruneisen - Passed the CAN SLIM® Master's Exam
Harmony Biosciences Hldg (HRMY -$1.16 or -2.16% to $52.49) was trading near its 52-week high but encountered distributional pressure and had a "negative reversal" today, ending near the session low with volume +104% above average behind the loss. It held its ground but made very little headway since recently triggering a technical buy signal. Recent lows in the $51.50 area define near-term support to watch well above its 50-day moving average (DMA) line $45.47). HRMY was highlighted in yellow with pivot point cited based on its 6/27/22 high in the 7/06/22 mid-day report (read here). It hit a new all-time high (N criteria) with a gain and close above the pivot point backed by +118% above average volume triggering a technical buy signal. It was shown in this FSU section with detailed analysis that evening under the headline, "Volume-Driven Breakout For Biotech Firm".
The high-ranked Medical-Biomed/Biotech firm reported strong sales revenues and earnings increases well above the +25% minimum guideline (C criteria) in quarterly comparisons through Mar '22 versus the year ago periods. Its annual earnings history (A criteria) is limited, however it has an 80 Earnings Per Share Rating. It completed its $24 IPO on 8/19/20.
Its small supply of only 23.6 million shares (S criteria) in the public float can contribute to greater price volatility in the event of institutional buying or selling. The number of top-rated funds owning its shares rose from 208 in Sep '21 to 390 in Jun '22, a reassuring sign concerning the I criteria. Its current Up/Down Volume Ratio of 1.4 is an unbiased indication its shares have been under accumulation over the past 50 days.
|
|
|
Color Codes Explained :
Y - Better candidates highlighted by our
staff of experts.
G - Previously featured
in past reports as yellow but may no longer be buyable under the
guidelines.
***Last / Change / Volume data in this table is the closing quote data***
Symbol/Exchange
Company Name
Industry Group |
PRICE |
CHANGE
(%Change) |
Day High |
Volume
(% DAV)
(% 50 day avg vol) |
52 Wk Hi
% From Hi |
Featured
Date |
Price
Featured |
Pivot Featured |
|
Max Buy |
 LLY
-
NYSE
LLY
-
NYSE
Eli Lilly & Co
Medical-Diversified
|
$321.77
|
-9.83
-2.96% |
$331.97
|
2,103,526
69.52% of 50 DAV
50 DAV is 3,026,000
|
$335.33
-4.04%
|
5/16/2022
|
$302.46
|
PP = $314.10
|
|
MB = $329.81
|
 Most Recent Note - 7/18/2022 5:25:57 PM
Y - Pulled back today with light volume and held its ground with light volume totals in recent weeks. Its 50 DMA line ($308.24) defines near-term support above prior lows.
>>> FEATURED STOCK ARTICLE : Lilly Quietly Wedged to a New All-Time High This Week - 7/8/2022 |
View all notes |
Set NEW NOTE alert |
Company Profile |
SEC
News |
Chart |
Request a new note
C
A
S
I |
IMXI
-
NASDAQ
International Money Exp
Financial Svcs-Specialty
|
$21.82
|
+0.42
1.96% |
$22.62
|
426,013
103.91% of 50 DAV
50 DAV is 410,000
|
$22.94
-4.88%
|
7/1/2022
|
$21.27
|
PP = $21.38
|
|
MB = $22.45
|
Most Recent Note - 7/18/2022 5:24:50 PM
Y - Posted a 2nd consecutive volume-driven gain today but closed near the session low after trading near its 52-week high. Held its ground after it recently broke out of a "double bottom" base. Its 50 DMA line ($20.33) defines important near-term support to watch. Fundamentals through the Mar '22 quarter have been strong.
>>> FEATURED STOCK ARTICLE : Stalled Since Clearing Double Bottom Base - 7/15/2022 |
View all notes |
Set NEW NOTE alert |
Company Profile |
SEC
News |
Chart |
Request a new note
C
A
S
I |
HRMY
-
NASDAQ
Harmony Biosciences Hldg
Medical-Biomed/Biotech
|
$52.49
|
-1.16
-2.16% |
$55.78
|
982,147
204.19% of 50 DAV
50 DAV is 481,000
|
$57.13
-8.12%
|
7/6/2022
|
$54.12
|
PP = $52.85
|
|
MB = $55.49
|
Most Recent Note - 7/18/2022 5:23:38 PM
Y - There was a "negative reversal" today and it closed near the session low with a loss on twice average volume after trading near its 52-week high. Held its ground after recently triggering a technical buy signal. Recent lows in the $51.50 area define initial support to watch above its 50 DMA line. See the latest FSU analysis for more details and a new annotated graph.
>>> FEATURED STOCK ARTICLE : Harmony Has Been Encountering Distributional Pressure - 7/18/2022 |
View all notes |
Set NEW NOTE alert |
Company Profile |
SEC
News |
Chart |
Request a new note
C
A
S
I |
CI
-
NYSE
Cigna Corp
Medical-Managed Care
|
$268.35
|
-5.76
-2.10% |
$274.85
|
1,590,626
81.70% of 50 DAV
50 DAV is 1,947,000
|
$282.33
-4.95%
|
7/7/2022
|
$276.55
|
PP = $273.68
|
|
MB = $287.36
|
Most Recent Note - 7/18/2022 5:20:46 PM
Y - Undercut prior highs in the $273 area again with today's loss on lighter volume. Tested support at its 50 DMA line ($262.70) following volume-driven gains. More damaging losses would raise greater concerns.
>>> FEATURED STOCK ARTICLE : Volume-Driven Breakout for Cigna Corp - 7/7/2022 |
View all notes |
Set NEW NOTE alert |
Company Profile |
SEC
News |
Chart |
Request a new note
C
A
S
I |
|
|
|
THESE ARE NOT BUY RECOMMENDATIONS!
Comments contained in the body of this report are technical
opinions only. The material herein has been obtained
from sources believed to be reliable and accurate, however,
its accuracy and completeness cannot be guaranteed.
This site is not an investment advisor, hence it does
not endorse or recommend any securities or other investments.
Any recommendation contained in this report may not
be suitable for all investors and it is not to be deemed
an offer or solicitation on our part with respect to
the purchase or sale of any securities. All trademarks,
service marks and trade names appearing in this report
are the property of their respective owners, and are
likewise used for identification purposes only.
This report is a service available
only to active Paid Premium Members.
You may opt-out of receiving report notifications
at any time. Questions or comments may be submitted
by writing to Premium Membership Services 665 S.E. 10 Street, Suite 201 Deerfield Beach, FL 33441-5634 or by calling 1-800-965-8307
or 954-785-1121.
|
|
|