There are no featured stock write-ups on YY proir to 2/4/2024
 Upgrade your membership to see all of the expert analysis we have published on YY now!

Earnings News Due Next Week for Chinese Social Platform - Tuesday, February 27, 2018

YY Inc (YY -$3.16 or -2.39% to $129.09) is consolidating above its 50-day moving average (DMA) line ($125.72). It found prompt support and rebounded after violating that important short-term average since last shown in this FSU on 2/02/18 with an annotated graph under the headline, "Retreating After +78% Rally in 5 Months ". 

This China-based Internet - Content firm is due to report Dec '17 quarterly results on Monday, March 5, 2018 after market close. Volume and volatility often increase near earnings news. It reported Sep '17 quarterly earnings +42% on +49% sales revenues marking its 5th consecutive strong quarterly report above the +25% minimum (C criteria). Its annual earnings (A criteria) history has been strong especially since its $11 IPO on 11/21/12. It completed a new Public Offering on 8/16/17.
 
YY has seen the number of top-rated funds owning its shares rise from 268 in Sep '16 to 490 in Dec '17, a reassuring sign concerning the criteria. It has a current Up/Down Volume ratio of 1.3 which is an unbiased indication of accumulation over the past 50 days. It traded up as much as +78.13% since highlighted in yellow with a pivot point cited based on its 8/10/17 high plus 10 cents in the 9/25/17 mid-day report (read here).

Charts used courtesy of www.stockcharts.com


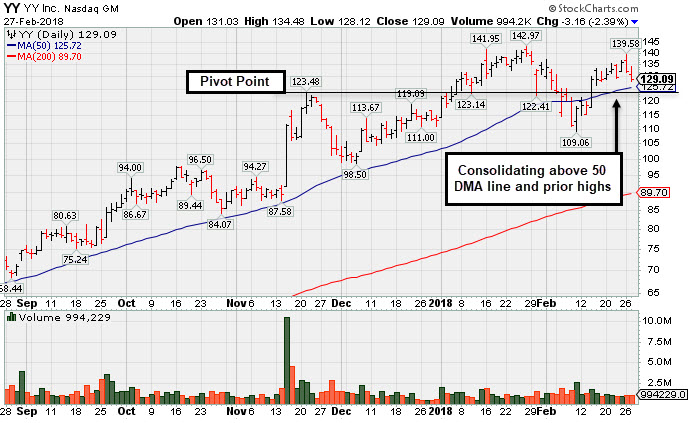
Retreating After +78% Rally in 5 Months - Friday, February 2, 2018

YY Inc (YY -$5.54 or -4.14% to $128.32) is consolidating above prior highs in the $123 area. Its 50-day moving average (DMA) line ($120.23) defines the next support to watch on pullbacks. This China-based Internet - Content firm's fundamentals remain strong.

Recent gains above the pivot point lacked the necessary minimum +40% above average volume needed to meet the guidelines for a proper technical buy signal. The pivot point cited was based on its 11/21/17 high plus 10 cents. Subsequent gains above the pivot point backed by at least +40% above average volume may trigger a new (or add-on) technical buy signal. Disciplined investors know that technical breakouts should have the look of serious institutional buying demand, the kind of increase in interest which can lead to a sustained and meaningful advance in price.

YY was last shown in this FSU on 1/04/18 with an annotated graph under the headline, "Touched a New High But Ended Below New Pivot Point Cited". It reported Sep '17 quarterly earnings +42% on +49% sales revenues marking its 5th consecutive strong quarterly report above the +25% minimum (C criteria). Its annual earnings (A criteria) history has been strong especially since its $11 IPO on 11/21/12. It completed a new Public Offering on 8/16/17.
 
YY has seen the number of top-rated funds owning its shares rise from 268 in Sep '16 to 475 in Dec '17, a reassuring sign concerning the I criteria. It has a current Up/Down Volume ratio of 1.3 which is an unbiased indication of accumulation over the past 50 days. It traded up as much as +78.13% since highlighted in yellow with a pivot point cited based on its 8/10/17 high plus 10 cents in the 9/25/17 mid-day report (read here).

Charts used courtesy of www.stockcharts.com


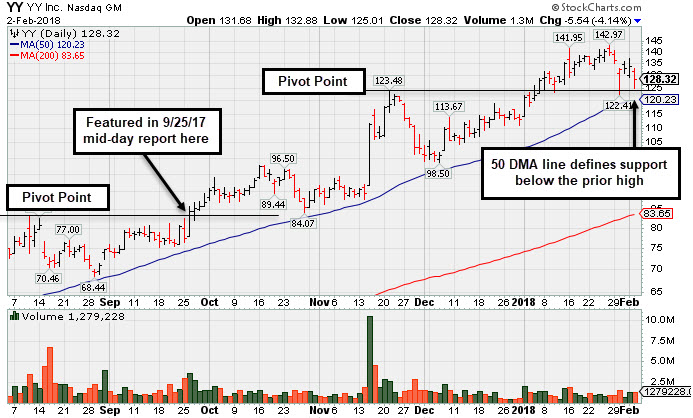
Touched a New High But Ended Below New Pivot Point Cited - Thursday, January 4, 2018

YY Inc (YY +$2.57 or +2.15% to $121.93) closed the session below the new pivot point cited based on its 11/21/17 high plus 10 cents after trading above that threshold early Thursday. Subsequent gains above the pivot point backed by at least +40% above average volume may trigger a new (or add-on) technical buy signal. Disciplined investors know that technical breakouts should have the look of serious institutional buying demand, the kind of increase in interest which can lead to a sustained and meaningful advance in price.

Its 50-day moving average (DMA) line ($104.33) defines near-term support above the recent low ($98.50 on 12/06/17). Violations may trigger technical sell signals. This China-based Internet - Content firm's fundamentals remain strong. It was last shown in this FSU on 12/11/17 with an annotated graph under the headline, "Fundamentals Remain Strong; Extended From Any Sound Base ". It reported Sep '17 quarterly earnings +42% on +49% sales revenues marking its 5th consecutive strong quarterly report above the +25% minimum (C criteria). Its annual earnings (A criteria) history has been strong especially since its $11 IPO on 11/21/12. It completed a new Public Offering on 8/16/17.
 
YY has seen the number of top-rated funds owning its shares rise from 268 in Sep '16 to 441 in Sep '17, a reassuring sign concerning the I criteria. It has a current Up/Down Volume ratio of 1.2 which is an unbiased indication of accumulation over the past 50 days. It traded up as much as +56.87% since highlighted in yellow with a pivot point cited based on its 8/10/17 high plus 10 cents in the 9/25/17 mid-day report (read here).  A convincing technical breakout could signal the beginning of another significant leg up.

Charts used courtesy of www.stockcharts.com


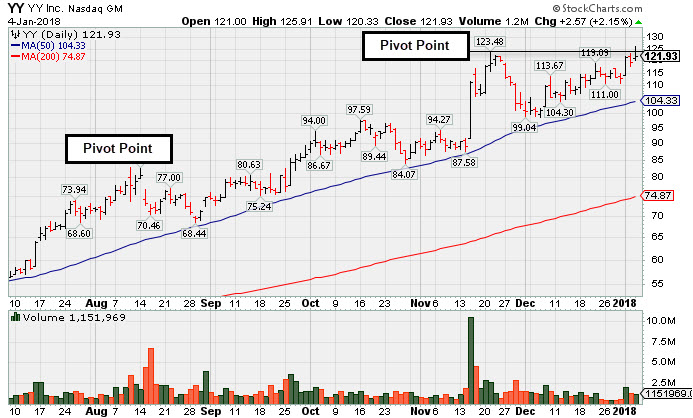
Fundamentals Remain Strong; Extended From Any Sound Base - Monday, December 11, 2017

YY Inc (YY +$1.49 or +1.41% to $107.34) found support above its prior high ($97.59 on 10/16/17) and above its 50-day moving average (DMA) line ($97.29). It is extended from any sound base. 

Fundamentals remain strong. It was last shown in this FSU on 11/14/17 with an annotated graph under the headline, " Chinese Social Media Firm Reported Earnings ". It reported Sep '17 quarterly earnings +42% on +49% sales revenues marking its 5th consecutive strong quarterly report above the +25% minimum (C criteria). Its annual earnings (A criteria) history has been strong especially since its $11 IPO on 11/21/12. It completed a new Public Offering on 8/16/17.

This Chinese Internet - Content firm has seen the number of top-rated funds owning its shares rise from 268 in Sep '16 to 426 in Sep '17, a reassuring sign concerning the I criteria. It has a current Up/Down Volume ratio of 1.3 which is an unbiased indication of accumulation over the past 50 days. It traded up as much as +53.85% since highlighted in yellow with a pivot point cited based on its 8/10/17 high plus 10 cents in the 9/25/17 mid-day report (read here). 

 Charts used courtesy of www.stockcharts.com


Chinese Social Media Firm Reported Earnings - Tuesday, November 14, 2017

YY Inc (YY -$1.37 or -1.51% to $89.23) reported stronger than expected Sep '17 quarterly results after the close today. Volume and volatility often increase near earnings news.

It has not formed a new base of sufficient length.  Recently it has been consolidating above its 50-day moving average (DMA) line ($86.66), and the prior low ($84.07 on 10/27/17) which defines important near-term support to watch. 

It was last shown in this FSU on 10/19/17 with an annotated graph under the headline, "Extended After Rallying From Base". It was first highlighted in yellow with a pivot point cited based on its 8/10/17 high plus 10 cents in the 9/25/17 mid-day report (read here).

This Chinese Internet - Content firm found support in recent weeks above its 50-day moving average (DMA) line and rebounded to challenge its 52-week high. Jun '17 quarterly earnings +53% on +29% sales revenues marked its 4th consecutive strong quarterly report above the +25% minimum (C criteria). Its annual earnings (A criteria) history has been strong especially since its $11 IPO on 11/21/12.

The number of top-rated funds owning its shares rose from 268 in Sep '16 to 388 in Sep '17, a reassuring sign concerning the I criteria. It completed a new Public Offering on 8/16/17.

Charts used courtesy of www.stockcharts.com


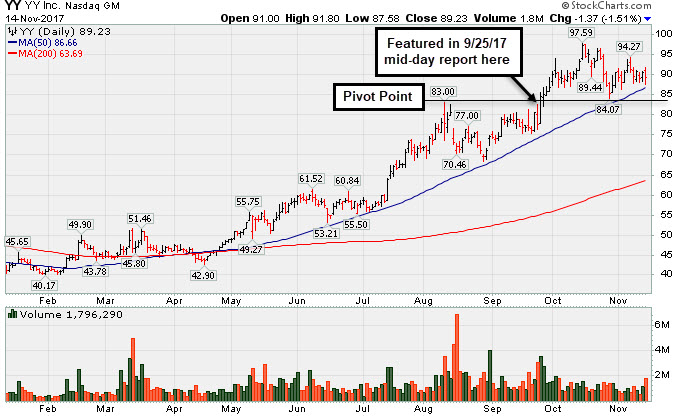
Extended After Rallying From Base - Thursday, October 19, 2017

YY Inc (YY -$2.17 or -2.29% to $92.77) is extended from its prior base and prior highs in the $83 area defining initial support to watch above its 50-day moving average (DMA) line ($80.88).

It was last shown in this FSU on 9/25/17 with an annotated graph under the headline, "Encountered Distributional Pressure When Challenging Prior High".It was highlighted in yellow with a pivot point cited based on its 8/10/17 high plus 10 cents in the earlier mid-day report (read here). 

This Chinese Internet - Content firm found support in recent weeks above its 50-day moving average (DMA) line and rebounded to challenge its 52-week high. Jun '17 quarterly earnings +53% on +29% sales revenues marked its 4th consecutive strong quarterly report above the +25% minimum (C criteria). Its annual earnings (A criteria) history has been strong especially since its $11 IPO on 11/21/12.

The number of top-rated funds owning its shares rose from 268 in Sep '16 to 363 in Sep '17, a reassuring sign concerning the I criteria. It completed a new Public Offering on 8/16/17.

Charts used courtesy of www.stockcharts.com


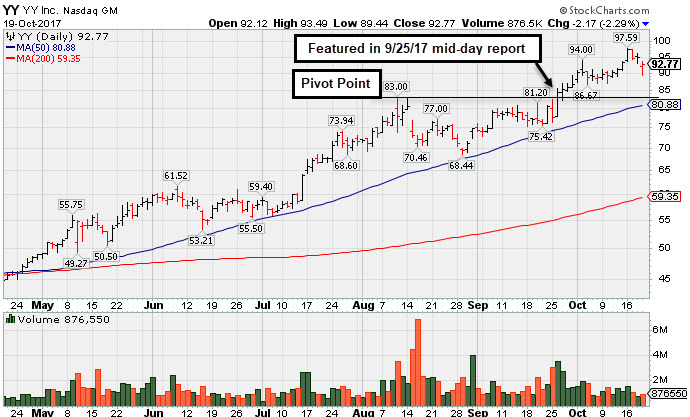
Encountered Distributional Pressure When Challenging Prior HIgh - Monday, September 25, 2017

YY Inc (YY -$3.05 or -3.79% to $77.47) encountered distributional pressure and ended in the lower third of its intra-day range with a loss on above average volume. It was highlighted in yellow with a pivot point cited based on its 8/10/17 high plus 10 cents in the earlier mid-day report (read here). Subsequent gains as the stock rallies above its pivot point with volume more than +40%above average may trigger a convincing technical buy signal.

This Chinese Internet - Content firm found support in recent weeks above its 50-day moving average (DMA) line and rebounded to challenge its 52-week high. Jun '17 quarterly earnings +53% on +29% sales revenues marked its 4th consecutive strong quarterly report above the +25% minimum (C criteria). Its annual earnings (A criteria) history has been strong especially since its $11 IPO on 11/21/12. 

The number of top-rated funds owning its shares rose from 268 in Sep '16 to 346 in Jun '17, a reassuring sign concerning the I criteria.  It completed a new Public Offering on 8/16/17.

Charts used courtesy of www.stockcharts.com


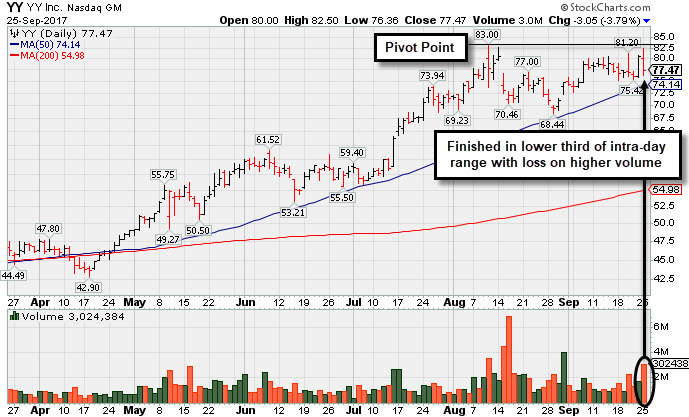
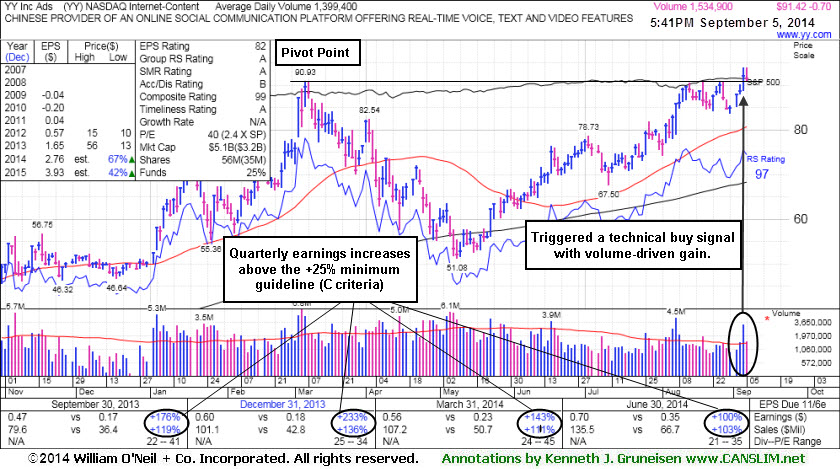
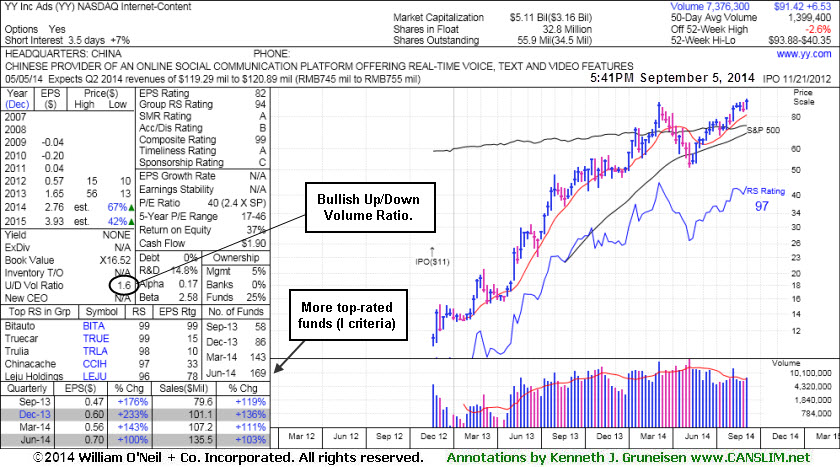
Perched at High After Triggering Technical Buy Signal - Friday, September 05, 2014

YY Inc (YY -$0.70 or -0.76% to $91.42) is perched at its 52-week high after rising above its pivot point with +143% above average volume on the prior session. Volume was more than +40% above average as the stock rallied above its pivot point to trigger a proper technical buy signal. Its 50-day moving average (DMA) line ($80.69) defines near-term support to watch. 

The high-ranked Internet - Content firm was last shown in this FSU section with annotated graphs on 8/19/14 under the headline, "Encountered Distributional Pressure Near Prior High", after highlighted in yellow with a new pivot point cited based on its 3/06/14 high plus 10 cents in the earlier mid-day report (read here). Fundamentals through the Jun '14 quarter remain very strong. It reported earnings +100% on +103% sales revenues for the Jun '14 quarter, and its great record of strong earnings and sales revenues increases in quarterly comparisons satisfies the C criteria. Its limited annual earnings (A criteria) history is a concern and it is up considerably from its $11 IPO on 11/21/12. The number of top-rated funds owning its shares rose from 58 in Sep '13 to 169 in Jun '14, a reassuring sign concerning the I criteria.

Disciplined investors avoid chasing extended stocks more than +5% above prior highs and always limit losses by selling if any stock falls more than -7% from their purchase price.


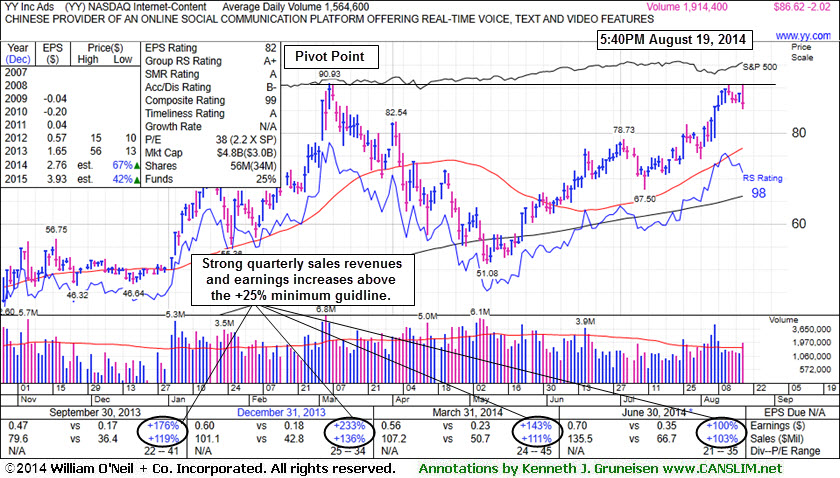
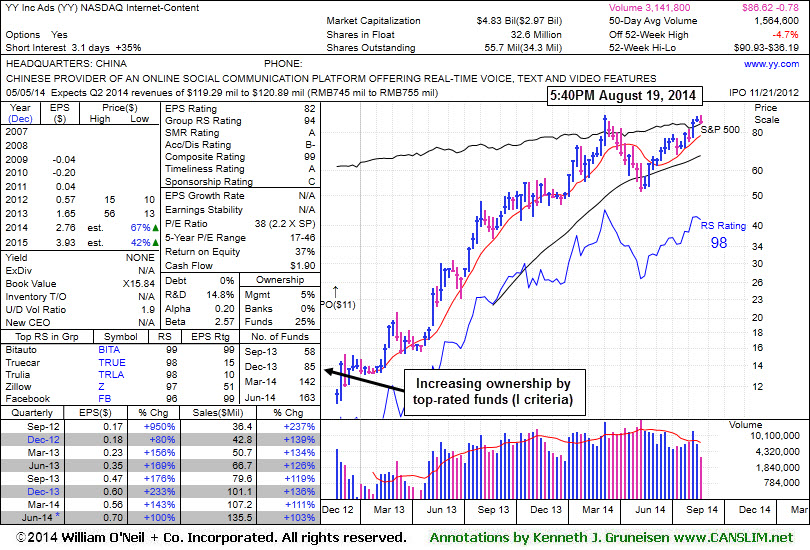
Encountered Distributional Peressure Near Prior High - Tuesday, August 19, 2014

YY Inc (YY -$2.02 or -2.28% to $86.62) was highlighted in yellow with a new pivot point cited based on its 3/06/14 high plus 10 cents in the earlier mid-day report (read here). The Chinese Internet - Content firm reversed into the red today after again challenging its 52-week high, a sign it was encountering distributional pressure near its prior highs. Subsequent volume-driven gains for new highs may trigger a new technical buy signal. There is no advantage to be gained by getting in "early" before fresh proof of heavy institutional buying demand, so patience and proper discipline are paramount.

Fundamentals through the Jun '14 quarter remain very strong. The Internet - Content firm reported earnings +100% on +103% sales revenues for the Jun '14 quarter, and its great record of strong earnings and sales revenues increases in quarterly comparisons satisfies the C criteria. Its limited annual earnings (A criteria) history is a concern and it is up considerably from its $11 IPO on 11/21/12. The number of top-rated funds owning its shares rose from 58 in Sep '13 to 163 in Jun '14, a reassuring sign concerning the I criteria.

It rebounded after a deep consolidation since dropped from the Featured Stocks list on 1/27/14 amid widespread weakness in China-related companies. It was last shown in this FSU section on 1/03/14 with annotated graphs under the headline, "Finished Strong With High Volume After Featured in Mid-Day Report". Disciplined investors avoid chasing extended stocks more than +5% above prior highs and always limit losses by selling if any stock falls more than -7% from their purchase price.


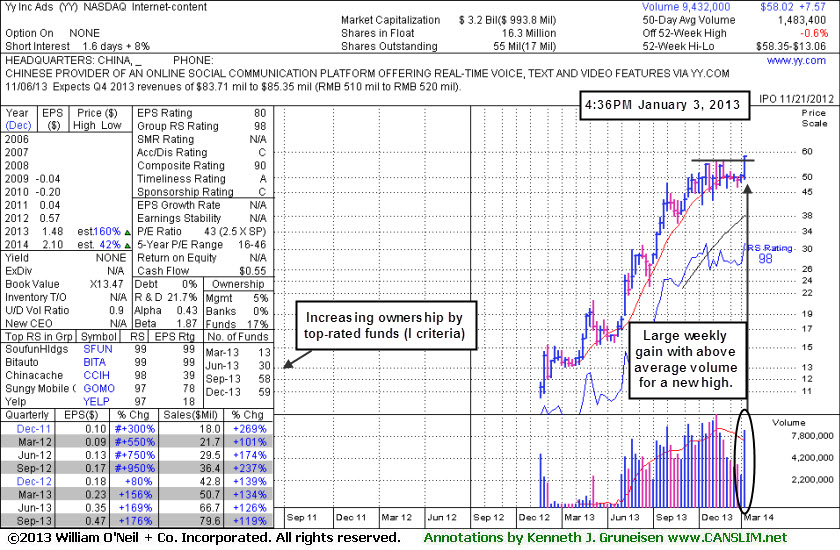
Finished Strong With High Volume After Featured in Mid-Day Report - Friday, January 03, 2014

YY Inc (YY +$5.56 or +10.60% to $58.02) was highlighted in yellow with an annotated daily graph in the earlier mid-day report (read here) with the pivot point cited based on its 11/18/13 high plus 10 cents after forming a riskier "late stage" base. It finished the session strong with a considerable gain backed by +258% above average volume as it rallied above the pivot point triggering a convincing technical buy signal. The gain marked a 2nd consecutive big volume-driven gain and a new 52-week high. Disciplined investors avoid chasing extended stocks more than +5% above prior highs and always limit losses by selling if any stock falls more than -7% from their purchase price. The weekly graph below shows its volume-driven weekly gain for a new high.

The Internet - Content firm reported earnings +176% on +119% sales revenues for the Sep '13 quarter, and its great record of strong earnings and sales revenues increases in quarterly comparisons satisfies the C criteria.  Limited annual earnings (A criteria) history is a concern and it is up considerably from its $11 IPO on 11/21/12. The number of top-rated funds owning its shares rose from 13 in Mar '13 to 59 in Sep '13, a reassuring sign concerning the I criteria.