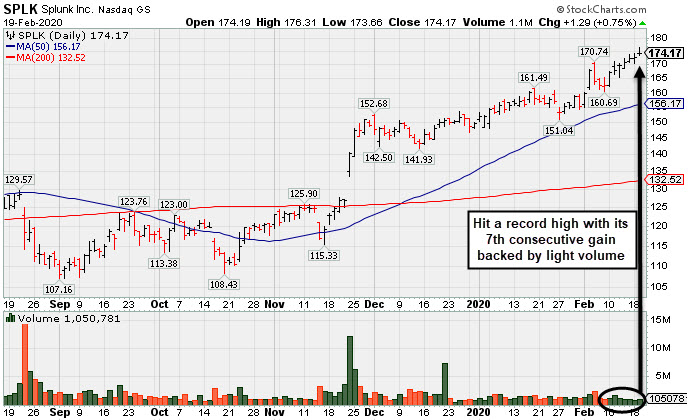
Perched at Record High After 7th Consecutive Gain - Wednesday, February 19, 2020
Splunk Inc (SPLK +$1.29 or +0.75% to $174.17) posted a 7th consecutive gain on light volume today for a new all-time high. It is extended from the previously noted base. Its 50-day moving average (DMA) line ($156) defines important support to watch on pullbacks.
SPLK was last shown in this FSU section on 1/29/20 with an annotated graph under the headline, "Volume Totals Cooling While Hovering Near All-Time High". The number of top-rated funds owning its shares rose from 748 in Jun '17 to 1,225 in Dec '19, a reassuring sign concerning the I criteria. The current Up/Down Volume Ratio of 1.5 is an unbiased indication its shares have been under accumulation over the past 50 days. Its Timeliness Rating is A and Sponsorship Rating is B.
Fundamentals remain strong. Bullish action came as it gapped up on 11/22/19 after reporting earnings +53% on +30% sales revenues versus the year ago period ended October 31st. Quarterly comparisons have been above the +25% minimum guideline (C criteria). Annual earnings history has been strong. The high-ranked Computer Software - Database firm has earned an 99 earnings Per Share Rating, well above the 80+ minimum guideline for buy candidates. Its annual earnings (A criteria) history has been strong since reaching profitability in FY '15.
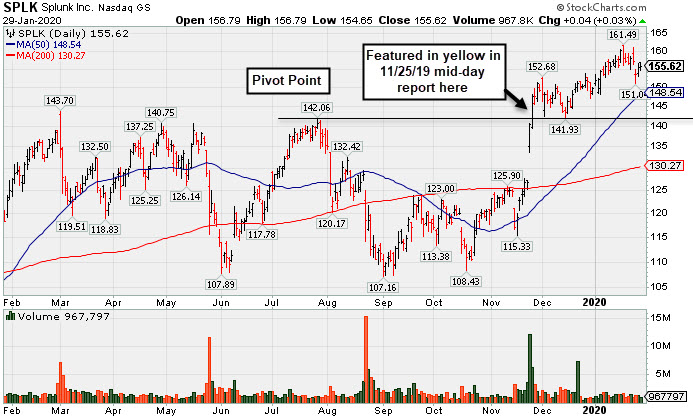
Volume Totals Cooling While Hovering Near All-Time High - Wednesday, January 29, 2020
Splunk Inc (SPLK) +$0.05 or +0.03% to $155.62) is still stubbornly holding its ground near its all-time high with volume totals cooling in recent weeks. It is extended from the previously noted base. Its 50-day moving average (DMA) line ($148.54) and prior highs in the $142-143 area define important support to watch on pullbacks.
SPLK was last shown in this FSU section on 1/08/20 with an annotated graph under the headline, "New High Hit With Another Gain on Near Average Volume. The number of top-rated funds owning its shares rose from 748 in Jun '17 to 1,191 in Dec '19, a reassuring sign concerning the I criteria. The current Up/Down Volume Ratio of 1.8 is an unbiased indication its shares have been under accumulation over the past 50 days. Its Timeliness Rating is A and Sponsorship Rating is B.
Fundamentals remain strong. Bullish action came as it gapped up on 11/22/19 after reporting earnings +53% on +30% sales revenues versus the year ago period ended October 31st. Quarterly comparisons have been above the +25% minimum guideline (C criteria). Annual earnings history has been strong. The high-ranked Computer Software - Database firm has earned an 99 earnings Per Share Rating, well above the 80+ minimum guideline for buy candidates. Its annual earnings (A criteria) history has been strong since reaching profitability in FY '15.
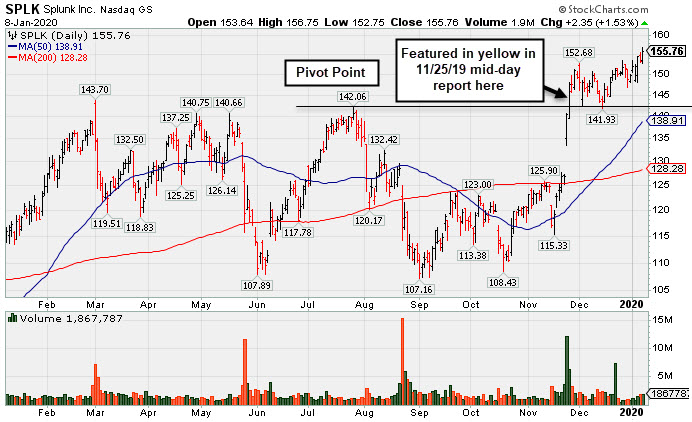
New High Hit With Another Gain on Near Average Volume - Wednesday, January 8, 2020
Splunk Inc (SPLK $155.76 +$2.35 +1.53%) posted a gain with average volume today for a new all-time high. Its color code was changed to green after recently rallying back above its "max buy" level. On pullbacks the prior highs in the $142-143 area define initial support to watch above its 50-day moving average (DMA) line ($138.91).
SPLK finished strong after highlighted in to yellow with pivot point cited based on its 7/26/19 high plus 10 cents in the 11/25/19 mid-day report (read here). Volume was +349% above average behind the big gain today and the strong close above the pivot point clinched a convincing new technical buy signal.
Fundamentals remain strong. Bullish action came as it gapped up on 11/22/19 after reporting earnings +53% on +30% sales revenues versus the year ago period ended October 31st. Quarterly comparisons have been above the +25% minimum guideline (C criteria). Annual earnings history has been strong. The high-ranked Computer Software - Database firm has earned an 99 earnings Per Share Rating, well above the 80+ minimum guideline for buy candidates. Its annual earnings (A criteria) history has been strong since reaching profitability in FY '15.
It was last shown in this FSU section on 12/16/19 with an annotated graph under the headline, "Consolidating Above Prior Highs Following Impressive Rally". The number of top-rated funds owning its shares rose from 748 in Jun '17 to 1,173 in Sep '19, a reassuring sign concerning the I criteria. The current Up/Down Volume Ratio of 1.9 is an unbiased indication its shares have been under accumulation over the past 50 days. Its Timeliness Rating is A and Sponsorship Rating is B.
Charts used courtesy of www.stockcharts.com
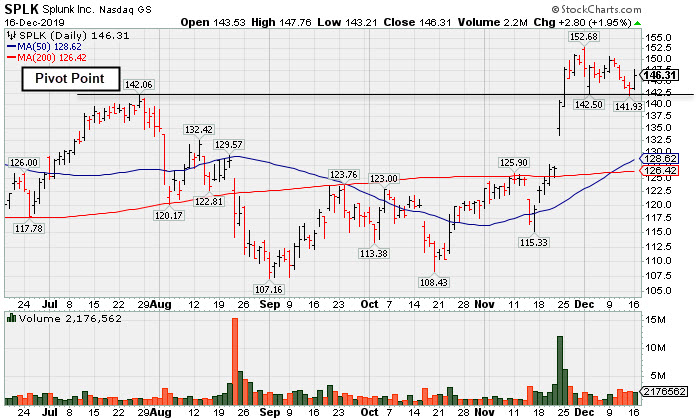
Consolidating Above Prior Highs Following Impressive Rally - Monday, December 16, 2019
Splunk Inc (SPLK +$2.80 or +1.95% to $146.31) is still consolidating above its pivot point and below its "max buy" level. Prior highs in the $142-143 area define initial support to watch on pullbacks.
SPLK finished strong after highlighted in to yellow with pivot point cited based on its 7/26/19 high plus 10 cents in the 11/25/19 mid-day report (read here). Volume was +349% above average behind the big gain today and the strong close above the pivot point clinched a convincing new technical buy signal.
Fundamentals remain strong. Bullish action came as it gapped up on 11/22/19 after reporting earnings +53% on +30% sales revenues versus the year ago period ended October 31st. Quarterly comparisons have been above the +25% minimum guideline (C criteria). Annual earnings history has been strong. The high-ranked Computer Software - Database firm has earned an 99 earnings Per Share Rating, well above the 80+ minimum guideline for buy candidates. Its annual earnings (A criteria) history has been strong since reaching profitability in FY '15.
Fundamentals remain strong. Bullish action came as it gapped up on 11/22/19 after reporting earnings +53% on +30% sales revenues versus the year ago period ended October 31st. Quarterly comparisons have been above the +25% minimum guideline (C criteria). Annual earnings history has been strong. The high-ranked Computer Software - Database firm has earned an 99 earnings Per Share Rating, well above the 80+ minimum guideline for buy candidates. Its annual earnings (A criteria) history has been strong since reaching profitability in FY '15.
It was last shown in this FSU section on 11/25/19 with an annotated graph under the headline, "Spurt of Volume-Driven Gains Reaches New All-Time High". The number of top-rated funds owning its shares rose from 748 in Jun '17 to 1,186 in Sep '19, a reassuring sign concerning the I criteria. The current Up/Down Volume Ratio of 1.4 is an unbiased indication its shares have been under accumulation over the past 50 days. Its Timeliness Rating is A and Sponsorship Rating is B.
Charts used courtesy of www.stockcharts.com
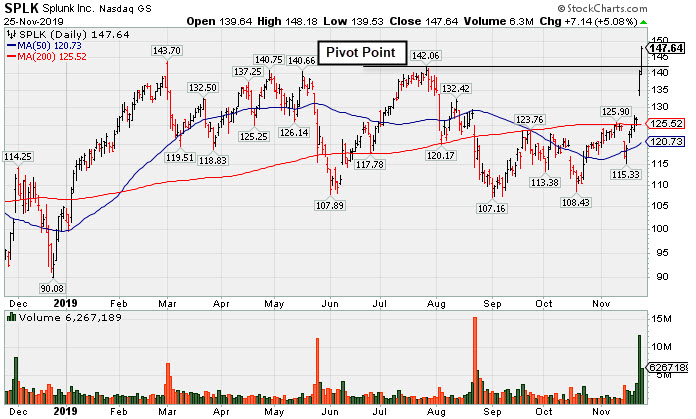
Spurt of Volume-Driven Gains Reaches New All-Time High - Monday, November 25, 2019
Splunk Inc (SPLK +$7.14 or +5.08% to $147.64) finished strong after highlighted in to yellow with pivot point cited based on its 7/26/19 high plus 10 cents in the earlier mid-day report (read here). Volume was +349% above average behind the big gain today and the strong close above the pivot point clinched a convincing new technical buy signal. SPLK went through a choppy consolidation since last noted when dropped from the Featured Stocks list on 5/30/19.
Fundamentals remain strong. Bullish action came last week as it gapped up on 11/22/19 after reporting earnings +53% on +30% sales revenues versus the year ago period ended October 31st. Quarterly comparisons have been above the +25% minimum guideline (C criteria). Annual earnings history has been strong. The high-ranked Computer Software - Database firm has earned an 99 earnings Per Share Rating, well above the 80+ minimum guideline for buy candidates. Its annual earnings (A criteria) history has been strong since reaching profitability in FY '15.
Fundamentals remain strong. Bullish action came last week as it gapped up on 11/22/19 after reporting earnings +53% on +30% sales revenues versus the year ago period ended October 31st. Quarterly comparisons have been above the +25% minimum guideline (C criteria). Annual earnings history has been strong. The high-ranked Computer Software - Database firm has earned an 99 earnings Per Share Rating, well above the 80+ minimum guideline for buy candidates. Its annual earnings (A criteria) history has been strong since reaching profitability in FY '15.
It went through a choppy consolidation since last shown in this FSU section on 5/22/19 with an annotated graph under the headline, "Perched Near Prior High With Earnings News Due". The number of top-rated funds owning its shares rose from 748 in Jun '17 to 1,187 in Sep '19, a reassuring sign concerning the I criteria. The current Up/Down Volume Ratio of 1.6 is an unbiased indication its shares have been under accumulation over the past 50 days. Its Timeliness Rating is B and Sponsorship Rating is B.
Charts used courtesy of www.stockcharts.com
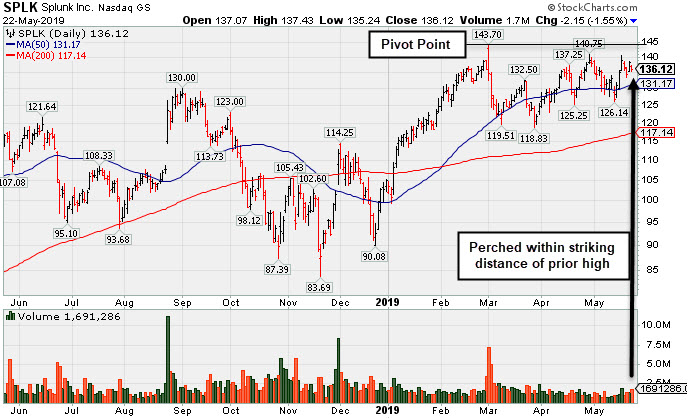
Perched Near Prior High With Earnings News Due - Wednesday, May 22, 2019
Splunk Inc (SPLK -$2.15 or -1.55% to $136.12) was highlighted in yellow with new pivot point cited based on its 3/01/19 high plus 10 cents in the earlier mid-day report (read here). Subsequent volume-driven gains above the pivot point are needed to trigger a technical buy signal. Confirming gains backed by at least +40% above average volume would be a reassuring sign of fresh institutional buying demand which might lead to a meaningful advance. It found support near its 50-day moving average (DMA) line during the recent consolidation and it is perched within close striking distance of its all-time high.
Keep in mind it is due to report earnings news for the Apr '19 quarter after the close on Thursday, 5/23/19. Volume and volatility often increase near earnings news. Earnings rose +41% on +35% sales revenues for the Jan '19 quarter versus the year ago period, its 2nd consecutive quarterly comparison above the +25% minimum guideline (C criteria). Annual earnings history has been strong.
The high-ranked Computer Software - Database firm has earned an 97 earnings Per Share Rating, well above the 80+ minimum guideline for buy candidates. Its annual earnings (A criteria) history has been strong since reaching profitability in FY '15.
Its progress has been choppy since last shown in this FSU section on 7/18/18 with an annotated graph under the headline, "Splunk Still Sputtering Below 50-Day Moving Average". The number of top-rated funds owning its shares rose from 748 in Jun '17 to 1,143 in Mar '19, a reassuring sign concerning the I criteria. The current Up/Down Volume Ratio of 1.5 is an unbiased indication its shares have been under accumulation over the past 50 days. Its Timeliness Rating is A and Sponsorship Rating is B.
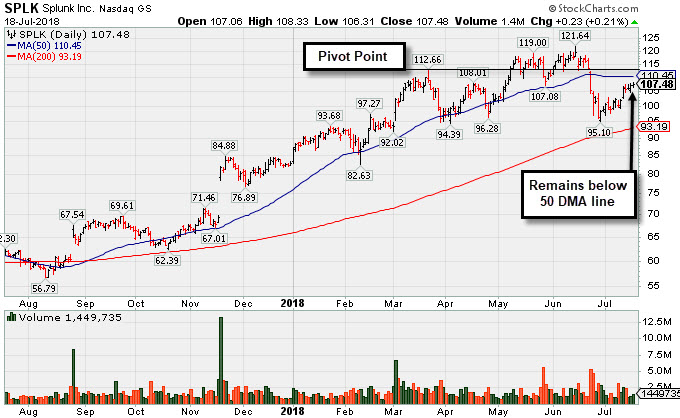
Splunk Still Sputtering Below 50-Day Moving Average - Wednesday, July 18, 2018
Splunk Inc (SPLK +$0.23 or 0.21% to $107.48) is still below its 50-day moving average (DMA) line ($110.45). The recent low ($95.10 on 6/28/18) defines important near-term support above its 200 DMA line ($92.39). A rebound above the 50 DMA line is needed for its outlook to improve. Wedging gains above the stock's pivot point recently were noted when below the +40% above average volume needed to trigger a proper technical buy signal. Confirming gains backed by at least +40% above average volume would be a reassuring sign of fresh institutional buying demand which might lead to a meaningful advance.
It reported a loss of 7 cents per share on +37% sales revenues versus a loss of 9 cents per share for the year ago period ended April 30th. The high-ranked Computer Software - Database firm reported earnings +76% on +37% sales revenues for the quarter ended January 31, 2018 versus the year ago period, and prior quarterly comparisons showed strong sales and earnings growth above the +25% minimum guideline (C criteria). It has earned an 86 earnings Per Share Rating, above the 80+ minimum guideline for buy candidates. Its annual earnings (A criteria) history has been strong since reaching profitability in FY '15.
It was last shown in this FSU section on 5/31/18 with an annotated graph under the headline, " Consolidating Near High Following Latest Financial Report". Bullish action came after SPLK was highlighted in yellow in the 2/15/18 mid-day report (read here). The current Up/Down Volume Ratio of 089 is an unbiased indication its shares have come under slight distributional pressure over the past 50 days. Its Timeliness Rating is A and Sponsorship Rating is B.The number of top-rated funds owning its shares rose from 748 in Jun '17 to 960 in Jun '18, a reassuring sign concerning the I criteria.
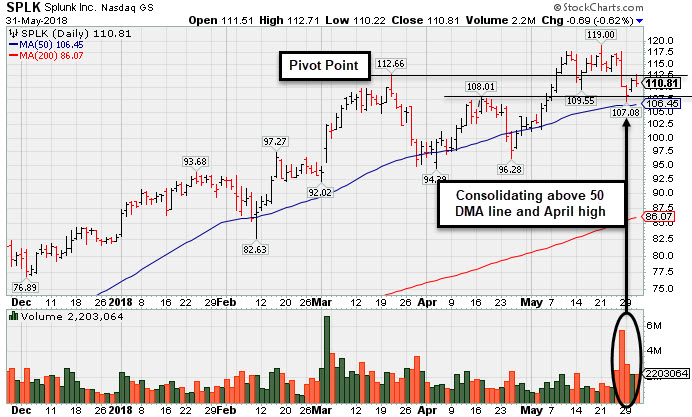
Consolidating Near High Following Latest Financial Report - Thursday, May 31, 2018
Splunk Inc (SPLK -$0.69 or -0.62% to $110.81) is consolidating above its 50-day moving average (DMA) line ($106.45) after volume-driven losses tested the prior high in the $108 area. More damaging losses would raise greater concerns and trigger technical sell signals. Wedging gains above the stock's pivot point recently were noted when below the +40% above average volume needed to trigger a proper technical buy signal. Confirming gains backed by at least +40% above average volume would be a reassuring sign of fresh institutional buying demand which might lead to a meaningful advance..
Last week it reported a loss of 7 cents per share on +37% sales revenues versus a loss of 9 cents per share for the year ago period ended April 30th. The high-ranked Computer Software - Database firm's prior quarterly comparisons showed strong earnings above the +25% minimum guideline (C criteria). It has earned an 86 earnings Per Share Rating, above the 80+ minimum guideline for buy candidates. Its annual earnings (A criteria) history has been strong since reaching profitability in FY '15.
It was last shown in this FSU section on 4/19/18 with an annotated graph under the headline, "Found Support Near 50-Day Average on Pullbacks". It reported earnings +76% on +37% sales revenues for the quarter ended January 31, 2018 versus the year ago period, and prior quarterly comparisons showed strong sales and earnings growth.
Bullish action came after SPLK was highlighted in yellow in the 2/15/18 mid-day report (read here). The current Up/Down Volume Ratio of 0.9 is an unbiased indication its shares have come under distributional pressure over the past 50 days. Its Timeliness Rating is A and Sponsorship Rating is B.The number of top-rated funds owning its shares rose from 748 in Jun '17 to 879 in Mar '18, a reassuring sign concerning the I criteria.
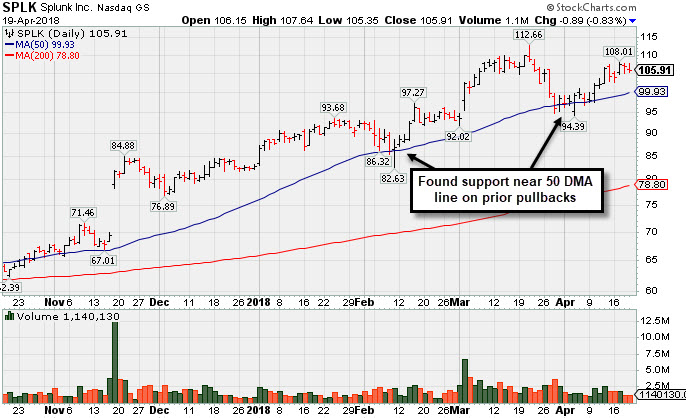
Found Support Near 50-Day Average on Pullbacks - Thursday, April 19, 2018
Splunk Inc (SPLK -$0.89 or -0.83% to $105.91) recently found support near its 50-day moving average (DMA) line on pullbacks. More damaging losses would raise greater concerns. It has not formed a new sound base of sufficient length.
Bullish action came after it reported earnings +76% on +37% sales revenues for the quarter ended January 31, 2018 versus the year ago period. SPLK was highlighted in yellow in the 2/15/18 mid-day report (read here) and last shown in this FSU section on 3/20/18 with an annotated graph under the headline, "Extended After Rallying from Secondary Buy Point".
The high-ranked Computer Software - Database firm's past 4 quarterly comparisons showed strong earnings above the +25% minimum guideline (C criteria) and its annual earnings (A criteria) history has been strong since reaching profitability in FY '15.
The current Up/Down Volume Ratio of 1.4 is an unbiased indication its shares have been under accumulation over the past 50 days. Its Timeliness Rating is A and Sponsorship Rating is B.The number of top-rated funds owning its shares rose from 748 in Jun '17 to 832 in Mar '18, a reassuring sign concerning the I criteria.
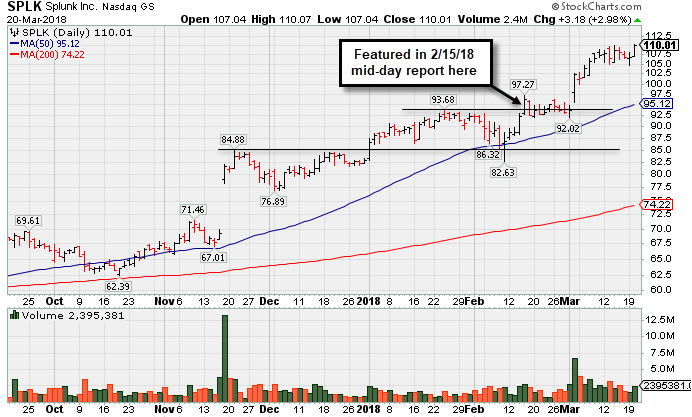
Extended After Rallying from Secondary Buy Point - Tuesday, March 20, 2018
Splunk Inc (SPLK +$3.18 or +2.98% to $110.01) posted a gain for a new all-time high, getting more extended from any sound base. Disciplined investors avoid chasing extended stocks. Its 50-day moving average (DMA) line and ($95.12) prior highs define support to watch on pullbacks.
Bullish action came after it reported earnings +76% on +37% sales revenues for the quarter ended January 31, 2018 versus the year ago period. It was highlighted in yellow in the 2/15/18 mid-day report (read here) and last shown in this FSU section on 2/16/18 with an annotated graph under the headline, "Pulled Back to 10-Week Moving Average After Technical Breakout"). A valid secondary buy point existed up to +5% above the prior high.
The high-ranked Computer Software - Database firm reported earnings +70% on +34% sales revenues for the Oct '17 quarter. The past 3 quarterly comparisons showed strong earnings above the +25% minimum guideline (C criteria) and its annual earnings (A criteria) history has been strong since reaching profitability in FY '15.
The current Up/Down Volume Ratio of 1.2 is an unbiased indication its shares have been under accumulation over the past 50 days. Its Timeliness Rating is A and Sponsorship Rating is B.The number of top-rated funds owning its shares rose from 749 in Mar '17 to 809 in Dec '17, a reassuring sign concerning the I criteria.
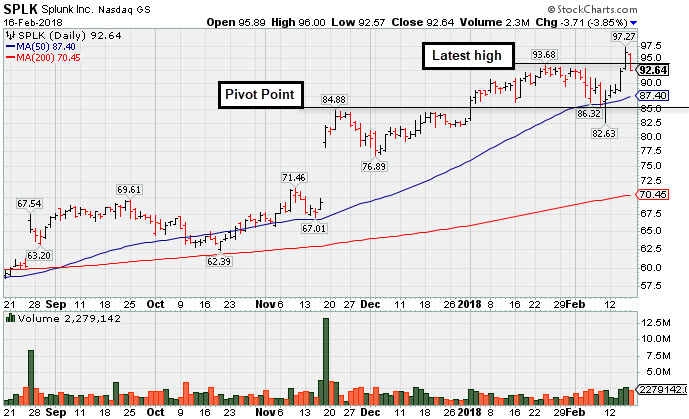
Pulled Back to 10-Week Moving Average After Technical Breakout - Friday, February 16, 2018
Splunk Inc (SPLK -$3.71 or -3.85% to $92.64) pulled back today after hitting new multi-year highs with volume-driven gains. It was highlighted in yellow in the 2/15/18 mid-day report (read here). A valid secondary buy point exists up to +5% above the prior high since finding support at the 10-week moving average (WMA) after the prior breakout.
The high-ranked Reported earnings +70% on +34% sales revenues for the Oct '17 quarter. Three of the past 4 quarterly comparisons showed strong earnings above the +25% minimum guideline (C criteria) and its annual earnings (A criteria) history has been strong since reaching profitability in FY '15.
The current Up/Down Volume Ratio of 1.5 is an unbiased indication its shares have been under accumulation over the past 50 days. Its Timeliness Rating is A and Sponsorship Rating is B.The number of top-rated funds owning its shares rose from 749 in Mar '17 to 790 in Dec '17, a reassuring sign concerning the I criteria.