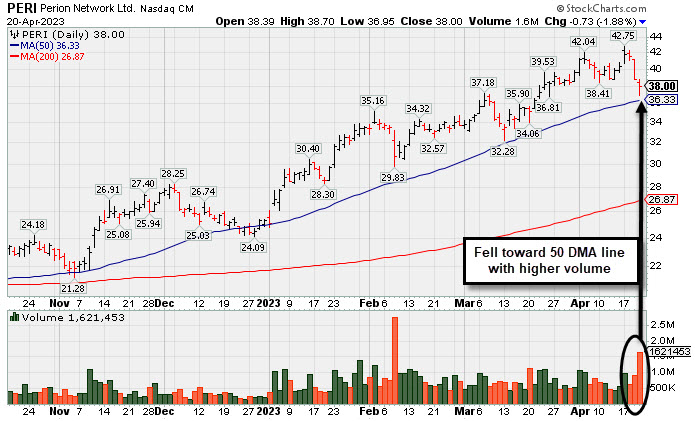
Perion Pulls Back Toward 50-Day Moving Average Line - Thursday, April 20, 2023
Perion Networks Ltd (PERI -$0.73 or -1.88% to $38.00) suffered a 3rd consecutive loss today with ever-increasing volume, abruptly retreating from its all-time high. Its 50-day moving average (DMA) line ($36.33) defines important near-term support to watch. Below its 50 DMA line, the prior high ($33) defines important near-term support. Any violations would raise concerns and trigger technical sell signals.
PERI was highlighted in yellow in the 1/25/23 mid-day report (read here) with pivot point cited based upon its 11/15/21 high plus 10 cents. It was last shown in this FSU section in greater detail on 3/31/23 with an annotated graph under the headline, "Hit Another New High With Gain Backed by Light Volume".
PERI has a 98 Earnings Per Share Rating. It reported Dec '22 quarterly earnings +45% on +33% sales revenues versus the year ago period and its prior quarterly earnings history has been above the +25% minimum (C criteria). Its annual earnings (A criteria) history has been improving steadily after a downturn from FY '15-18. It hails from the Commercial Services-Advertising group which is currently ranked 69th on the 197 Industry Groups list.
There are 45.8 million shares outstanding which can contribute to greater price volatility in the event of institutional buying or selling. The number of top-rated funds owning its shares rose from 113 in Mar '22 to 169 in Mar '23, a reassuring sign concerning the I criteria. Its current Up/Down Volume Ratio of 1.5 is an unbiased indication its shares have been under accumulation over the past 50 days.
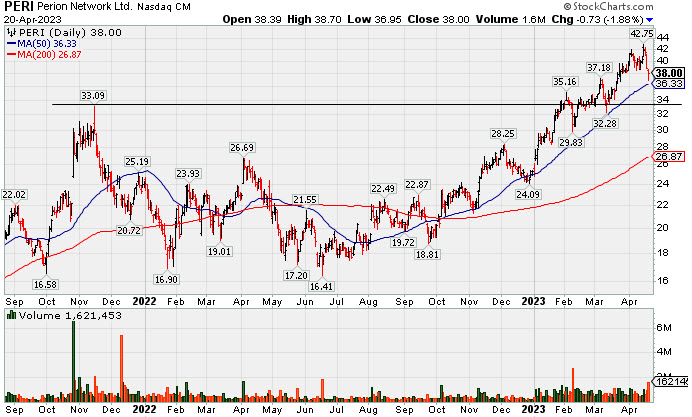
Charts below illustrate the pullback to the 50 DMA line, followed by the longer-term chart which provides context since the technical breakout noted in earlier reports.
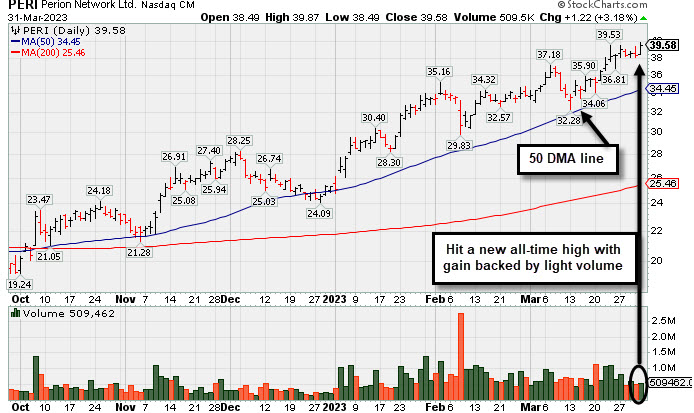
Hit Another New High With Gain Backed by Light Volume - Friday, March 31, 2023
Perion Networks Ltd (PERI +$1.22 or +3.18% to $39.58) quiety hit a new all-time high. It found support when recently consolidating above its 50-day moving average (DMA) line ($34.45). The 50 DMA line and prior high ($33) define important near-term support where violations would raise concerns and trigger technical sell signals.
PERI was highlighted in yellow in the 1/25/23 mid-day report (read here) with pivot point cited based upon its 11/15/21 high plus 10 cents. It was last shown in this FSU section in greater detail on 3/15/23 with an annotated graph under the headline, "Consolidating in an Orderly Manner Above Old High and 50 DMA Line".
PERI has a 98 Earnings Per Share Rating. It reported Dec '22 quarterly earnings +45% on +33% sales revenues versus the year ago period and its prior quarterly earnings history has been above the +25% minimum (C criteria). Its annual earnings (A criteria) history has been improving steadily after a downturn from FY '15-18. It hails from the Commercial Services-Advertising group which is currently ranked 61st on the 197 Industry Groups list.
There are 45.8 million shares outstanding which can contribute to greater price volatility in the event of institutional buying or selling. The number of top-rated funds owning its shares rose from 113 in Mar '22 to 143 in Dec '22, a reassuring sign concerning the I criteria. Its current Up/Down Volume Ratio of 1.7 is an unbiased indication its shares have been under accumulation over the past 50 days.
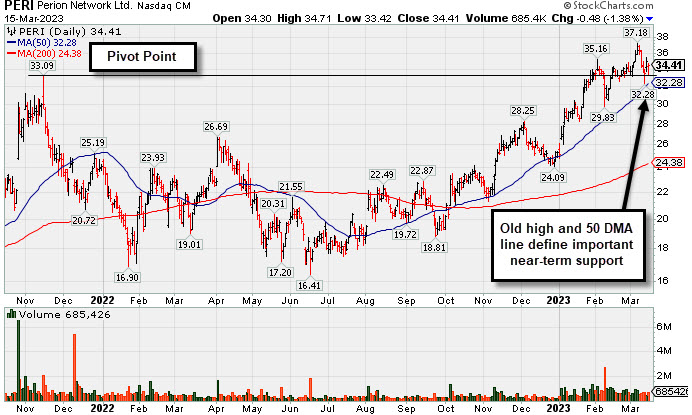
Consolidating in an Orderly Manner Above Old High and 50 DMA Line - Wednesday, March 15, 2023
Perion Networks Ltd (PERI -$0.48 or -1.38% to $34.41) has suffered 5 losses with below average volume in the span of 6 session since hitting new all-time highs with recent gains backed by above average volume. Its prior high ($33) and 50-day moving average (DMA) line ($32.28) define important near-term support where violations would raise concerns and trigger technical sell signals.
PERI was highlighted in yellow in the 1/25/23 mid-day report (read here) with pivot point cited based upon its 11/15/21 high plus 10 cents. It was last shown in this FSU section in greater detail on 2/22/23 with an annotated graph under the headline, "Perion Stubbornly Holding Ground Near High After Spurt of Gains".
PERI has a 98 Earnings Per Share Rating. It reported Dec '22 quarterly earnings +45% on +33% sales revenues versus the year ago period and its prior quarterly earnings history has been above the +25% minimum (C criteria). Its annual earnings (A criteria) history has been improving steadily after a downturn from FY '15-18. It hails from the Commercial Services-Advertising group which is currently ranked 76th on the 197 Industry Groups list.
There are 45.8 million shares outstanding which can contribute to greater price volatility in the event of institutional buying or selling. The number of top-rated funds owning its shares rose from 113 in Mar '22 to 144 in Dec '22, a reassuring sign concerning the I criteria. Its current Up/Down Volume Ratio of 1.7 is an unbiased indication its shares have been under accumulation over the past 50 days.
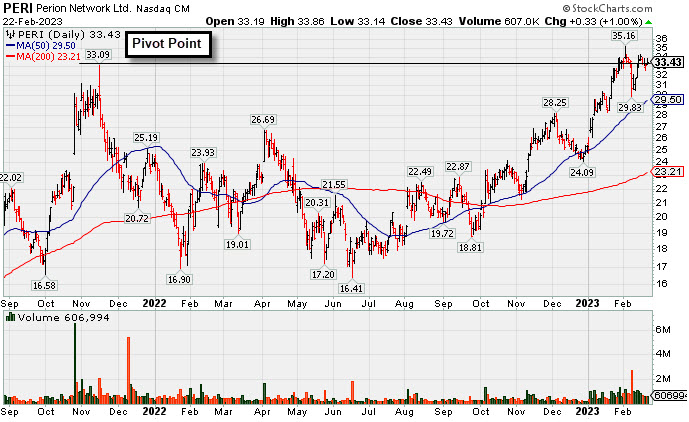
Perion Stubbornly Holding Ground Near High After Spurt of Gains - Wednesday, February 22, 2023
Perion Networks Ltd (PERI +$0.33 or +1.00% to $33.43) finished higher today and has been hovering near its 52-week high, showing resiience after undercutting its pivot point. The next important suppport to watch is its 50-day moving average (DMA) line ($29.50).
PERI was highlighted in yellow in the 1/25/23 mid-day report (read here) with pivot point cited based upon its 11/15/21 high plus 10 cents. It was shown in this FSU section in greater detail that evening with an annotated graph under the headline, "Spurt of Volume-Driven Gains Challenging Prior High".
PERI has a 98 Earnings Per Share Rating. It reported Dec '22 quarterly earnings +45% on +33% sales revenues versus the year ago period and its prior quarterly earnings history has been above the +25% minimum (C criteria). Its annual earnings (A criteria) history has been improving steadily after a downturn from FY '15-18. It hails from the Commercial Services-Advertising group which is currently ranked 43rd on the 197 Industry Groups list.
There are 45.8 million shares outstanding which can contribute to greater price volatility in the event of institutional buying or selling. The number of top-rated funds owning its shares rose from 113 in Mar '22 to 142 in Dec '22, a reassuring sign concerning the I criteria. Its current Up/Down Volume Ratio of 1.50 is an unbiased indication its shares have been under accumulation over the past 50 days.
There are 45.8 million shares outstanding which can contribute to greater price volatility in the event of institutional buying or selling. The number of top-rated funds owning its shares rose from 113 in Mar '22 to 142 in Dec '22, a reassuring sign concerning the I criteria. Its current Up/Down Volume Ratio of 1.50 is an unbiased indication its shares have been under accumulation over the past 50 days.
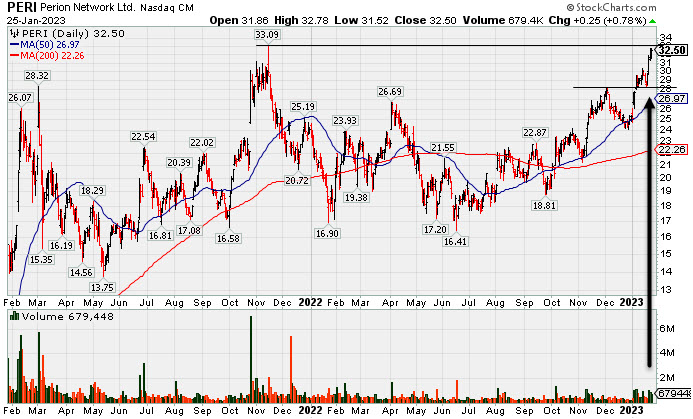
Spurt of Volume-Driven Gains Challenging Prior High - Wednesday, January 25, 2023
Perion Networks Ltd (PERI +$0.25 or +0.78% or $32.50) overcame early weakness to finished higher after highlighted in yellow in the earlier mid-day report (read here) with pivot point cited based upon its 11/15/21 high plus 10 cents. It posted a 4th consecutive gain and 3rd consecutive gain backed by above average volume while challenging the Nov '21 high in the $33 area. Subsequent gains above the pivot point backed by at least +40% above average volume may trigger a technical buy signal. It found support near its 50-day moving average (DMA) line i($26.97) in recent weeks.
PERI has a 97 Earnings Per Share Rating. It reported Sep '22 quarterly earnings +53% on +31% sales revenues versus the year ago period and its prior quarterly earnings history has been above the +25% minimum (C criteria). Its annual earnings (A criteria) history has been improving steadily after a downturn from FY '15-18. It hails from the Commercial Services-Advertising group which is currently ranked 77th on the 197 Industry Groups list.
There are 45.1 million shares outstanding which can contribute to greater price volatility in the event of institutional buying or selling. The number of top-rated funds owning its shares rose from 113 in Mar '22 to 130 in Dec '22, a reassuring sign concerning the I criteria. Its current Up/Down Volume Ratio of 2.0 is an unbiased indication its shares have been under accumulation over the past 50 days.