Rose Near 50-Day Moving Average Which May Act as Resistance - Friday, March 3, 2023
Griffon Corporation (GFF+$0.40 or +1.06% to $38.01) posted a 2nd gain with lighter volume. A rebound above the 50-day moving average (DMA) line ($38.24) is needed for its outlook to improve. It violated its 50 DMA line with a damaging volume-driven loss triggering a technical sell signal on 2/21/23. More damaging losses below the recent low ($35.82 on 3/02/23) would raise greater concerns.Fundamentals remain strong after it reported Dec '22 quarterly earnings +121% on +10% sales revenues versus the year ago period, continuing its strong earniongs track record. It has a 99 Earnings Per Share Rating. Annual earnings (A criteria) growth has been strong and steady.
GFF was highlighted in yellow with new pivot point cited based on its 9/09/22 high plus 10 cents in the 11/11/22 mid-day report (read here). It was last shown in greater detail on 2/02/23 with an annotated graph under the headline, "Extended From Any Sound Base and Still Hitting New Highs".
The company has only 57.2 million shares outstanding (S criteria) which can contribute to greater volatility in the event of institutional buying or selling. The number of top-dated funds owning its shares rose from 331 in Mar '22 to 383 in Dec '22. Its current Up/Down Volume Ratio of 1.4 is an unbiased indication its shares have been under accumulation over the past 50 days. It has an A Timeliness rating and an A Sponsorship Rating.
Chart courtesy of www.stockcharts.com

Extended From Any Sound Base and Still Hitting New Highs - Thursday, February 2, 2023
Griffon Corporation (GFF +$1.02 or +2.49% to $42.04) hit a new 52-week high and finished near the session high today with its 3rd consecutive gain backed by +27% above average volume. It is extended from any sound base. Its 50-day moving average (DMA) line ($36.90) defines near-term support to watch on pullbacks.Fundamentals remain strong after it reported Dec '22 quarterly earnings +121% on +10% sales revenues versus the year ago period, continuing its strong earniongs track record. It has a 99 Earnings Per Share Rating. Annual earnings (A criteria) growth has been strong and steady.
GFF was highlighted in yellow with new pivot point cited based on its 9/09/22 high plus 10 cents in the 11/11/22 mid-day report (read here). It was last shown in greater detail on 1/19/23 with an annotated graph under the headline, "Showed Resilience Following Negative Reversal at 52-Week High".
The company has only 57.1 million shares outstanding (S criteria) which can contribute to greater volatility in the event of institutional buying or selling. The number of top-dated funds owning its shares rose from 331 in Mar '22 to 376 in Dec '22. Its current Up/Down Volume Ratio of 2.4 is an unbiased indication its shares have been under accumulation over the past 50 days. It has an A Timeliness rating and an A Sponsorship Rating.
Chart courtesy of www.stockcharts.com

Showed Resilience Following Negative Reversal at 52-Week High - Thursday, January 19, 2023
Griffon Corporation (GFF -$0.21 or -0.54% to $38.36) finished near the session high today after early weakness. On the prior session there was a "negative reversal" at its 52-week high. After recent volume-driven gains its 50-day moving average (DMA) line ($35.62) defines important near-term support to watch above recent lows in the $33.82 area.Fundamentals remain strong after it recently reported Sep '22 quarterly earnings +230% on +24% sales revenues versus the year ago period. It has a 99 Earnings Per Share Rating. Annual earnings (A criteria) growth has been strong and steady.
GFF was highlighted in yellow with new pivot point cited based on its 9/09/22 high plus 10 cents in the 11/11/22 mid-day report (read here). It was last shown in greater detail on 1/04/22 with an annotated graph under the headline, "Rose Above Max Buy Level With 4th Consecutive Gain".
The company has only 57.1 million shares outstanding (S criteria) which can contribute to greater volatility in the event of institutional buying or selling. The number of top-dated funds owning its shares rose from 331 in Mar '22 to 372 in Dec '22. Its current Up/Down Volume Ratio of 2.5 is an unbiased indication its shares have been under accumulation over the past 50 days. It has an A Timeliness rating and an A Sponsorship Rating.
Chart courtesy of www.stockcharts.com

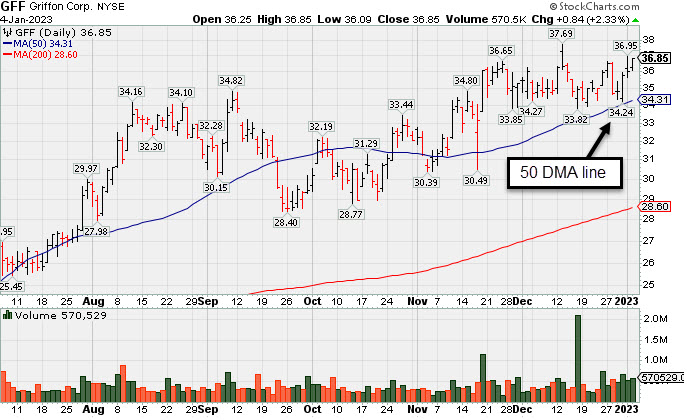
Rose Above Max Buy Level With 4th Consecutive Gain - Wednesday, January 4, 2023
Griffon Corporation (GFF +$0.84 or +2.33% to $36.85)`posted a 4th consecutive gain today rising above its "max buy" level. It recently found support when consolidating near prior highs in the $34 area and above its 50-day moving average (DMA) line ($34.34).
Fundamentals remain strong after it recently reported Sep '22 quarterly earnings +230% on +24% sales revenues versus the year ago period. It has a 99 Earnings Per Share Rating. Annual earnings (A criteria) growth has been strong and steady.
GFF was highlighted in yellow with new pivot point cited based on its 9/09/22 high plus 10 cents in the 11/11/22 mid-day report (read here). It was last shown in greater detail on 12/07/22 with an annotated graph under the headline, "No Meaningful Progress After Breakout 3 Weeks Ago".
The company has only 57.1 million shares outstanding (S criteria) which can contribute to greater volatility in the event of institutional buying or selling. The number of top-dated funds owning its shares rose from 331 in Mar '22 to 367 in Dec '22. Its current Up/Down Volume Ratio of 2.1 is an unbiased indication its shares have been under accumulation over the past 50 days. It has an A Timeliness rating and an A Sponsorship Rating.
Chart courtesy of www.stockcharts.com
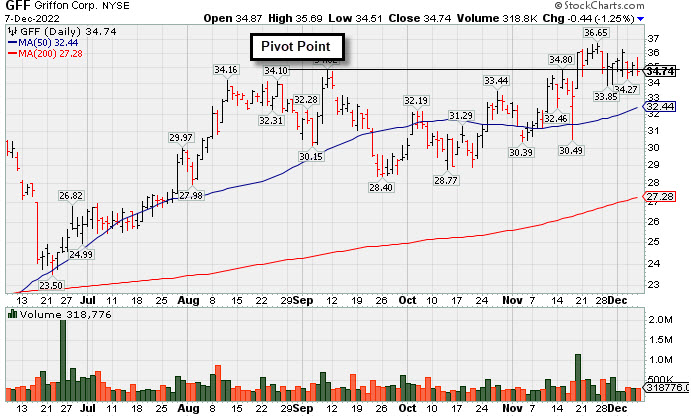
No Meaningful Progress After Breakout 3 Weeks Ago - Wednesday, December 7, 2022
Griffon Corporation (GFF -$0.44 or -1.25% to $34.74) is consolidating near prior highs in the $34 area and well above its 50-day moving average (DMA) line ($32.51). It showed bullish action but made no meaningful price progress in recent weeks since reporting Sep '22 quarterly earnings +230% on +24% sales revenues versus the year ago period.
Fundamentals remain strong. It has a 99 Earnings Per Share Rating. Annual earnings (A criteria) growth has been strong and steady. GFF was highlighted in yellow with new pivot point cited based on its 9/09/22 high plus 10 cents in the 11/11/22 mid-day report (read here) and shown in greater detail that evening with an annotated graph under the headline, "Griffon Perched Near 52-Week High After 9-Week Base".
The company has only 57.1 million shares outstanding (S criteria) which can contribute to greater volatility in the event of institutional buying or selling. The number of top-dated funds owning its shares rose from 331 in Mar '22 to 366 in Sep '22. Its current Up/Down Volume Ratio of 1.6 is an unbiased indication its shares have been under accumulation over the past 50 days. It has an A Timeliness rating and a B Sponsorship Rating.
Chart courtesy of www.stockcharts.com
Griffon Perched Near 52-Week High After 9-Week Base - Friday, November 11, 2022
Griffon Corporation (GFF +$0.52 or +1.53% to $34.40) was highlighted in yellow with new pivot point cited based on its 9/09/22 high plus 10 cents in the earlier mid-day report (read here). It is perched within close striking distance of its 52-week high after a volume-driven gain on the prior session. Subsequent gains above the pivot point backed by at least +40% above average volume may trigger a technical buy signal.
GFF was last shown in greater detail on 9/15/22 with an annotated graph under the headline, "Griffon Near All-Time High Making Limited Progress". It showed resilience since dropped from the Featured Stocks list on 9/23/22. Fresh signs of institutional buying demand, gains backed by heavier volume, would be a reassuring sign of it being capable of a meaningful advance.
Fundamentals remain strong. It is due to report Sep '22 quarterly results on 11/16/22. Volume and volatility often increase near earnings news. It has a 99 Earnings Per Share Rating. It reported Jun '22 quarterly earnings +215% on +31% sales revenues versus the year ago period, its 3rd strong quarterly comparison above the +25% minimum guideline (C criteria). Annual earnings (A criteria) growth has been strong and steady.
The company has only 57.1 million shares outstanding (S criteria) which can contribute to greater volatility in the event of institutional buying or selling. The number of top-dated funds owning its shares rose from 331 in Mar '22 to 354 in Sep '22. Its current Up/Down Volume Ratio of 1.1 is an unbiased indication its shares have been under slight accumulation over the past 50 days.
Chart courtesy of www.stockcharts.com

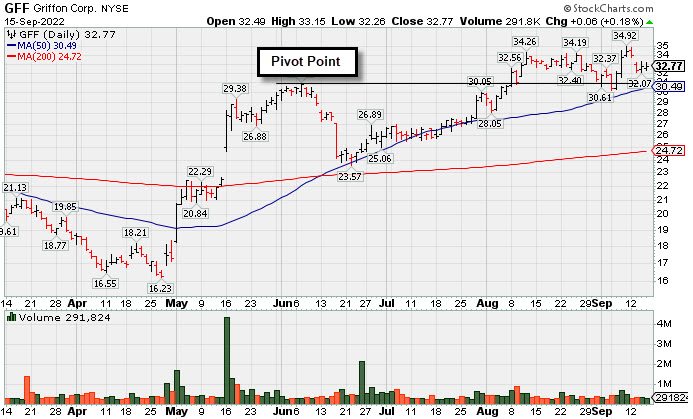
Griffon Near All-Time High Making Limited Progress - Thursday, September 15, 2022
Griffon Corporation (GFF +$0.06 or +0.18% to $32.77) has held its ground after a 9/13/22 gap down, retreating from its all-time high. Its color code was changed to yellow after pulling back below its "max buy" level. Prior lows and its 50-day moving average (DMA) line define important near-term support in the $30 area.
GFF has not made much meaningful progress since highlighted in yellow with pivot point cited based on its 6/07/22 high plus 10 cents in the 8/08/22 mid-day report (read here). It was last shown in greater detail on 8/25/22 with an annotated graph under the headline, "Best Ever Close With Gain on Lighter Volume". Fresh signs of institutional buying demand, gains backed by heavier volume, would be a reassuring sign.
GFF has a 99 Earnings Per Share Rating. It reported Jun '22 quarterly earnings +215% on +31% sales revenues versus the year ago period, its 3rd strong quarterly comparison above the +25% minimum guideline (C criteria). Annual earnings (A criteria) growth has been strong and steady.
The company has only 57 million shares outstanding (S criteria) which can contribute to greater volatility in the event of institutional buying or selling. The number of top-dated funds owning its shares rose from 331 in Mar '22 to 350 in Jun '22. Its current Up/Down Volume Ratio of 1.1 is an unbiased indication its shares have been under slight accumulation over the past 50 days.
Chart courtesy of www.stockcharts.com
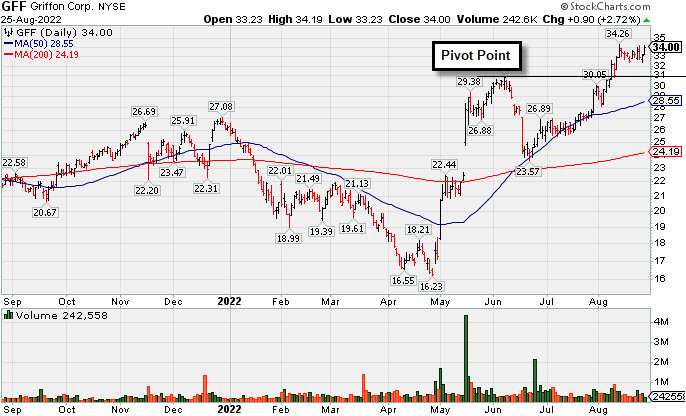
Best Ever Close With Gain on Lighter Volume - Thursday, August 25, 2022
Griffon Corporation (GFF +$0.90 or +2.72% to $34.00) posted a gain today backed by lighter than average volume as it managed a best-ever close after recently hovering near its 52-week high, stubbornly holding its ground. Prior highs in the $31 area define initial support to watch on pullbacks.
GFF was highlighted in yellow with pivot point cited based on its 6/07/22 high plus 10 cents in the 8/08/22 mid-day report (read here). It was shown in greater detail that evening with an annotated graph under the headline, "Breakout for New High Backed by +52% Above Average Volume".
GFF has a 99 Earnings Per Share Rating. It reported Jun '22 quarterly earnings +215% on +31% sales revenues versus the year ago period, its 3rd strong quarterly comparison above the +25% minimum guideline (C criteria). Annual earnings (A criteria) growth has been strong and steady.
The company has only 57 million shares outstanding (S criteria) which can contribute to greater volatility in the event of institutional buying or selling. The number of top-dated funds owning its shares rose from 331 in Mar '22 to 347 in Jun '22. Its current Up/Down Volume Ratio of 1.8 is an unbiased indication its shares have been under accumulation over the past 50 days.
Chart courtesy of www.stockcharts.com
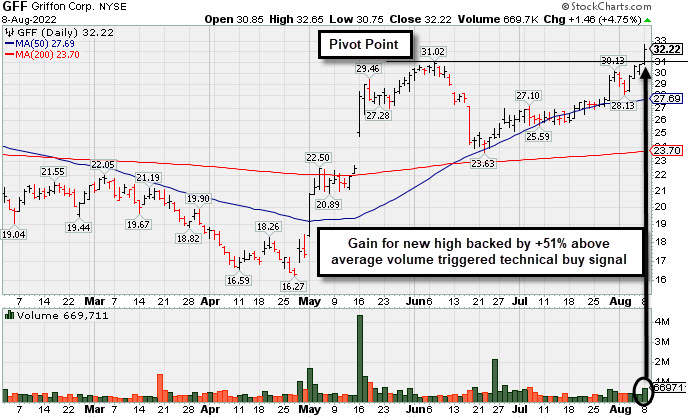
Breakout for New High Backed by +52% Above Average Volume - Monday, August 8, 2022
Griffon Corporation (GFF +$1.46 or +4.75% to $32.22) finished strong after highlighted in yellow with pivot point cited based on its 6/07/22 high plus 10 cents in the earlier mid-day report (read here). It hit a new high with today's 4th consecutive gain and close above the pivot point backed by +51% above average volume triggering a technical buy signal. Prior highs define initial support to watch on pullbacks.
GFF has a 99 Earnings Per Share Rating. It reported Jun '22 quarterly earnings +215% on +31% sales revenues versus the year ago period, its 3rd strong quarterly comparison above the +25% minimum guideline (C criteria). Annual earnings (A criteria) growth has been strong and steady.
The company has only 57 million shares outstanding (S criteria) which can contribute to greater volatility in the event of institutional buying or selling. The number of top-dated funds owning its shares fell from 355 in Sep '21 to 336 in Jun '22. However, its current Up/Down Volume Ratio of 2.3 is an unbiased indication its shares have been under accumulation over the past 50 days.
Chart courtesy of www.stockcharts.com