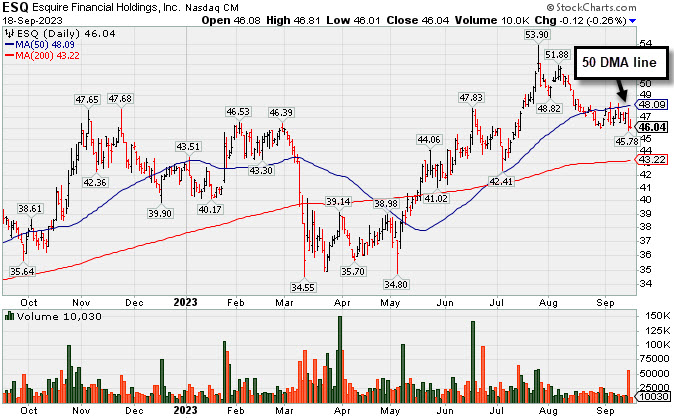
Met Resistance at 50-Day Moving Average After Slumping - Monday, September 18, 2023
Esquire Financial Hldgs (ESQ -$0.12 or -0.26% to $46.04) was little changed today but suffered a volume-driven loss on the prior session. Its 50-day moving average (DMA) line ($48) acted as resistance in recent weeks while slipping below prior highs in the $47 area. A rebound above the 50 DMA line is needed for its outlook to improve.
ESQ was highlighted in yellow with pivot point cited based on its 11/04/22 high plus 10 cents in the 7/14/23 mid-day report (read here). It was last covered in great detail on 8/15/23 with an annotated graph under the headline, "Pullback with Light Volume Testing Important Support Level".
Fundamentals remain strong after it reported Jun '23 quarterly earnings +41% on +35% sales revenues versus the year ago period, continuing its strong earnings track record. It has a highest possible 99 Earnings Per Share Rating. It has reported 5 consecutive quarterly comparisons with an earnings increase above the +25% minimum guideline (C criteria). Its annual earnings growth (A criteria) history has been strong.
This thinly-traded holding company in the Finance - Commercial Loans industry group has a small supply (S criteria) of only 6.5 million shares in the public float, which can contribute to greater price volatility in the event of institutional buying or selling. It completed its $14 IPO on 6/29/17. The number of top-rated funds owning its shares rose form 64 in Sep '21 to 202 in Jun '23, a reassuring sign concerning the I criteria. Its current Up/Down Volume Ratio of 1.2 is an unbiased indication its shares have been under accumulation over the past 50 days.
Chart courtesy of www.stockcharts.com
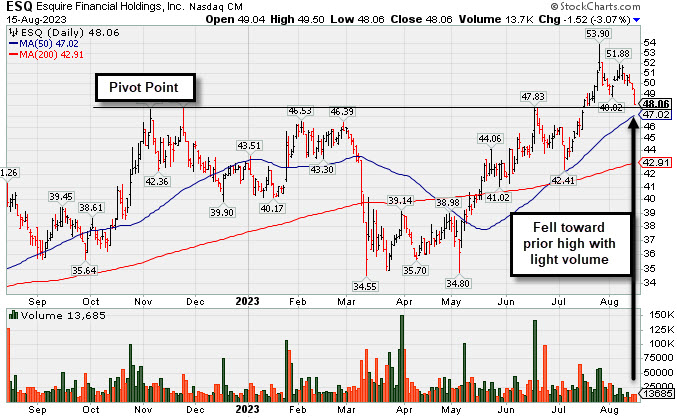
Pullback with Light Volume Testing Important Support Level - Tuesday, August 15, 2023
Esquire Financial Hldgs (ESQ -$1.52 or -3.07% to $48.06) fell for a 3rd consecutive loss with below-average volume. It is testing prior highs in the $47 which define important near-term support coinciding with its 50-day moving average (DMA) line ($47.13). More damaging losses would raise greater concenrs and trigger technical sell signals.
ESQ was highlighted in yellow with pivot point cited based on its 11/04/22 high plus 10 cents in the 7/14/23 mid-day report (read here). It was covered in greater detail with an annotated graph that evening under the headline, "Esquire Perched Near Prior Highs". Subsequent gains above the pivot point triggered a proper technical buy signal.
Fundamentals remain strong after it reported Jun '23 quarterly earnings +41% on +35% sales revenues versus the year ago period, continuing its strong earnings track record. It has a highest possible 99 Earnings Per Share Rating. It has reported 5 consecutive quarterly comparisons with an earnings increase above the +25% minimum guideline (C criteria). Its annual earnings growth (A criteria) history has been strong.
This thinly-traded holding company in the Finance - Commercial Loans industry group has a small supply (S criteria) of only 6.5 million shares in the public float, which can contribute to greater price volatility in the event of institutional buying or selling. It completed its $14 IPO on 6/29/17. The number of top-rated funds owning its shares rose form 64 in Sep '21 to 200 in Jun '23, a reassuring sign concerning the I criteria. Its current Up/Down Volume Ratio of 1.3 is an unbiased indication its shares have been under accumulation over the past 50 days.
Chart courtesy of www.stockcharts.com
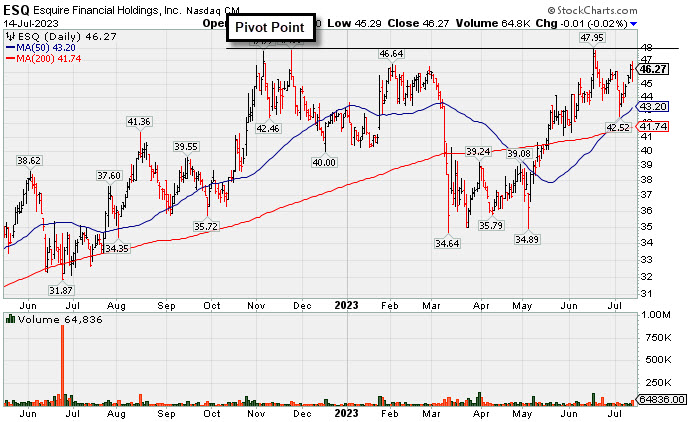
Esquire Perched Near Prior Highs - Friday, July 14, 2023
Esquire Financial Hldgs (ESQ -$0.01 or -0.02% to $46.27) finished flat after highlighted in yellow with pivot point cited based on its 11/04/22 high plus 10 cents in the earlier mid-day report (read here). Subsequent gains above the pivot point backed by at least +40% above average volume are needed to trigger a proper technical buy signal. Reported Mar '23 quarterly earnings +68% on +71% sales revenues versus the year ago period, continuing its strong earnings track record. Found support above the 50 DMA line ($43.21) and it is perched within close striking distance of its 52-week high. Slumped below its 200 DMA line then rebounded since dropped from the Featured Stocks list on 12/29/22.
ESQ went through a deep consolidation below its 200 DMA line then rebounded since last shown in this FSU section on 12/22/22 with an annotated graph under the headline, "Found Support Recently Near Pivot Point and Prior Highs". This thinly-traded holding company in the Finance - Commercial Loans industry group has a small supply (S criteria) of only 6.5 million shares in the public float, which can contribute to greater price volatility in the event of institutional buying or selling. It completed its $14 IPO on 6/29/17. The number of top-rated funds owning its shares rose form 64 in Sep '21 to 206 in Jun '23, a reassuring sign concerning the I criteria. Its current Up/Down Volume Ratio of 1.3 is an unbiased indication its shares have been under accumulation over the past 50 days.
ESQ has a highest possible 99 Earnings Per Share Rating. It has reported 7 consecutive quarterly comparisons with an earnings increase above the +25% minimum guideline (C criteria). Its annual earnings growth (A criteria) history has been strong.
Chart courtesy of www.stockcharts.com
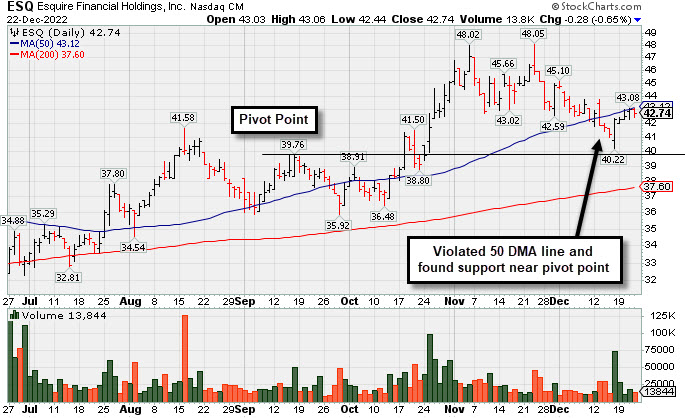
Found Support Recently Near Pivot Point and Prior Highs - Thursday, December 22, 2022
Esquire Financial Hldgs (ESQ -$0.28 or -0.65% to $42.74) managed a "positive reversal" on 12/16/22 finding support near the pivot point and prior highs. However, it has been meeting resistance when rebounding to its 50-day moving average (DMA) line ($43.16). Gains above the 50 DMA line are needed for its outlook to improve.
ESQ was highlighted in yellow with pivot point cited based on its 9/16/22 high plus 10 cents. It was last shown in this FSU section on 11/25/22 with an annotated graph under the headline, "Pulled Back Following "Negative Reversal" at All-Time High". This thinly-traded holding company in the Finance - Commercial Loans industry group has a small supply (S criteria) of only 6.5 million shares in the public float, which can contribute to greater price volatility in the event of institutional buying or selling. It completed its $14 IPO on 6/29/17. The number of top-rated funds owning its shares rose form 64 in Sep '21 to 171 in Sep '22, a reassuring sign concerning the I criteria. Its current Up/Down Volume Ratio of 1.5 is an unbiased indication its shares have been under accumulation over the past 50 days.
ESQ has a 98 Earnings Per Share Rating. It reported earnings +49% on +36% sales revenues for the Sep '22 quarter versus the year-ago period, the 5th consecutive quarterly comparison with an earnings increase above the +25% minimum guideline. Its annual earnings growth (A criteria) history has been strong.
Chart courtesy of www.stockcharts.com
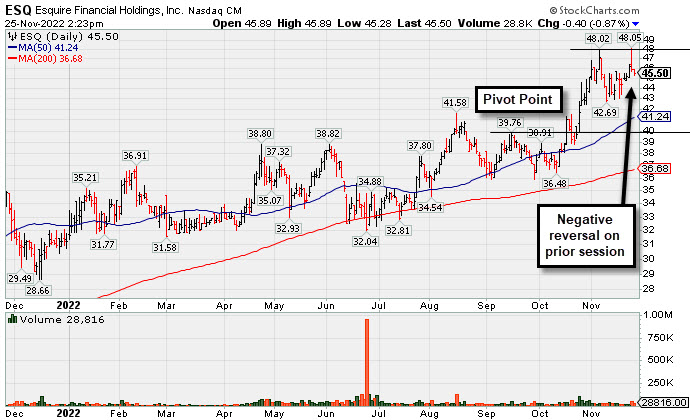
Pulled Back Following "Negative Reversal" at All-Time High - Friday, November 25, 2022
Esquire Financial Hldgs (ESQ -$0.80 or -1.74% to $45.10) pulled back today. It challenged its high on the prior session but there was a "negative reversal" and it closed near the session low with a small loss on above average volume. Prior highs and its 50-day moving average (DMA) line coincide in the $41 area defining important near-term support to watch.
ESQ was highlighted in yellow with pivot point cited based on its 9/16/22 high plus 10 cents. It was last shown in this FSU section on 10/31/22 with an annotated graph under the headline, "New High With 6th Consecutive Volume-Driven Gain". This thinly-traded holding company in the Finance - Commercial Loans industry group has a small supply (S criteria) of only 6.5 million shares in the public float, which can contribute to greater price volatility in the event of institutional buying or selling. It completed its $14 IPO on 6/29/17. The number of top-rated funds owning its shares rose form 64 in Sep '21 to 167 in Sep '22, a reassuring sign concerning the I criteria. Its current Up/Down Volume Ratio of 1.7 is an unbiased indication its shares have been under accumulation over the past 50 days.
ESQ has a 98 Earnings Per Share Rating. It reported earnings +49% on +36% sales revenues for the Sep '22 quarter versus the year-ago period, the 5th consecutive quarterly comparison with an earnings increase above the +25% minimum guideline. Its annual earnings growth (A criteria) history has been strong.
Chart courtesy of www.stockcharts.com
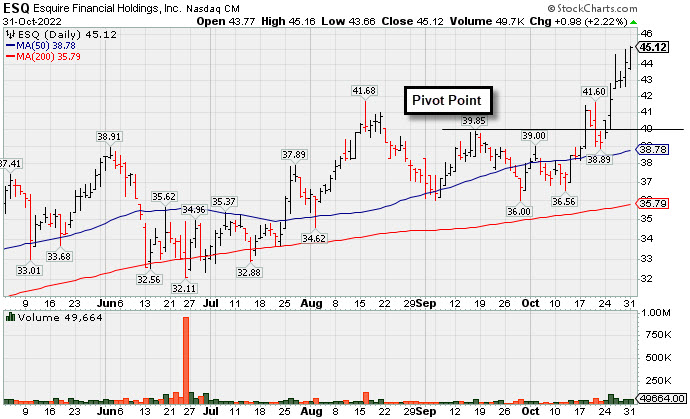
New High With 6th Consecutive Volume-Driven Gain - Monday, October 31, 2022
Esquire Financial Hldgs (ESQ +$1.04 or +2.36% to $45.18) hit another new 52-week high with today's 6th consecutive volume-driven gain, getting extended from the previously noted base. Prior highs in the $41 area define initial support to watch on pullbacks.
ESQ was highlighted in yellow in the 7/26/22 mid-day report (read here) with pivot point cited based on its 4/25/22 high plus 10 cents. It was last shown in this FSU section on 10/07/22 with an annotated graph under the headline, "Rebound Above 50-Day Moving Average Needed for Outlook to Improve". This thinly-traded holding company in the Finance - Commercial Loans industry group has a small supply (S criteria) of only 6.5 million shares in the public float, which can contribute to greater price volatility in the event of institutional buying or selling. It completed its $14 IPO on 6/29/17. The number of top-rated funds owning its shares rose form 64 in Sep '21 to 167 in Sep '22, a reassuring sign concerning the I criteria. Its current Up/Down Volume Ratio of 1.5 is an unbiased indication its shares have been under accumulation over the past 50 days.
ESQ has a 98 Earnings Per Share Rating. It reported earnings +49% on +36% sales revenues for the Sep '22 quarter versus the year-ago period, the 5th consecutive quarterly comparison with an earnings increase above the +25% minimum guideline. Its annual earnings growth (A criteria) history has been strong.
Chart courtesy of www.stockcharts.com
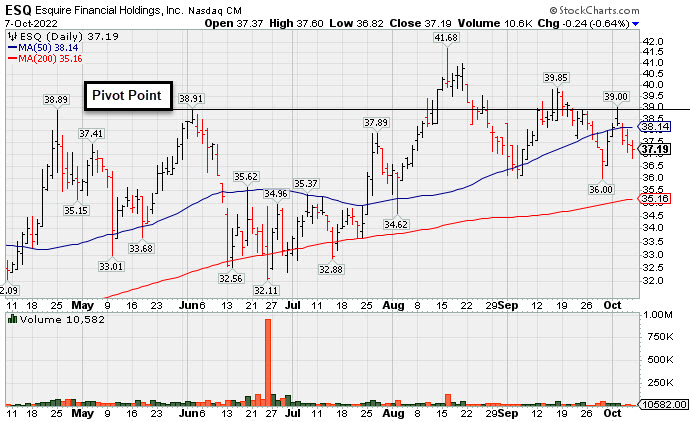
Rebound Above 50-Day Moving Average Needed for Outlook to Improve - Friday, October 7, 2022
Esquire Financial Hldgs (ESQ -$0.24 or -0.64% to $38.16) is sputtering below its 50-day moving average (DMA) line ($38.16) again. The recent slump below the pivot point raised concerns. A rebound above the 50 DMA line is needed for its outlook to improve. It faces some near-term resistance due to overhead supply up to the $41 level. Members have been reminded in recent market commentaries regarding the fact-based investment system's rules - "The market is in a correction (M criteria) and disciplined investors know to avoid new buying efforts until a new rally confirmed with a follow-through day."
ESQ was highlighted in yellow in the 7/26/22 mid-day report (read here) with pivot point cited based on its 4/25/22 high plus 10 cents. It was last shown in this FSU section on 9/20/22 with an annotated graph under the headline, "Thinly-Traded Esquire Still Perched Near High". This thinly-traded holding company in the Finance - Commercial Loans industry group has a small supply (S criteria) of only 6.5 million shares in the public float, which can contribute to greater price volatility in the event of institutional buying or selling. It completed its $14 IPO on 6/29/17. The number of top-rated funds owning its shares rose form 64 in Sep '21 to 149 in Jun '22, a reassuring sign concerning the I criteria. Its current Up/Down Volume Ratio of 1.0 is an unbiased indication its shares have been neutral concerning accumulation/distribution over the past 50 days.
ESQ has a 97 Earnings Per Share Rating. It reported earnings +37% on +23% sales revenues for the Jun '22 quarter versus the year-ago period, the 4th consecutive quarterly comparison with an earnings increase above the +25% minimum guideline. Its annual earnings growth (A criteria) history has been strong.
Chart courtesy of www.stockcharts.com
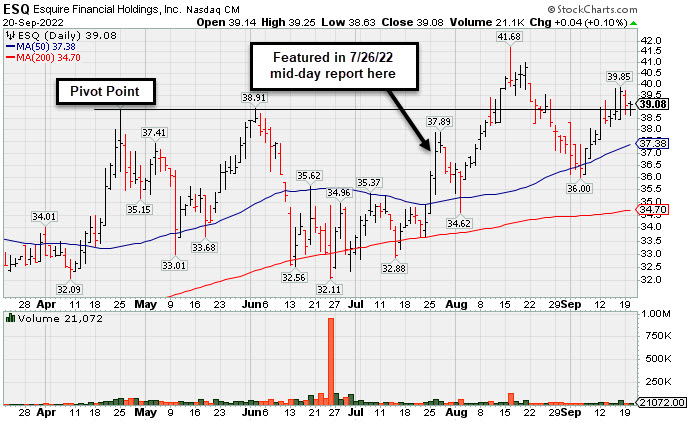
Thinly-Traded Esquire Still Perched Near High - Tuesday, September 20, 2022
Esquire Financial Hldgs (ESQ +$0.04 or +0.10% to $39.08) made steady progress after recently finding support near its 50-day moving average (DMA) line ($37.38). The recent gains back above the pivot point were a reassuring sign of fresh institutional buying. Members have been reminded in recent market commentaries regarding the fact-based investment system's rules - "The market is in a correction (M criteria) and disciplined investors know to avoid new buying efforts until a new rally confirmed with a follow-through day."
ESQ was highlighted in yellow in the 7/26/22 mid-day report (read here) with pivot point cited based on its 4/25/22 high plus 10 cents. It was last shown in this FSU section on 9/1/22 with an annotated graph under the headline, "Testing 50-Day Moving Average With 5th Straight Loss". This thinly-traded holding company in the Finance - Commercial Loans industry group has a small supply (S criteria) of only 6.5 million shares in the public float, which can contribute to greater price volatility in the event of institutional buying or selling. It completed its $14 IPO on 6/29/17. The number of top-rated funds owning its shares rose form 64 in Sep '21 to 138 in Jun '22, a reassuring sign concerning the I criteria. Its current Up/Down Volume Ratio of 1.1 is an unbiased indication its shares have been under slight accumulation over the past 50 days.
ESQ has a 97 Earnings Per Share Rating. It reported earnings +37% on +23% sales revenues for the Jun '22 quarter versus the year-ago period, the 4th consecutive quarterly comparison with an earnings increase above the +25% minimum guideline. Its annual earnings growth (A criteria) history has been strong.
Chart courtesy of www.stockcharts.com
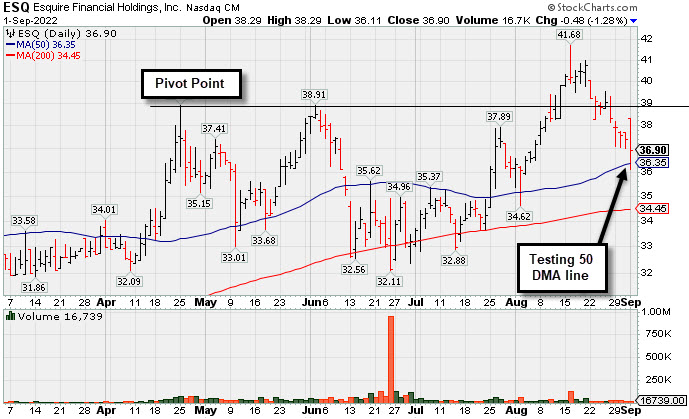
Testing 50-Day Moving Average With 5th Straight Loss - Thursday, September 1, 2022
Esquire Financial Hldgs (ESQ -$0.48 or -1.28% to $36.90) fell for a 5th consecutive loss with light volume. It has slumped in recent weeks after making little progress above previously stubborn resistance in the $39 area. It is testing its 50-day moving average DMA line ($36.41) which defines important near-term support to watch. Confirming gains back above the pivot point backed by at least +40% above average volume would be a reassuring sign of fresh institutional buying.
ESQ was highlighted in yellow in the 7/26/22 mid-day report (read here) with pivot point cited based on its 4/25/22 high plus 10 cents. It was last shown in this FSU section on 8/12/22 with an annotated graph under the headline, "Closed at Session High With Gain for New All-Time High". This thinly-traded holding company in the Finance - Commercial Loans industry group has a small supply (S criteria) of only 6.5 million shares in the public float, which can contribute to greater price volatility in the event of institutional buying or selling. It completed its $14 IPO on 6/29/17. The number of top-rated funds owning its shares rose form 64 in Sep '21 to 132 in Jun '22, a reassuring sign concerning the I criteria. Its current Up/Down Volume Ratio of 0.6 is an unbiased indication its shares have been under distributional pressure over the past 50 days.
ESQ has a 97 Earnings Per Share Rating. It reported earnings +37% on +23% sales revenues for the Jun '22 quarter versus the year-ago period, the 4th consecutive quarterly comparison with an earnings increase above the +25% minimum guideline. Its annual earnings growth (A criteria) history has been strong.
Chart courtesy of www.stockcharts.com
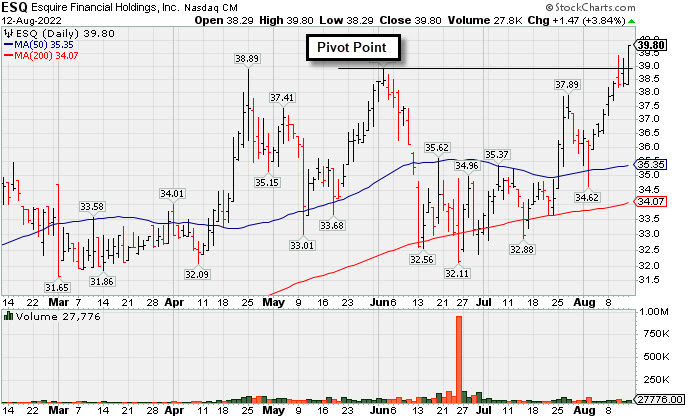
Closed at Session High With Gain for New All-Time High - Friday, August 12, 2022
Esquire Financial Hldgs (ESQ +$1.47 or +3.84% to $39.80) posted a decent gain today with light volume that helped it rise above previously stubborn resistance in the $39 area for an all-time high, and it finished at the session high. Its 50-day moving average DMA line ($35.43) defines important near-term support to watch on pullbacks. Confirming gains above the pivot point backed by at least +40% above average volume may help clinch a proper technical buy signal.
ESQ was highlighted in yellow in the 7/26/22 mid-day report (read here) with pivot point cited based on its 4/25/22 high plus 10 cents. It was last shown in this FSU section with an annotated graph under the headline, "Volume Driven Gains Approaching Prior High". This thinly-traded holding company in the Finance - Commercial Loans industry group has a small supply (S criteria) of only 6.5 million shares in the public float, which can contribute to greater price volatility in the event of institutional buying or selling. It completed its $14 IPO on 6/29/17. The number of top-rated funds owning its shares rose form 64 in Se '21 to 125 in Jun '22, a reassuring sign concerning the I criteria. Its current Up/Down Volume Ratio of 0.6 is an unbiased indication its shares have been under distributional pressure over the past 50 days.
ESQ has a 97 Earnings Per Share Rating. It reported earnings +37% on +23% sales revenues for the Jun '22 quarter versus the year-ago period, the 4th consecutive quarterly comparison with an earnings increase above the +25% minimum guideline. Its annual earnings growth (A criteria) history has been strong.
Chart courtesy of www.stockcharts.com
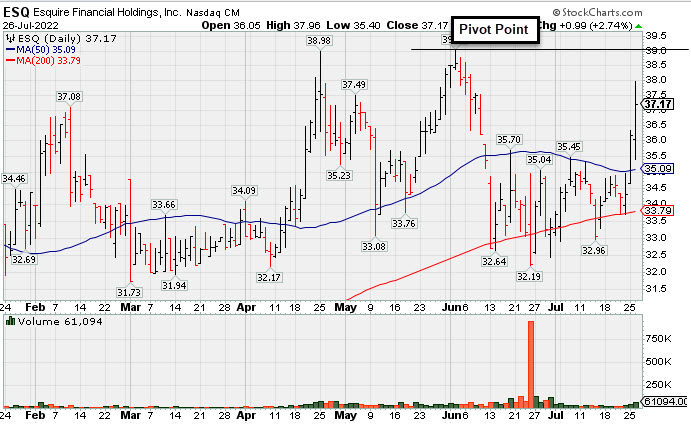
Volume Driven Gains Approaching Prior High - Tuesday, July 26, 2022
Esquire Financial Hldgs (ESQ +$0.99 or +2.74% to $37.17) was highlighted in yellow in the earlier mid-day report (read here) with pivot point cited based on its 4/25/22 high plus 10 cents. This thinly-traded holding company in the Finance - Commercial Loans industry group rebounded toward its all-time high with today's 3rd consecutive gain. Subsequent gains above the pivot point backed by at least +40% above average volume may trigger a technical buy signal. During the recent consolidation it found support near its 200 DMA line.
Its small supply (S criteria) of only 6.5 million shares in the public float can contribute to greater price volatility in the event of institutional buying or selling. Completed its $14 IPO on 6/29/17. The number of top-rated funds owning its shares rose form 64 in Se '21 to 90 in Jun '22, a reassuring sign concerning the I criteria. Its current Up/Down Volume Ratio of 0.7 is an unbiased indication its shares have been under distributional pressure over the past 50 days.
ESQ has a 96 Earnings Per Share Rating. It reported earnings +37% on +23% sales revenues for the Jun '22 quarter versus the year-ago period, the 4th consecutive quarterly comparison with an earnings increase above the +25% minimum guideline. Its annual earnings growth (A criteria) history has been strong.
Chart courtesy of www.stockcharts.com