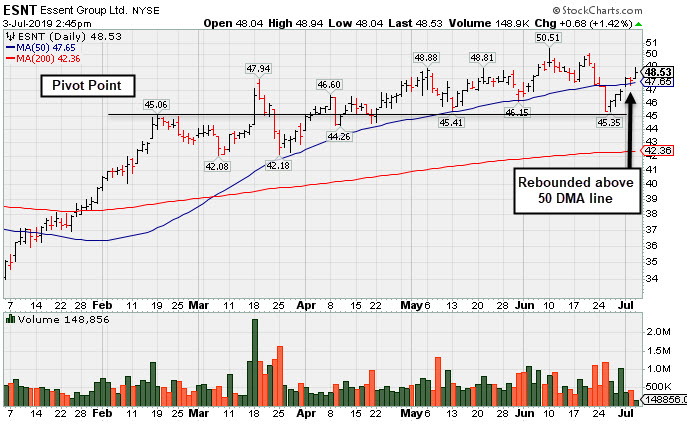
Rebounded Above 50 Day Moving Average After Violation - Wednesday, July 3, 2019
Essent Group Ltd (ESNT +$0.83 or +1.73% to $48.68) rebounded above its 50-day moving average (DMA) line ($47.66) reassuringly after damaging volume-driven losses violated that important short-term average during the recent consolidation. It faces very little resistance due to overhead supply up to the $50 level.
It endured distributional pressure after last shown in this FSU section on 6/05/19 with an annotated graph under the headline, "Still Hovering Not Far From 52-Week High". Fundamental concerns were raised after It reported earnings +15% on +20% sales revenues for the Mar '19 quarter, breaking the prior streak of 4 consecutive comparisons above the +25% minimum earnings guideline (C criteria).
Its annual earnings (A criteria) history has been good since its $17 IPO on 10/31/13. ESNT was highlighted in yellow with new pivot point cited based on its 2/19/19 high in the 3/18/19 mid-day report (read here). The number of top-rated funds owning its shares rose from 317 in Mar '16 to 626 in Mar '19, a reassuring sign concerning the I criteria. Its current Up/Down Volume Ratio of 1.5 is an unbiased indication its shares have been under accumulation over the past 50 days.
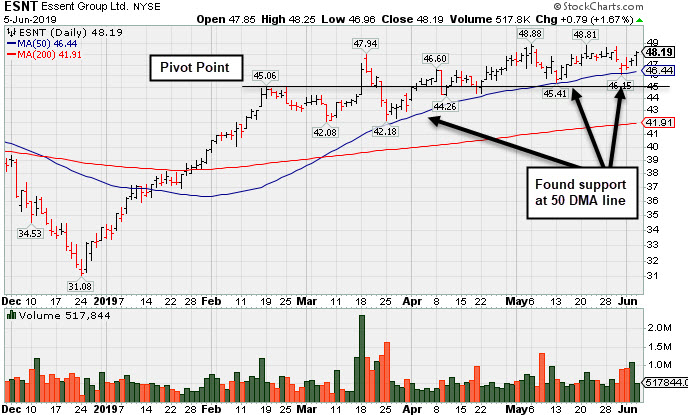
Still Hovering Not Far From 52-Week High - Wednesday, June 5, 2019
Essent Group Ltd (ESNT +$0.79 or +1.67% to $48.19) has found support above its 50-day moving average (DMA) line ($46.44) reassuringly during the recent consolidation. It faces very little resistance due to overhead supply up to the $50 level.
It was last shown in this FSU section on 4/25/19 with an annotated graph under the headline, "Perched Above Pivot Point With Earnings News Due May 3rd". It reported earnings +15% on +20% sales revenues for the Mar '19 quarter, breaking the prior streak of 4 consecutive comparisons above the +25% minimum earnings guideline (C criteria).
Its annual earnings (A criteria) history has been good since its $17 IPO on 10/31/13. ESNT was highlighted in yellow with new pivot point cited based on its 2/19/19 high in the 3/18/19 mid-day report (read here). The number of top-rated funds owning its shares rose from 317 in Mar '16 to 627 in Mar '19, a reassuring sign concerning the I criteria. Its current Up/Down Volume Ratio of 1.7 is an unbiased indication its shares have been under accumulation over the past 50 days.
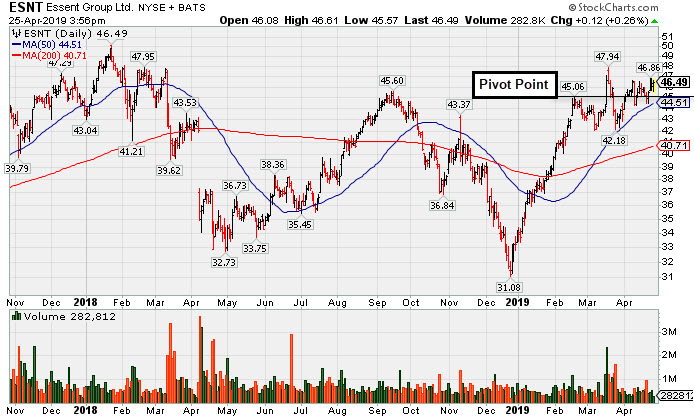
Perched Above Pivot Point With Earnings News Due May 3rd - Thursday, April 25, 2019
Essent Group Ltd (ESNT +$0.07 or +0.15% toi $46.44) has posted 4 consecutive gains with lighter than average volume. It found support above its 50-day moving average (DMA) line ($44.51) reassuringly during the recent consolidation. It still faces some resistance due to overhead supply up to the $50 level.
Fundamentals have been strong. Keep in mind it is due to report earnings news before the open on Friday, May 3rd. Volume and volatility often increase near earnings news. It reported earnings +66% on +20% sales revenues for the Dec '18 quarter, its 4th consecutive comparison above the +25% minimum earnings guideline (C criteria). Its annual earnings (A criteria) history has been good since its $17 IPO on 10/31/13.
ESNT was highlighted in yellow with new pivot point cited based on its 2/19/19 high in the 3/18/19 mid-day report (read here). It was last shown in this FSU section on 3/18/19 with an annotated graph under the headline, "Big Breakout Gain With +350% Above Average Volume"
The number of top-rated funds owning its shares rose from 317 in Mar '16 to 613 in Mar '19, a reassuring sign concerning the I criteria. Its current Up/Down Volume ratio of 1.5 is an unbiased indication its shares have been under accumulation over the past 50 days.
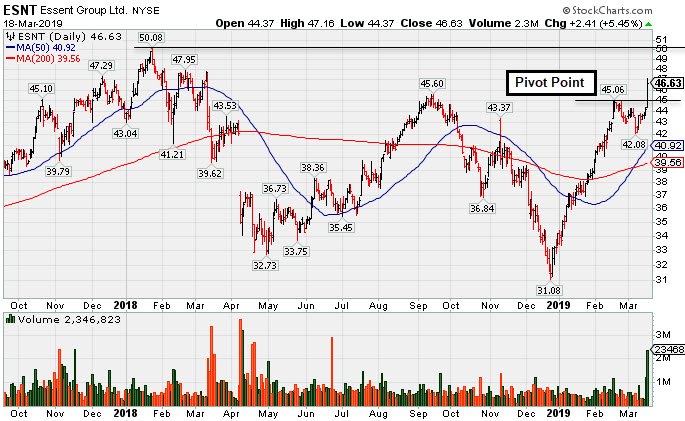
Big Breakout Gain With +350% Above Average Volume - Monday, March 18, 2019
Essent Group Ltd (ESNT +$2.41 or +5.45% to $46.63) was highlighted in yellow with new pivot point cited based on its 2/19/19 high in the earlier mid-day report (read here). Rallying above prior highs with today's big volume-driven gain. Faces some resistance due to overhead supply up to the $50 level.
Fundamentals remain strong. It reported earnings +66% on +20% sales revenues for the Dec '18 quarter, its 4th consecutive comparison above the +25% minimum earnings guideline (C criteria). Its annual earnings (A criteria) history has been good since its $17 IPO on 10/31/13.
It was dropped from the Featured Stocks list on 3/12/18 and went through a choppy consolidation since last shown in this FSU section on 3/02/18 with an annotated graph under the headline, "Sputtering Below 50-Day Moving Average Line".
The number of top-rated funds owning its shares rose from 317 in Mar '16 to 591 in Dec '18, a reassuring sign concerning the I criteria. Its current Up/Down Volume ratio of 1.9 is an unbiased indication its shares have been under accumulation over the past 50 days.
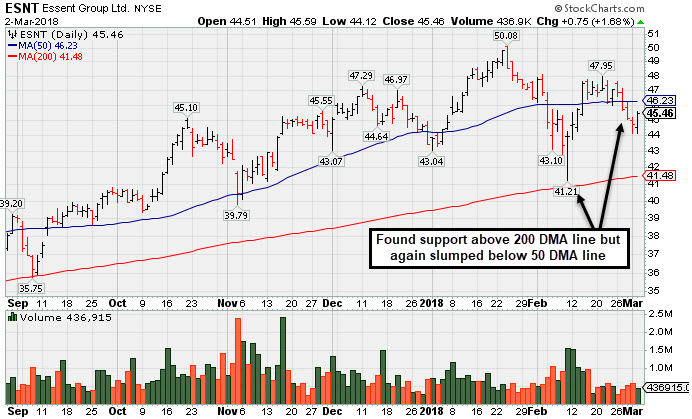
Sputtering ESNBelow 50-Day Moving Average Line - Friday, March 2, 2018
Essent Group Ltd (ESNT +$0.75 or +1.68% to $45.46) is sputtering below its 50-day moving average (DMA) line ($46.24). It tested support near its 200 DMA line recently. More damaging losses would raise greater concerns. Recently reported earnings +16% on +27% sales revenues for the Dec '17 quarter, below the +25% minimum earnings guideline (C criteria), raising fundamental concerns.
Its Relative Strength rating is 79, just below the 80+ minimum guideline for buy candidates. It was last shown in this FSU section on 2/06/18 with an annotated graph under the headline, "Slumped Below 50-Day Average With Earnings News Due Friday".
Fundamentals remain strong. It currently has a Timeliness rating of A and a Sponsorship rating of C. The high-ranked Finance-Mrtg and Rel Svc firm's quarterly earnings have been above the +25% minimum guideline (C criteria) and sales revenues increases in comparisons through Sep '17 have been strong. Its annual earnings (A criteria) history has been good since its $17 IPO on 10/31/13.
Essent has traded up as much as +46.9% since first highlighted in yellow with pivot point cited based on its 12/12/16 high plus 10 cents in the 1/25/17 mid-day report (read here). The number of top-rated funds owning its shares rose from 317 in Mar '16 to 553 in Dec '17, a reassuring sign concerning the I criteria. Its current Up/Down Volume ratio of 1.4 is an unbiased indication its shares have been under accumulation over the past 50 days.
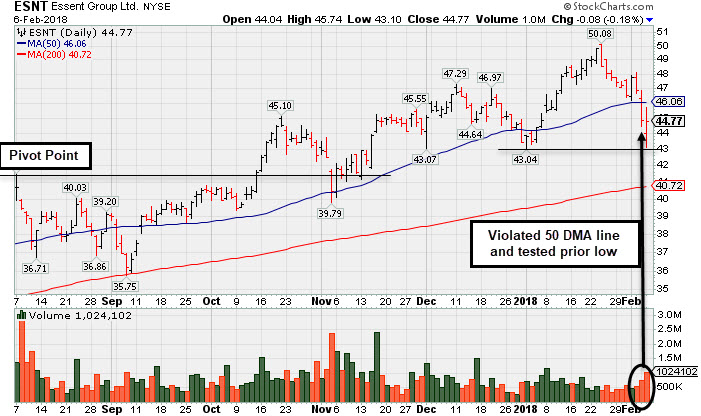
Slumped Below 50-Day Average With Earnings News Due Friday - Tuesday, February 6, 2018
Essent Group Ltd (ESNT -$0.08 or -0.18% to $44.77) rebounded from earlier lows to finish the session little changed. It violated its 50 DMA line ($46.06) with a big loss on the prior session triggering a technical sell signal. Today it tested near the recent low in the $43.00 area defining important support to watch. More damaging losses would raise greater concerns, meanwhile a rebound above the 50 DMA line is needed for its outlook to improve. Keep in mind that it is due to report earnings news before the open on Friday, February 9, 2018. Volume and volatility often increase near earnings news.
Its Relative Strength rating is 83, having improved after a recent slump below the 80+ minimum guideline for buy candidates. It was last shown in this FSU section on 1/09/18 with an annotated graph under the headline, "Perched Near High After Brief Consolidation Below 50 DMA Line".
Fundamentals remain strong. It currently has a Timeliness rating of A and a Sponsorship rating of C. The high-ranked Finance-Mrtg and Rel Svc firm's quarterly earnings have been above the +25% minimum guideline (C criteria) and sales revenues increases in comparisons through Sep '17 have been strong. Its annual earnings (A criteria) history has been good since its $17 IPO on 10/31/13.
Essent has traded up as much as +46.9% since first highlighted in yellow with pivot point cited based on its 12/12/16 high plus 10 cents in the 1/25/17 mid-day report (read here). The number of top-rated funds owning its shares rose from 317 in Mar '16 to 541 in Dec '17, a reassuring sign concerning the I criteria. Its current Up/Down Volume ratio of 1.6 is an unbiased indication its shares have been under accumulation over the past 50 days.
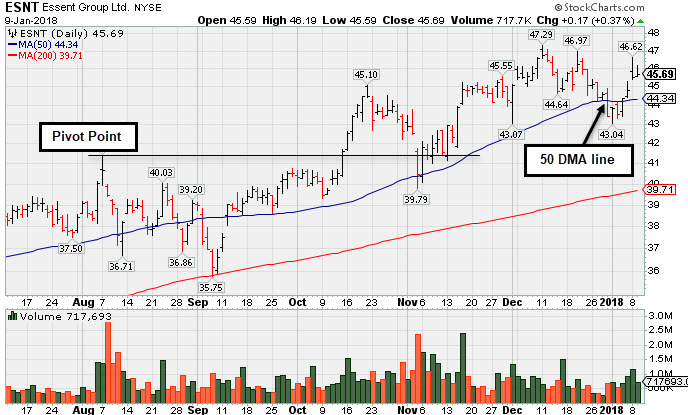
Perched Near High After Brief Consolidation Below 50 DMA Line - Tuesday, January 9, 2018
Essent Group Ltd (ESNT +$0.17 or +0.37% to $45.69) is consolidating above its 50-day moving average (DMA) line ($44.34), and it ended the session perched only -3.4% off its all-time high. Its Relative Strength rating is 83, having improved after a recent slump below the 80+ minimum guideline for buy candidates. Recent lows in the $43.00 area define important support where more damaging losses would raise greater concerns. It was last shown in this FSU section on 12/14/17 with an annotated graph under the headline, "Pulling Back After Recently Wedging Higher".
Fundamentals remain strong. It currently has a Timeliness rating of A and a Sponsorship rating of C. The high-ranked Finance-Mrtg and Rel Svc firm's quarterly earnings have been above the +25% minimum guideline (C criteria) and sales revenues increases in comparisons through Sep '17 have been strong. Its annual earnings (A criteria) history has been good since its $17 IPO on 10/31/13.
Essent has traded up as much as +38.7% since first highlighted in yellow with pivot point cited based on its 12/12/16 high plus 10 cents in the 1/25/17 mid-day report (read here). The number of top-rated funds owning its shares rose from 317 in Mar '16 to 536 in Sep '17, a reassuring sign concerning the I criteria. Its current Up/Down Volume ratio of 1.5 is an unbiased indication its shares have been under accumulation over the past 50 days.
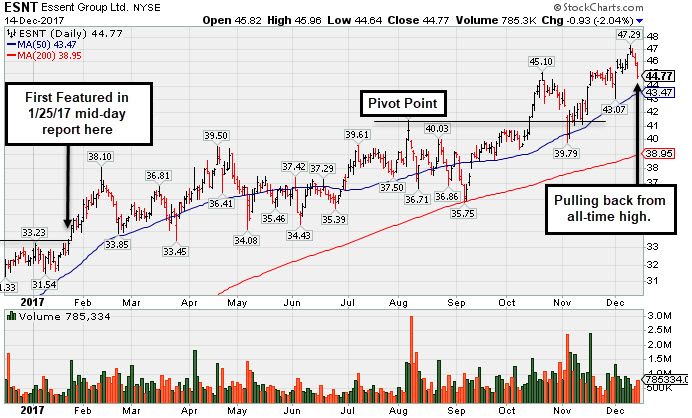
Pulling Back After Recently Wedging Higher - Thursday, December 14, 2017
Essent Group Ltd (ESNT -$0.93 or -2.04% to $44.77) is pulling back from its all-time high after recently wedging higher. It found support at its 50-day moving average (DMA) line ($43.47) during the latest consolidation. It did not form a sound new base of sufficient length for a new pivot point to be cited. The short-term moving average and prior high in the $41 area defines important near-term support to watch on pullbacks.
ESNT completed a new Public Offering on 8/08/17. During a subsequent consolidation it found support near its 200 DMA line, then a prompt rebound above the 50 DMA line helped its outlook improve. It rallied above a new pivot point with additional volume-driven gains in mid-October. It was shown in this FSU section on 11/20/17 with an annotated graph under the headline, "Recent Consolidation Was Not a Sufficient Length New Base".
Fundamentals remain strong. It currently has a Timeliness rating of A and a Sponsorship rating of C. The high-ranked Finance-Mrtg and Rel Svc firm's quarterly earnings have been above the +25% minimum guideline (C criteria) and sales revenues increases in comparisons through Sep '17 have been strong. Its annual earnings (A criteria) history has been good since its $17 IPO on 10/31/13.
Essent has traded up as much as +38.7% since first highlighted in yellow with pivot point cited based on its 12/12/16 high plus 10 cents in the 1/25/17 mid-day report (read here). The number of top-rated funds owning its shares rose from 317 in Mar '16 to 513 in Sep '17, a reassuring sign concerning the I criteria. Its current Up/Down Volume ratio of 1.7 is an unbiased indication its shares have been under accumulation over the past 50 days.
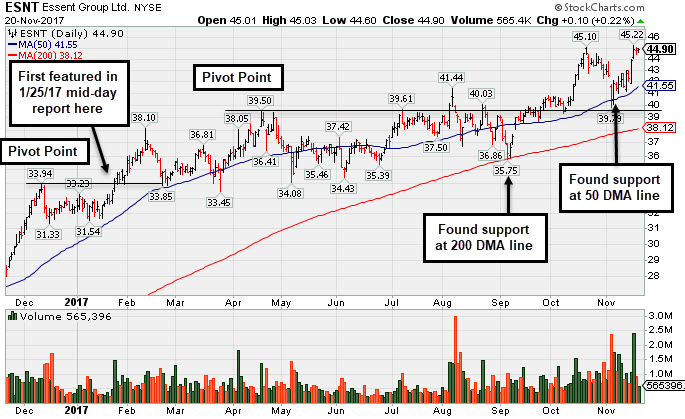
Recent Consolidation Was Not a Sufficient Length New Base - Monday, November 20, 2017
Essent Group Ltd (ESNT +$0.10 or +0.22% to $44.90) found support at its 50-day moving average (DMA) line ($41.55) during the latest consolidation. It did not form a sound new base of sufficient length for a new pivot point to be cited. The short-term moving average and recent low ($39.79 on 11/03/17) define important near-term support to watch on pullbacks.
ESNT completed a new Public Offering on 8/08/17. During a subsequent consolidation it found support near its 200 DMA line, then a prompt rebound above the 50 DMA line helped its outlook improve. It was shown in this FSU section on 10/24/17 with an annotated graph under the headline, "Perched Near High After Streak of Gains".
Fundamentals remain strong. It currently has a Timeliness rating of A and a Sponsorship rating of C. The high-ranked Finance-Mrtg and Rel Svc firm's quarterly earnings have been above the +25% minimum guideline (C criteria) and sales revenues increases in comparisons through Sep '17 have been strong. Its annual earnings (A criteria) history has been good since its $17 IPO on 10/31/13.
Essent is up +31.7% since first highlighted in yellow with pivot point cited based on its 12/12/16 high plus 10 cents in the 1/25/17 mid-day report (read here). The number of top-rated funds owning its shares rose from 317 in Mar '16 to 492 in Sep '17, a reassuring sign concerning the I criteria. Its current Up/Down Volume ratio of 1.8 is an unbiased indication its shares have been under accumulation over the past 50 days.
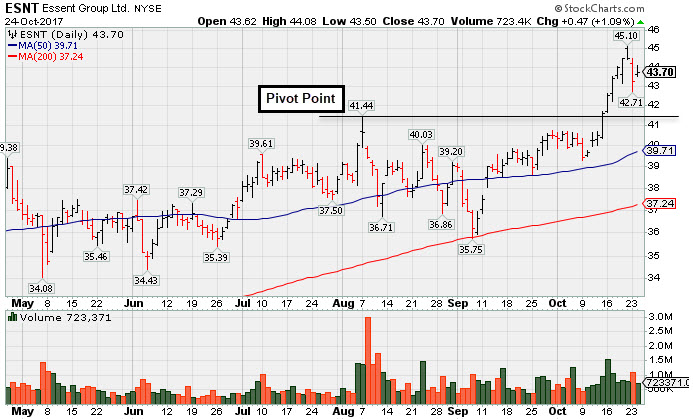
Perched Near High After Streak of Gains - Tuesday, October 24, 2017
Essent Group Ltd (ESNT +$0.47 or +1.09% to $43.70) is perched near its all-time high following an impressive streak of gains. Prior highs in the $41 area define near term support to watch above its 50-day moving average (DMA) line ($39.71).
It currently has a Timeliness rating of A and a Sponsorship rating of B. ESNT completed a new Public Offering on 8/08/17. During a subsequent consolidation it found support near prior lows ($36.71 on 8/11/17) and near its 200 DMA line, then a prompt rebound above the 50 DMA line helped its outlook improve. It was shown in this FSU section on 9/05/17 with an annotated graph under the headline, "Undercut 50-Day Moving Average in Slump Toward Prior Lows".
The high-ranked Finance-Mrtg and Rel Svc firm's quarterly earnings have been above the +25% minimum guideline (C criteria) and sales revenues increases in comparisons through Jun '17 have been strong. Its annual earnings (A criteria) history has been good since its $17 IPO on 10/31/13.
It completed a new Public Offering on 11/19/14. It was first highlighted in yellow with pivot point cited based on its 12/12/16 high plus 10 cents in the 1/25/17 mid-day report (read here). The number of top-rated funds owning its shares rose from 317 in Mar '16 to 469 in Sep '17, a reassuring sign concerning the I criteria.
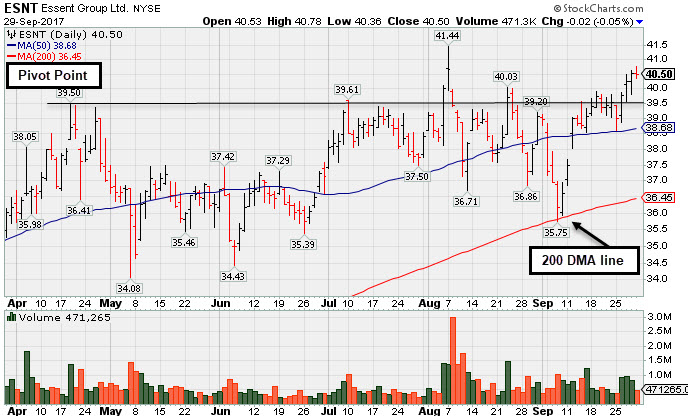
Perched Within Close Striking Distance of Prior High - Friday, September 29, 2017
Essent Group Ltd (ESNT -$0.02 or -0.05% to $40.50) is consolidating above its 50-day moving average (DMA) line ($38.57), and very little resistance remains due to overhead supply. It currently has a Timeliness rating of A and a Sponsorship rating of C
ESNT completed a new Public Offering on 8/08/17. During a subsequent consolidation it found support near prior lows ($36.71 on 8/11/17) and near its 200 DMA line, then a prompt rebound above the 50 DMA line helped its outlook improve. It was last shown in this FSU section on 9/05/17 with an annotated graph under the headline, "Undercut 50-Day Moving Average in Slump Toward Prior Lows".
The high-ranked Finance-Mrtg and Rel Svc firm's quarterly earnings have been above the +25% minimum guideline (C criteria) and sales revenues increases in comparisons through Jun '17 have been strong. Its annual earnings (A criteria) history has been good since its $17 IPO on 10/31/13.
It completed a new Public Offering on 11/19/14. It was first highlighted in yellow with pivot point cited based on its 12/12/16 high plus 10 cents in the 1/25/17 mid-day report (read here). The number of top-rated funds owning its shares rose from 317 in Mar '16 to 454 in Jun '17, a reassuring sign concerning the I criteria.
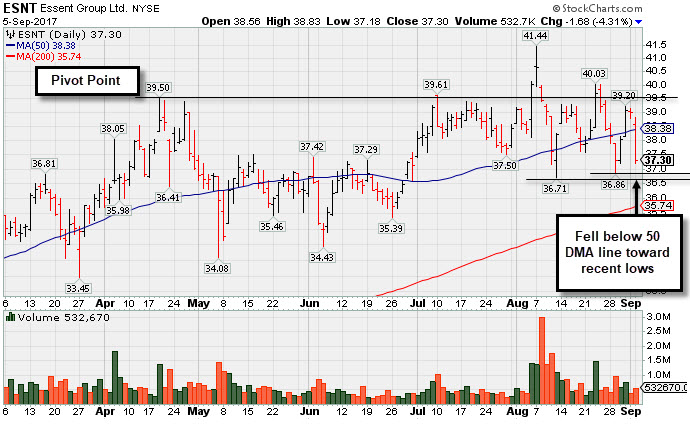
Undercut 50-Day Moving Average in Slump Toward Prior Lows - Tuesday, September 5, 2017
Essent Group Ltd (ESNT -$1.68 or -4.31% to$37.30) fell back below its 50-day moving average DMA line ($38.38) again today hurting its outlook and its color code is changed to green. Prior lows ($36.71 on 8/11/17) and its 200 DMA line define the next important near-term support in the $35-36 area. A prompt rebound above the 50 DMA line is needed for its outlook to improve.
It completed a new Public Offering on 8/08/17. ESNT has been sputtering since last shown in this FSU section on 8/01/17 with an annotated graph under the headline, " Perched Within Close Striking Distance of a New High". The high-ranked Finance-Mrtg and Rel Svc firm's quarterly earnings have been above the +25% minimum guideline (C criteria) and sales revenues increases in comparisons through Jun '17 have been strong. Its annual earnings (A criteria) history has been good since its $17 IPO on 10/31/13.
It completed a new Public Offering on 11/19/14. It was first highlighted in yellow with pivot point cited based on its 12/12/16 high plus 10 cents in the 1/25/17 mid-day report (read here). The number of top-rated funds owning its shares rose from 317 in Mar '16 to 453 in Jun '17, a reassuring sign concerning the I criteria. However, its current Up/Down Volume Ratio of 0.9 is an unbiased indication its shares have been under slight distributional pressure over the past 50 days.
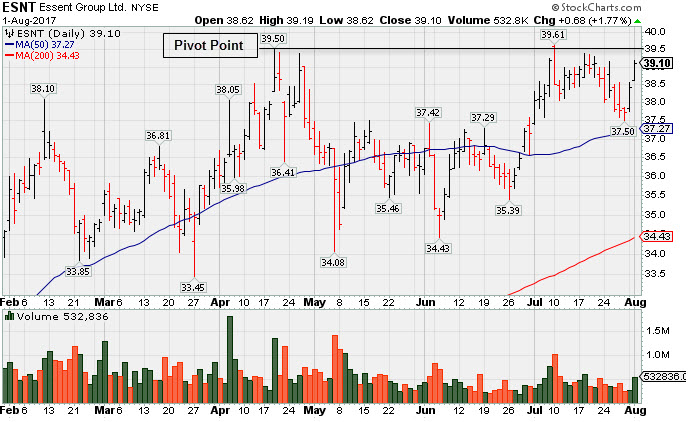
Perched Within Close Striking Distance of a New High - Tuesday, August 1, 2017
Essent Group Ltd (ESNT +$0.68 or +1.77% to $39.10) is consolidating within close striking distance of its all-time high. Subsequent gains above the pivot point backed by at least +40% above average volume may trigger a new (or add-on) technical buy signal. Losses below the 50 DMA line ($37.27) and prior low ($34.08 on 5/05/17) would raise concerns and trigger technical sell signals. ESNT is due to report earnings for the Jun '17 quarter on 8/04//17. Volume and volatility often increase near earnings news.
Since last shown in this FSU section on 6/20/17 with an annotated graph under the headline, "Sputtering Below its 50-Day Moving Average", it rebounded above the 50 DMA line helping its outlook improve. The high-ranked Finance-Mrtg and Rel Svc firm's quarterly earnings have been above the +25% minimum guideline (C criteria) and sales revenues increases in comparisons through Mar '17 have been strong. Its annual earnings (A criteria) history has been good since its $17 IPO on 10/31/13.
It completed a new Public Offering on 11/19/14. It was first highlighted in yellow with pivot point cited based on its 12/12/16 high plus 10 cents in the 1/25/17 mid-day report (read here). The number of top-rated funds owning its shares rose from 317 in Mar '16 to 443 in Jun '17, a reassuring sign concerning the I criteria. However, its current Up/Down Volume Ratio of 0.9 is an unbiased indication its shares have been under slight distributional pressure over the past 50 days.
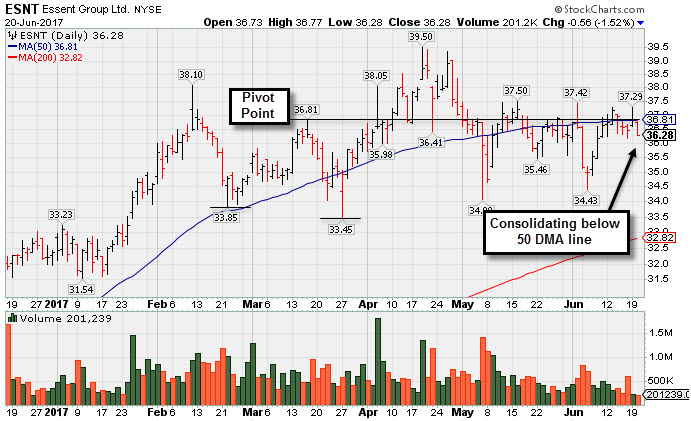
Sputtering Below its 50-Day Moving Average - Tuesday, June 20, 2017
Essent Group Ltd (ESNT -$0.56 or -1.52% to $36.28) is consolidating just below its 50-day moving average (DMA) line ($36.81). Subsequent losses below the prior low ($34.08 on 5/05/17) would raise greater concerns and trigger a worrisome technical sell signal.
ESNT was last shown in this FSU section on 5/11/17 with an annotated graph under the headline, "Rebound Above 50-Day Moving Average Helped Outlook". The high-ranked Finance-Mrtg and Rel Svc firm's quarterly earnings have been above the +25% minimum guideline (C criteria) and sales revenues increases in comparisons through Mar '17 have been strong. Its annual earnings (A criteria) history has been good since its $17 IPO on 10/31/13. It completed a new Public Offering on 11/19/14. It was first highlighted in yellow with pivot point cited based on its 12/12/16 high plus 10 cents in the 1/25/17 mid-day report (read here).
The number of top-rated funds owning its shares rose from 317 in Mar '16 to 432 in Mar '17, a reassuring sign concerning the I criteria. However, its current Up/Down Volume Ratio of 0.8 is an unbiased indication its shares have been under slight distributional pressure over the past 50 days.
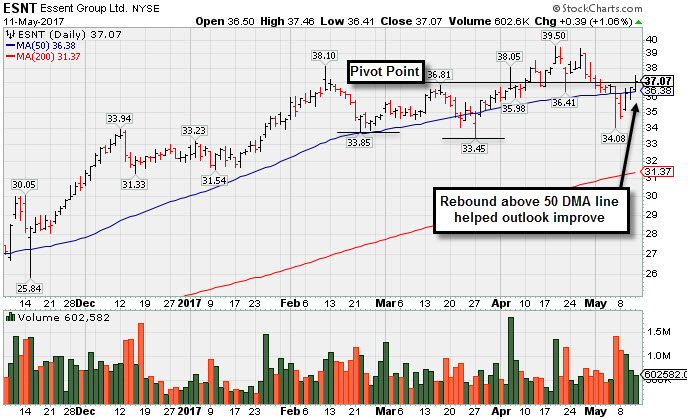
Rebound Above 50-Day Moving Average Helped Outlook - Thursday, May 11, 2017
Essent Group Ltd (ESNT +$0.39 or +1.06% to $37.07) posted a small gain with below average volume today. It found prompt support after recent volume-driven losses violated its 50-day moving average (DMA) line triggering a technical sell signal. The gains and close above the 50 DMA line ($36.38) helped its outlook improve, and its color code has been changed to yellow.
ESNT was first highlighted in yellow with pivot point cited based on its 12/12/16 high plus 10 cents in the 1/25/17 mid-day report (read here). It was last shown in this FSU section on 4/10/17 with an annotated graph under the headline, "Quiet Volume Behind Gain for New High Close".
The high-ranked Finance-Mrtg and Rel Svc firm's quarterly earnings have been above the +25% minimum guideline (C criteria) and sales revenues increases in comparisons through Mar '17 have been strong. Its annual earnings (A criteria) history has been good since its $17 IPO on 10/31/13. It completed a new Public Offering on 11/19/14.
The number of top-rated funds owning its shares rose from 317 in Mar '16 to 421 in Mar '17, a reassuring sign concerning the I criteria. Its current Up/Down Volume Ratio of 1.1 is an unbiased indication its shares have been under slight accumulation over the past 50 days.
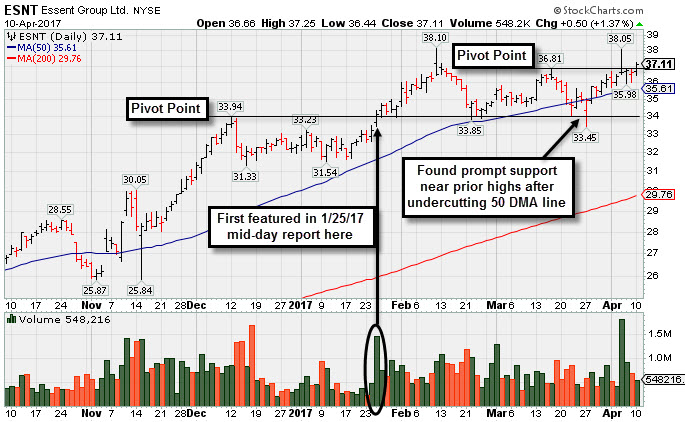
Quiet Volume Behind Gain for New High Close - Monday, April 10, 2017
Essent Group Ltd (ESNT +$0.50 or +1.37% to $37.11) posted a small gain with below average volume today for a new high close (N criteria). It challenged its 52-week high with a gap up and big volume-driven gain last week triggering a new (or add-on) technical buy signal. It rallied above the new pivot point cited based on its 3/16/17 high, clearing the "double bottom" base formed over the past 8 weeks. But on that session it finished near the session low, a sign it might be encountering distributional pressure. With action like that, confirming gains with higher volume would be an ideal reassurance that its shares are still under serious accumulation by institutional investors (I criteria).
ESNT finished strong after first highlighted in yellow with pivot point cited based on its 12/12/16 high plus 10 cents in the 1/25/17 mid-day report (read here). It found prompt support near prior highs after undercutting its 50-day moving average (DMA) line during its consolidation since last shown in this FSU section on 3/10/17 with an annotated graph under the headline, "Consolidating Above Support Following Breakout".
The high-ranked Finance-Mrtg and Rel Svc firm's quarterly earnings have been above the +25% minimum guideline (C criteria) and sales revenues increases in comparisons through Dec'16 have been strong. Its annual earnings (A criteria) history has been good since its $17 IPO on 10/31/13. It completed a new Public Offering on 11/19/14.
The number of top-ranted funds owning its shares rose from 317 in Mar '16 to 407 in Mar '17, a reassuring sign concerning the I criteria. Its current Up/Down Volume Ratio of 1.3 is an unbiased indication its shares have been under slight accumulation over the past 50 days.
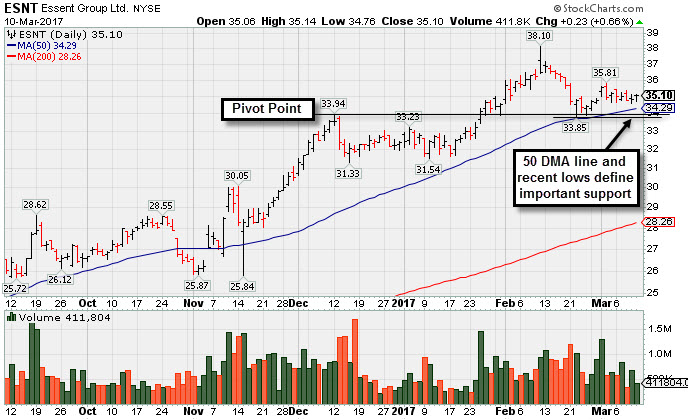
Consolidating Above Support Following Breakout - Friday, March 10, 2017
Essent Group Ltd (ESNT +$0.23 or +0.66% to $35.10) is consolidating below its "max buy" level, staying above its 50-day moving average (DMA) line and above prior highs defining important near-term support in the $33-34 area. Subsequent losses leading to violations may trigger technical sell signals.
ESNT finished strong after highlighted in yellow with new pivot point cited based on its 12/12/16 high plus 10 cents in the 1/25/17 mid-day report (read here). It hit a new all-time high (N criteria) with a big gain backed by twice its average volume, well above the minimum of +40% above average volume needed to trigger a proper technical buy signal. Disciplined investors avoid chasing stocks more than +5% above prior highs and always limit losses by selling any stock that falls more than -7% from their purchase price.
The high-ranked Finance-Mrtg and Rel Svc firm's quarterly earnings have been above the +25% minimum guideline (C criteria) and sales revenues increases in comparisons through Dec'16 have been strong. Its annual earnings (A criteria) history has been good since its $17 IPO on 10/31/13. It completed a new Public Offering on 11/19/14.
The number of top-ranted funds owning its shares rose from 317 in Mar '16 to 390 in Dec '16, a reassuring sign concerning the I criteria. Its current Up/Down Volume Ratio of 1.6 is an unbiased indication its shares have been under slight accumulation over the past 50 days.
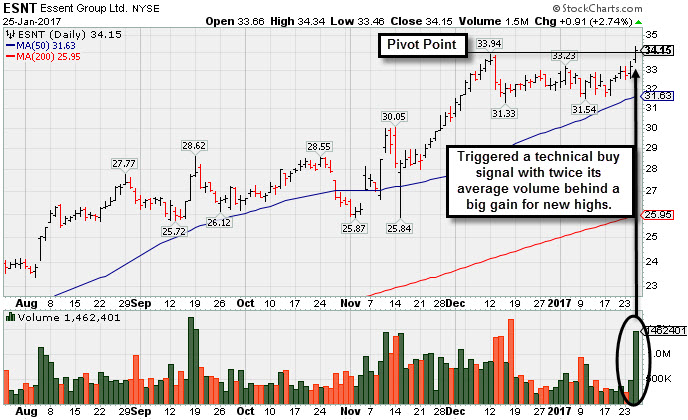
Twice Average Volume Behind Big Breakout Gain - Wednesday, January 25, 2017
Essent Group Ltd (ESNT +$0.91 or +2.74% to $34.15) finished strong after highlighted in yellow with new pivot point cited based on its 12/12/16 high plus 10 cents in the earlier mid-day report (read here). It hit a new all-time high (N criteria) with today's big gain backed by twice its average volume, well above the minimum of +40% above average volume needed to trigger a proper technical buy signal. It recently found support above its 50-day moving average (DMA) line during its orderly consolidation. Disciplined investors avoid chasing stocks more than +5% above prior highs and always limit losses by selling any stock that falls more than -7% from their purchase price.
The high-ranked Finance-Mrtg and Rel Svc firm's quarterly earnings have been above the +25% minimum guideline (C criteria) and sales revenues increases in comparisons through Sep '16 have been strong. Its annual earnings (A criteria) history has been good since its $17 IPO on 10/31/13. It completed a new Public Offering on 11/19/14.
The number of top-ranted funds owning its shares rose from 317 in Mar '16 to 366 in Dec '16, a reassuring sign concerning the I criteria. Its current Up/Down Volume Ratio of 1.3 is an unbiased indication its shares have been under slight accumulation over the past 50 days.
Charts courtesy www.stockcharts.com