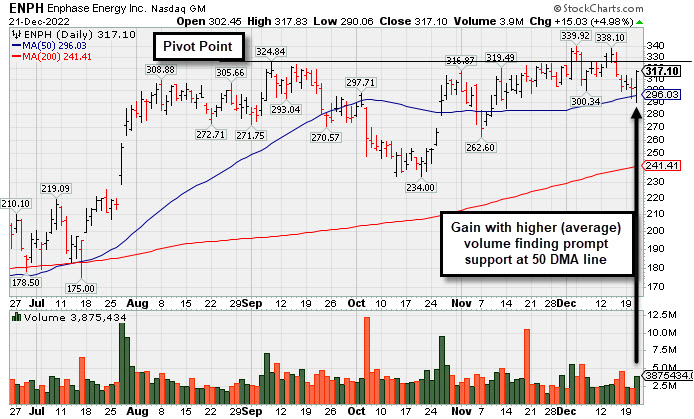
Found Support With a Solid Gain at 50-Day Moving Average Line - Wednesday, December 21, 2022
Enphase Energy Inc (ENPH +$15.03 or +4.98% to $317.10) posted a solid gain today with higher (average) volume today, managing a "positive reversal" from the session low ($290.06) while finding prompt support near its 50-day moving average (DMA) line ($296.03). The recent slump back below its pivot point raised some concerns. It stalled after hitting a new all-time high on 12/02/22 with a volume-driven gain above its pivot point. Subsequent volume-driven gains for new highs would be a reassuring sign of fresh institutional buying demand. More damaging losses below the 50 DMA line and today's low would trigger a worrisome technical sell signal.
Fundamentals remain strong. Enphase was last shown with an annotated graph on 10/21/22 under the headline, "Perched Near High Still Awaiting Technical Breakout". It has an Earnings Per Share Rating of 99. It reported Sep '22 quarterly earnings +108% on +81% sales revenues versus the year ago period, continuing its strong earnings history above the +25% minimum guideline (C criteria). It has a strong annual earnings (A criteria) history since FY '18 after years of losses.
The company hails from the Energy-Solar group which is currently ranked 7th on the 197 Industry Groups (L criteria). The number of top-rated funds owning its shares rose from 1,068 in Dec '20 to 2,181 in Sep '22, a reassuring sign concerning the I criteria. Its current Up/Down Volume Ratio of 1.2 is an unbiased indication its shares have been under slight accumulation over the past 50 days.
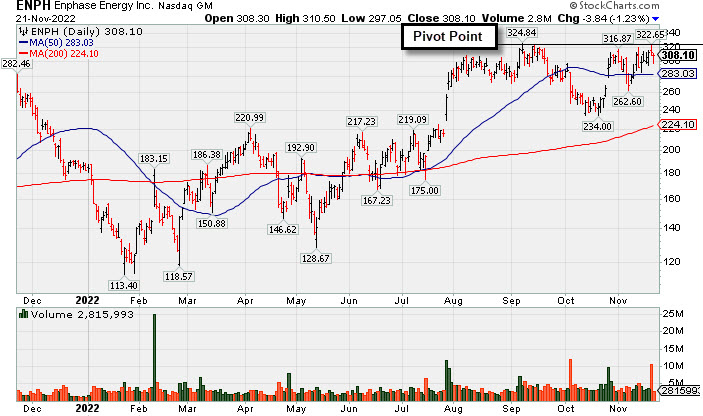
Perched Near High Still Awaiting Technical Breakout - Monday, November 21, 2022
Enphase Energy Inc (ENPH -$3.84 or -1.23% to $308.10) recently has been challenging its 52-week high, still perched within striking distance of its pivot point. It faces no resistance due to overhead supply up to the $324 level. Disciplined investors might still be watching for a convincing technical breakout to confirm the presence of fresh institutional buying demand. Its 50-day moving average (DMA) line ($283) defines near-term support above the recent low ($262.60 on 11/07/22).
Fundamentals remain strong. It was last shown with an annotated graph on 10/28/22 under the headline, "Enphase Energy Rebound Above 50-Day Moving Average Helped Outlook". It has an Earnings Per Share Rating of 99. It reported Sep '22 quarterly earnings +108% on +81% sales revenues versus the year ago period, continuing its strong earnings history above the +25% minimum guideline (C criteria). It has a strong annual earnings (A criteria) history since FY '18 after years of losses.
The company hails from the Energy-Solar group which is currently ranked 2nd of the 197 Industry Groups (L criteria). The number of top-rated funds owning its shares rose from 1,068 in Dec '20 to 2,116 in Sep '22, a reassuring sign concerning the I criteria. Its current Up/Down Volume Ratio of 0.9 is an unbiased indication its shares have been under slight distributional pressure over the past 50 days.
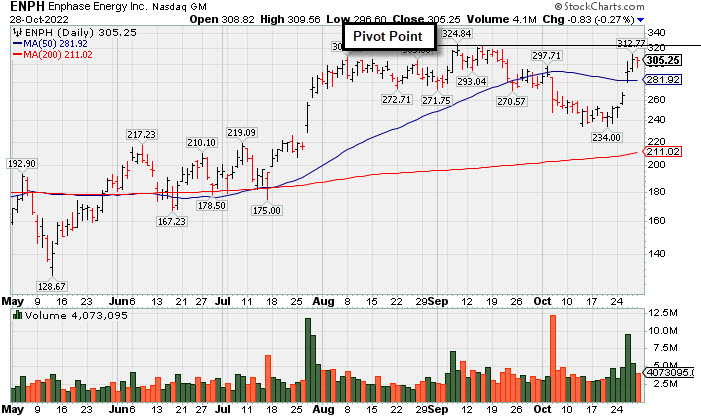
Enphase Energy Rebound Above 50-Day Moving Average Helped Outlook - Friday, October 28, 2022
Enphase Energy Inc (ENPH -$0.83 or -0.27% to $305.25) paused today after 6 consecutive volume-driven gains. It was highlighted in yellow in the 10/26/22 mid-day report with new pivot point cited based on its 9/08/22 high plus 10 cents (read here). This week's rebound above its 50-day moving average (DMA) line ($281.92) helped its outlook improve. It faces little resistance due to overhead supply up to the $324 level.
It has shown resilience since dropped from the Featured Stocks list on 10/05/22.It was last shown with an annotated graph on 9/27/22 under the headline, "Found Support After Undercutting 50 DMA and Prior Low". It has an Earnings Per Share Rating of 99. It reported Sep '22 quarterly earnings +108% on +81% sales revenues versus the year ago period, continuing its strong earnings history above the +25% minimum guideline (C criteria). It has a strong annual earnings (A criteria) history since FY '18 after years of losses.
The company hails from the Energy-Solar group which is currently ranked 2nd of the 197 Industry Groups (L criteria). The number of top-rated funds owning its shares rose from 1,068 in Dec '20 to 2,017 in Sep '22, a reassuring sign concerning the I criteria. Its current Up/Down Volume Ratio of 1.1 is an unbiased indication its shares have been under slight accumulation over the past 50 days.
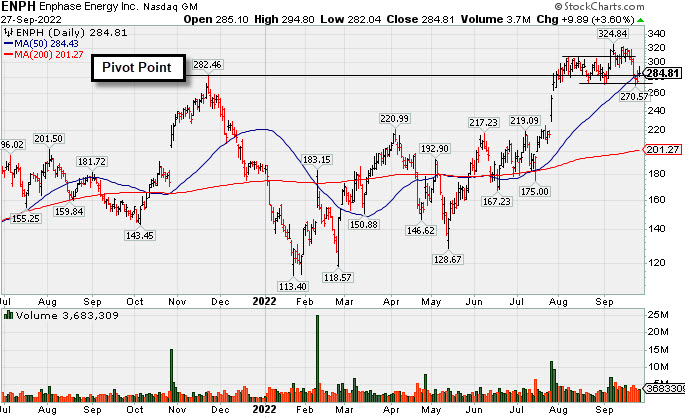
Found Support After Undercutting 50 DMA and Prior Low -
Enphase Energy Inc (ENPH +$9.89 or +3.60% to $284.81) posted a gain as it found support near its 50-day moving average (DMA) line ($284.43) after briefly undercutting prior lows in the $271-272 area. More damaging losses would raise greater concerns. Fundamentals remain strong. Members have been repeatedly reminded, "The market is in a correction (M criteria) and disciplined investors know to avoid new buying efforts until a new rally confirmed with a follow-through day."
ENPH was highlighted in yellow in the 7/28/22 mid-day report (read here). It was last shown with an annotated graph on 9/13/22 under the headline, "High-Ranked Solar Energy Firm Hovering Near All-Time High". It has an Earnings Per Share Rating of 98. The company has reported very strong sales revenues and earnings increases in quarterly comparisons through Jun '22 versus the year ago periods, above the +25% minimum guideline (C criteria). It has a strong annual earnings (A criteria) history since FY '18 after years of losses.
The company hails from the Energy-Solar group which is currently ranked 1st of the 197 Industry Groups (L criteria). The number of top-rated funds owning its shares rose from 1,068 in Dec '20 to 1,863 in Jun '22, a reassuring sign concerning the I criteria. Its current Up/Down Volume Ratio of 1.4 is an unbiased indication its shares have been under accumulation over the past 50 days.
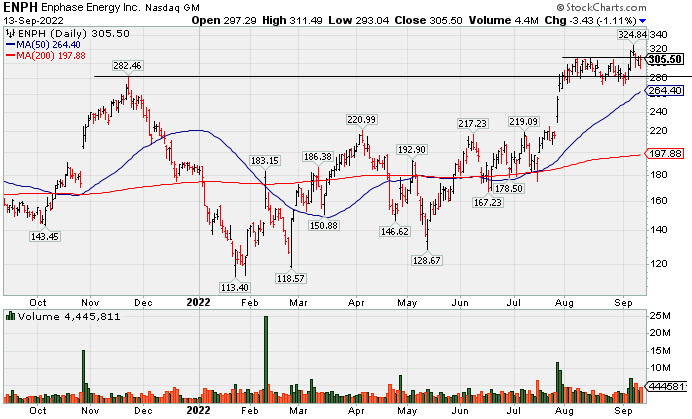
High-Ranked Solar Energy Firm Hovering Near All-Time High - Tuesday, September 13, 2022
Enphase Energy Inc (ENPH -$3.43 or -1.11% to $305.50) is hovering near its all-time high after a volume-driven breakout gain on 9/07/22 following a brief consolidation. Recent lows in the $272-272 area define initial support above its 50-day moving average (DMA) line ($264). Fundamentals remain strong.
ENPH was highlighted in yellow in the 7/28/22 mid-day report (read here). There were 3 consecutive volume-driven gains last week as it rallied and closed above the pivot point cited based on its 11/22/21 high plus 10 cents triggering a technical buy signal. It was last shown with an annotated graph on 8/19/22 under the headline, "Enphase Energy Consolidating After Rallying to New Highs". It has an Earnings Per Share Rating of 98. The company has reported very strong sales revenues and earnings increases in quarterly comparisons through Jun '22 versus the year ago periods, above the +25% minimum guideline (C criteria). It has a strong annual earnings (A criteria) history since FY '18 after years of losses.
The company hails from the Energy-Solar group which is currently ranked 1st of the 197 Industry Groups (L criteria). The number of top-rated funds owning its shares rose from 1,068 in Dec '20 to 1,858 in Jun '22, a reassuring sign concerning the I criteria. Its current Up/Down Volume Ratio of 1.8 is an unbiased indication its shares have been under accumulation over the past 50 days.
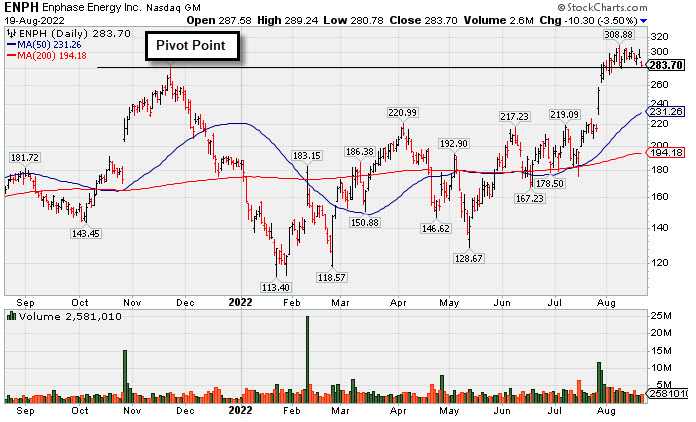
Enphase Energy Consolidating After Rallying to New Highs - Friday, August 19, 2022
Enphase Energy Inc (ENPH -$10.30 or -3.50% to $283.70) gapped down today after hovering near its all-time high with volume totals cooling in recent weeks. Its color code was changed to yellow after pulling back below its "max buy" level. The prior high in the $282 area has been noted as initial support to watch on pullbacks.
ENPH was highlighted in yellow in the 7/28/22 mid-day report (read here). There were 3 consecutive volume-driven gains last week as it rallied and closed above the pivot point cited based on its 11/22/21 high plus 10 cents triggering a technical buy signal. It was last shown with an annotated graph on 8/01/22 under the headline, "Pullback Following 3 Consecutive Gains With Heavier Volume". It has an Earnings Per Share Rating of 98. The company has reported very strong sales revenues and earnings increases in quarterly comparisons through Jun '22 versus the year ago periods, above the +25% minimum guideline (C criteria). It has a strong annual earnings (A criteria) history since FY '18 after years of losses.
The company hails from the Energy-Solar group which is currently ranked 1st of the 197 Industry Groups (L criteria). The number of top-rated funds owning its shares rose from 1,068 in Dec '20 to 1,811 in Jun '22, a reassuring sign concerning the I criteria. Its current Up/Down Volume Ratio of 1.7 is an unbiased indication its shares have been under accumulation over the past 50 days.
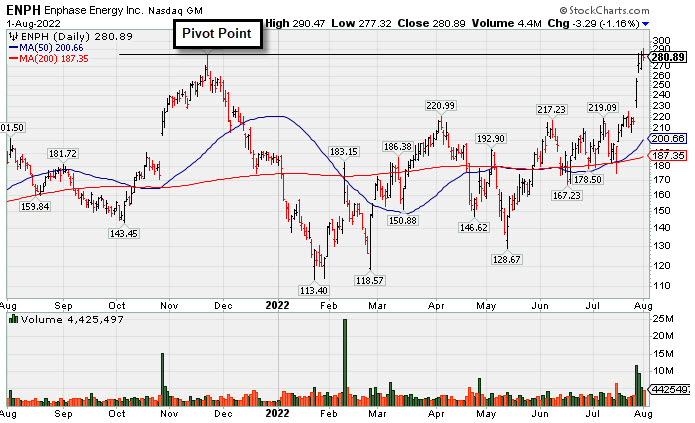
Pullback Following 3 Consecutive Gains With Heavier Volume - Monday, August 1, 2022
Enphase Energy Inc (ENPH -$3.29 or -1.16% to $280.89) reversed into the red and closed back below the pivot point after hitting another new high today. The pullback below the pivot point raised some concerns. It faces no resistance due to overhead supply. It was highlighted in yellow in the 7/28/22 mid-day report (read here). There were 3 consecutive volume-driven gains last week as it rallied and closed above the pivot point cited based on its 11/22/21 high plus 10 cents triggering a technical buy signal.
Fundamentals remain strong. ENPH went through a deep and choppy consolidation since last shown with an annotated graph on 12/02/21 under the headline, "Pullback Testing Near Prior High". It has an Earnings Per Share Rating of 98. The company has reported very strong sales revenues and earnings increases in quarterly comparisons through Jun '22 versus the year ago periods, above the +25% minimum guideline (C criteria). It has a strong annual earnings (A criteria) history since FY '18 after years of losses.
The company hails from the Energy-Solar group which is currently ranked 2nd of the 197 Industry Groups (L criteria). The number of top-rated funds owning its shares rose from 1,068 in Dec '20 to 1,764 in Jun '22, a reassuring sign concerning the I criteria. Its current Up/Down Volume Ratio of 1.9 is an unbiased indication its shares have been under accumulation over the past 50 days.
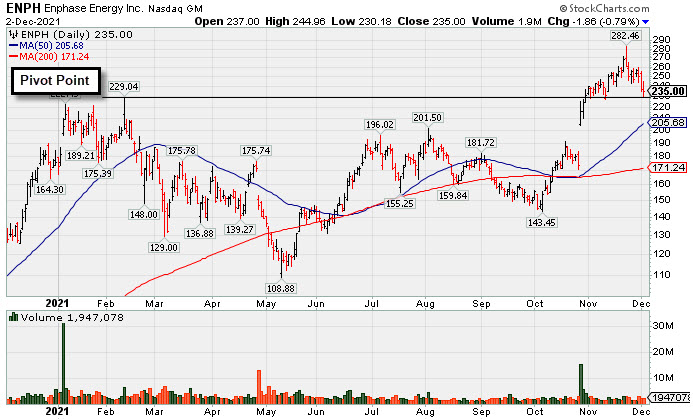
Pullback Testing Near Prior High - Thursday, December 2, 2021
Enphase Energy Inc (ENPH -$1.86 or -0.79% to $235.00) has been consolidating back below its "max buy" level. The prior high ($229) defines initial support to watch above its 50-day moving average (DMA) line ($205.68).
ENPH was highlighted in yellow in the 10/28/21 mid-day report (read here) with pivot point cited based on its 2/10/21 high plus 10 cents. and last shown with an annotated graph that evening under the headline, "Enphase is Challenging its All-Time High With Volume-Driven Gains". Subsequent gains above the pivot point backed by at least +40% above average volume triggered a technical buy signal.
ENPH has an Earnings Per Share Rating of 99. It reported very strong sales revenues and earnings increases in quarterly comparisons through Sep '21 versus the year ago periods, above the +25% minimum guideline (C criteria). It has a strong annual earnings (A criteria) history since FY '18 after years of losses.
The company hails from the Energy-Solar group which is currently ranked 7th of the 197 Industry Groups (L criteria). The number of top-rated funds owning its shares rose from 1,068 in Dec '20 to 1,508 in Sep '21, a reassuring sign concerning the I criteria.
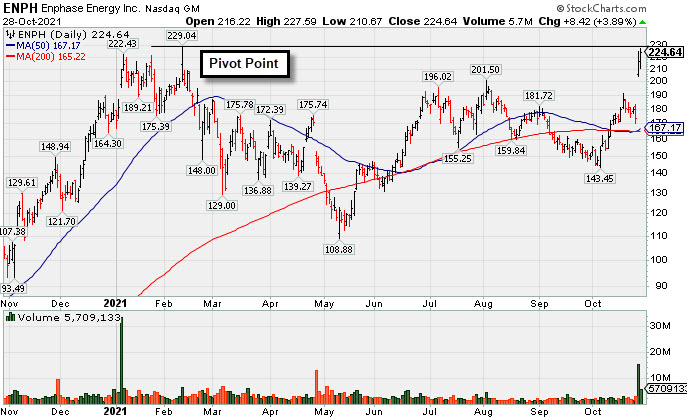
Enphase is Challenging its All-Time High With Volume-Driven Gains - Thursday, October 28, 2021
Enphase Energy Inc (ENPH +$8.42 or +3.89% to $224.64) was highlighted in yellow in the earlier mid-day report (read here) with pivot point cited based on its 2/10/21 high plus 10 cents. It challenged its 52-week high with today's 2nd consecutive volume-driven gain after a considerable gap up. Subsequent gains above the pivot point backed by at least +40% above average volume may trigger a technical buy signal.
ENPH has an Earnings Per Share Rating of 98. It reported very strong sales revenues and earnings increases in quarterly comparisons through Sep '21 versus the year ago periods, above the +25% minimum guideline (C criteria). It has a strong annual earnings (A criteria) history since FY '18 after years of losses.
The company hails from the Energy-Solar group which is currently ranked 23rd of the 197 Industry Groups (L criteria). The number of top-rated funds owning its shares rose from 1,068 in Dec '20 to 1,507 in Sep '21, a reassuring sign concerning the I criteria.