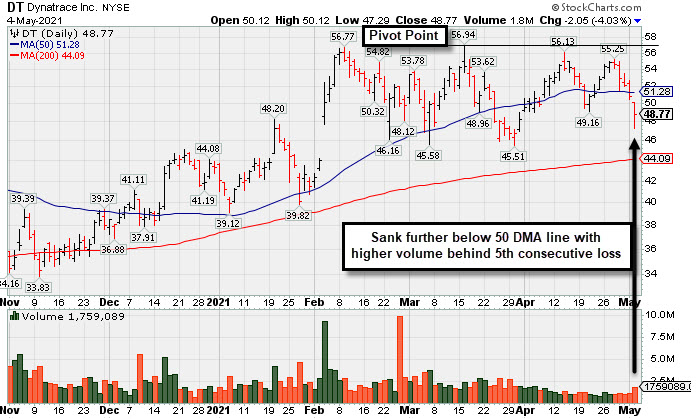
Relative Strength Fades With 5th Consecutive Loss - Tuesday, May 4, 2021
Dynatrace Inc (DT -$2.05 or -4.03% to $48.77) had higher (near average) volume behind today's 5th consecutive loss as it sank further below its 50-day moving average (DMA) line ($51.28) with damaging losses raising concerns. It will be dropped from the Featured Stocks list tonight. A rebound above the 50 DMA line is needed for its outlook to improve. Subsequent gains above the pivot point backed by at least +40% above average volume are needed to trigger a new (or add-on) technical buy signal. Recent lows in the $45 area define important near-term support to watch on pullbacks. Its Relative Strength Rating has slumped to 63, well below the 80+ minimum guideline for buy candidates.
Keep in mind it is due to report Mar '21 quarterly results on 5/12/21. Volume and volatility often increase near earnings news. Fundamentals have been strong. Dec '20 quarterly earnings rose +70% on +28% sales revenues versus the year ago period. It has a 97 Earnings Per Share Rating. DT was highlighted in yellow with pivot point cited based on its 9/02/20 high in the 2/04/21 mid-day report (read here). The high-ranked Computer Sftwr-Enterprse firm was last shown in this FSU section on 4/08/21 with an annotated graph under the headline, "Gap Up Rebounding Further Above 50-Day Moving Average".
DT completed its $16.00 IPO on 8/01/19 and Secondary Offerings on 12/06/19, 2/21/20, and 6/03/20. The number of top-rated funds owning its shares rose from 226 in Sep '19 to 829 in Mar '21, a reassuring sign concerning the I criteria. Its current Up/Down Volume ratio of 0.8 is an unbiased indication its shares have encountered slight distributional pressure over the past 50 days. It has a B Timeliness rating and a B Sponsorship rating.
DT completed its $16.00 IPO on 8/01/19 and Secondary Offerings on 12/06/19, 2/21/20, and 6/03/20. The number of top-rated funds owning its shares rose from 226 in Sep '19 to 829 in Mar '21, a reassuring sign concerning the I criteria. Its current Up/Down Volume ratio of 0.8 is an unbiased indication its shares have encountered slight distributional pressure over the past 50 days. It has a B Timeliness rating and a B Sponsorship rating.
Chart courtesy of www.stockcharts.com
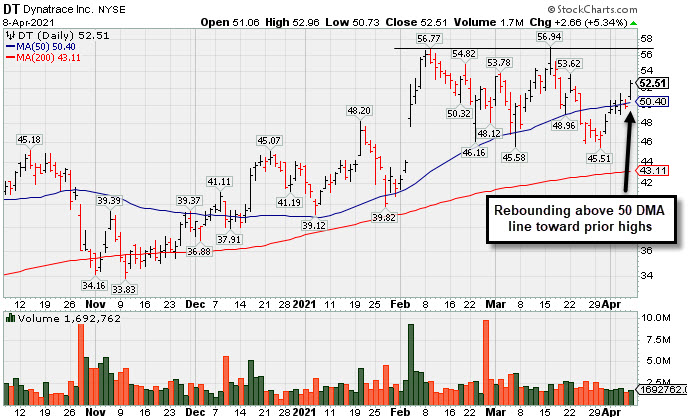
Gap Up Rebounding Further Above 50-Day Moving Average - Thursday, April 8, 2021
Dynatrace Inc (DT +$2.66 or +5.34% to $52.51) gapped up today above its 50-day moving average (DMA) line ($50.40) rebounding toward prior highs. Recent lows in the $45 area define important near-term support to watch on pullbacks. Its Relative Strength Rating is 73, still below the 80+ minimum guideline for buy candidates.
Fundamentals remain strong after it reported Dec '20 earnings +70% on +28% sales revenues versus the year ago period. It has a 98 Earnings Per Share Rating. DT was highlighted in yellow with pivot point cited based on its 9/02/20 high in the 2/04/21 mid-day report (read here). The high-ranked Computer Sftwr-Enterprse firm was last shown in this FSU section on 3/19/21 with an annotated graph under the headline, "50-Day Moving Average Line Tested Again". It completed its $16.00 IPO on 8/01/19 and Secondary Offerings on 12/06/19, 2/21/20, and 6/03/20.
The number of top-rated funds owning its shares rose from 226 in Sep '19 to 762 in Dec '20, a reassuring sign concerning the I criteria. Its current Up/Down Volume ratio of 0.9 is an unbiased indication its shares have encountered slight distributional pressure over the past 50 days. It has a B Timeliness rating and a B Sponsorship rating.
Chart courtesy of www.stockcharts.com
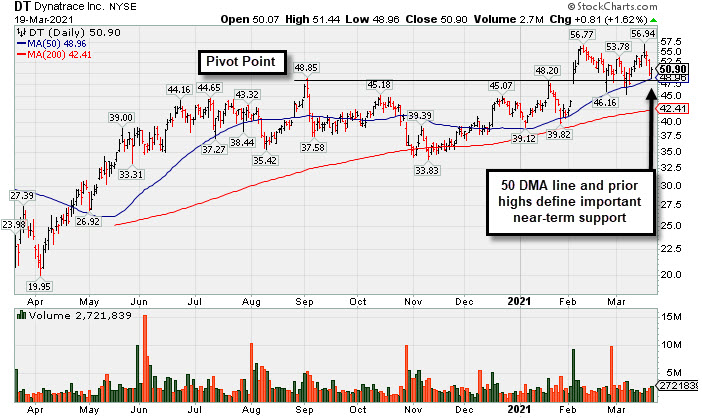
50-Day Moving Average Line Tested Again - Friday, March 19, 2021
Dynatrace Inc (DT +$0.81 or +1.62% to $50.90) pulled back below its "max buy" level and found support above Its 50-day moving average (DMA) line ($48.96) which it recently tested. Prior highs in the $48 area also help define import near-term support. More damaging losses would raise serious concerns. Its Relative Strength Rating has slumped to 67, well below the 80+ minimum guideline for buy candidates.
Fundamentals remain strong after it reported Dec '20 earnings +70% on +28% sales revenues versus the year ago period. It has a 98 Earnings Per Share Rating. DT was highlighted in yellow with pivot point cited based on its 9/02/20 high in the 2/04/21 mid-day report (read here). The high-ranked Computer Sftwr-Enterprse firm was last shown in this FSU section on 3/03/21 with an annotated graph under the headline, "Consolidating Above Prior Highs and 50-Day Moving Average". It completed its $16.00 IPO on 8/01/19 and Secondary Offerings on 12/06/19, 2/21/20, and 6/03/20.
Fundamentals remain strong after it reported Dec '20 earnings +70% on +28% sales revenues versus the year ago period. It has a 98 Earnings Per Share Rating. DT was highlighted in yellow with pivot point cited based on its 9/02/20 high in the 2/04/21 mid-day report (read here). The high-ranked Computer Sftwr-Enterprse firm was last shown in this FSU section on 3/03/21 with an annotated graph under the headline, "Consolidating Above Prior Highs and 50-Day Moving Average". It completed its $16.00 IPO on 8/01/19 and Secondary Offerings on 12/06/19, 2/21/20, and 6/03/20.
The number of top-rated funds owning its shares rose from 226 in Sep '19 to 745 in Dec '20, a reassuring sign concerning the I criteria. Its current Up/Down Volume ratio of 0.9 is an unbiased indication its shares have encountered slight distributional pressure over the past 50 days. It has a B Timeliness rating and a B Sponsorship rating.
Chart courtesy of www.stockcharts.com
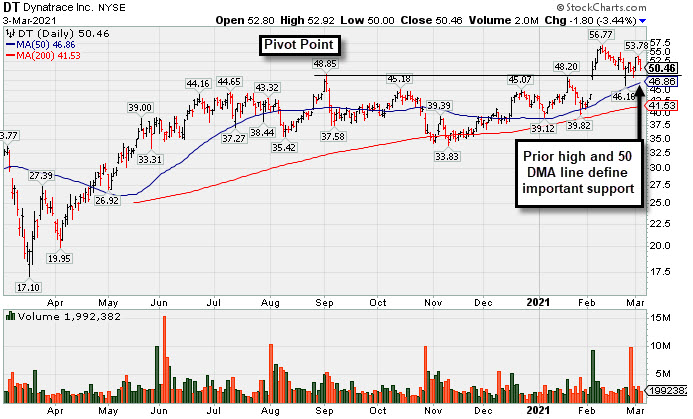
Consolidating Above Prior Highs and 50-Day Moving Average - Wednesday, March 3, 2021
Dynatrace Inc (DT -$1.80 to -3.44% to $50.46) pulled back with below average volume today. Its Relative Strength Rating of 70 remains below the 80+ minimum guideline for buy candidates. Prior highs in the $48 area define initial support to watch above its 50-day moving average(DMA) line ($46.48).
DT was highlighted in yellow with pivot point cited based on its 9/02/20 high in the 2/04/21 mid-day report (read here). It found support near its 200-day moving average (DMA) line during the consolidation after dropped from the Featured Stocks list on 9/08/20. Fundamentals remained strong. It reported Dec '20 earnings +70% on +28% sales revenues versus the year ago period, its 6th consecutive strong quarterly comparison versus the year ago periods. It has a 98 Earnings Per Share Rating.
The high-ranked Computer Sftwr-Enterprse firm was last shown in this FSU section on 2/04/21 with an annotated graph under the headline, "Breakout Action Returns Dynatrace to Featured Stocks List". It completed its $16.00 IPO on 8/01/19 and Secondary Offerings on 12/06/19, 2/21/20, and 6/03/20.
The number of top-rated funds owning its shares rose from 226 in Sep '19 to 736 in Dec '20, a reassuring sign concerning the I criteria. Its current Up/Down Volume ratio of 1.0 is an unbiased indication its shares have been neutral concerning accumulation/distribution over the past 50 days. It has a B Timeliness rating and a B Sponsorship rating.
Chart courtesy of www.stockcharts.com
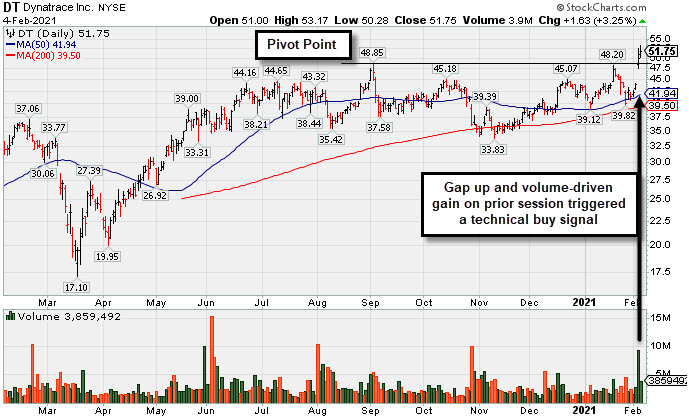
Breakout Action Returns Dynatrace to Featured Stocks List - Thursday, February 4, 2021
Dynatrace Inc (DT +$1.63 or +3.25% to $51.75) was highlighted in yellow with pivot point cited based on its 9/02/20 high in the earlier mid-day report (read here). It rose today following a gap up and volume-driven gain on the prior session which triggered a technical buy signal. It found support near its 200-day moving average (DMA) line during the consolidation after dropped from the Featured Stocks list on 9/08/20.
Fundamentals remain strong. It reported Dec '20 earnings +70% on +28% sales revenues versus the year ago period, its 6th consecutive strong quarterly comparison versus the year ago periods. It has a 98 Earnings Per Share Rating.
Fundamentals remain strong. It reported Dec '20 earnings +70% on +28% sales revenues versus the year ago period, its 6th consecutive strong quarterly comparison versus the year ago periods. It has a 98 Earnings Per Share Rating.
The high-ranked Computer Sftwr-Enterprse firm completed its $16.00 IPO on 8/01/19 and Secondary Offerings on 12/06/19, 2/21/20, and 6/03/20.
The number of top-rated funds owning its shares rose from 226 in Sep '19 to 716 in Dec '20, a reassuring sign concerning the I criteria. Its current Up/Down Volume ratio of 1.4 is an unbiased indication its shares have been under accumulation over the past 50 days. It has a B Timeliness rating and a B Sponsorship rating.
Chart courtesy of www.stockcharts.com
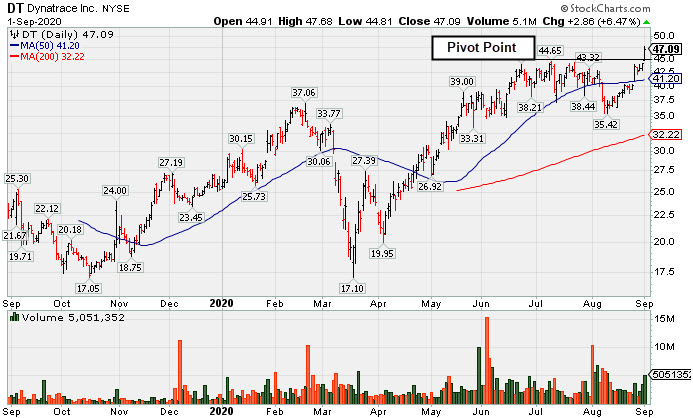
Volume-Driven Gain for New High Triggered Technical Buy Signal - Tuesday, September 1, 2020
Dynatrace Inc (DT +$2.86 or +6.47% to $47.09) was highlighted in yellow with pivot point cited based on its 7/10/20 high plus 10 cents in the earlier mid-day report (read here). It hit a new 52-week high with today's "breakaway gap" and volume-driven gain triggering a technical buy signal. The high-ranked Computer Sftwr-Enterprse firm completed yet another Secondary Offering on 6/03/20. Such offerings can hinder upward price progress for a while, however they often help companies to attract greater institutional ownership interest. There are 160.2 million shares in the public float (S criteria).
DT went through a deep consolidation and rebounded impressively since completing a Secondary Offering on 2/21/20. Recently it reported earnings +333% on +27% sales revenues for the Jun '20 quarter versus the year ago period, its 4th consecutive strong quarterly comparison versus the year ago periods. Limited history has been noted as a concern since it completed its $16.00 IPO on 8/01/19 and a Secondary Offering on 12/06/19.
The number of top-rated funds owning its shares rose from 226 in Sep '19 to 522 in Jun '20, a reassuring sign concerning the I criteria. Its current Up/Down Volume ratio of 1.2 is an unbiased indication its shares have been under accumulation over the past 50 days. It has an A Timeliness rating and a B Sponsorship rating.
Chart courtesy of www.stockcharts.com