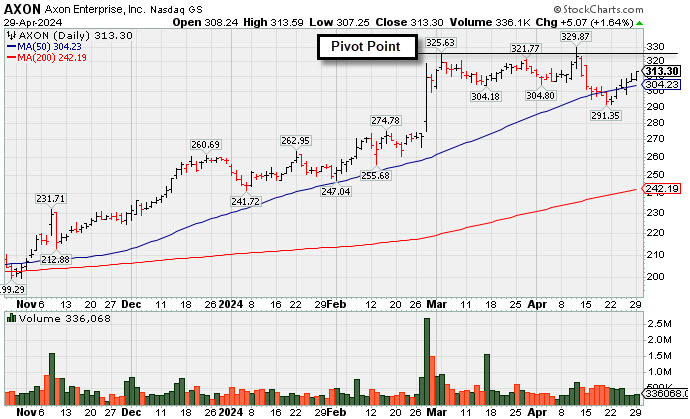
Found Support Near 50-Day Moving Average After Recent Stall - Monday, April 29, 2024
Axon Enterprise Inc's (AXON +$5.07 or +1.64% to $313.30) posted a 6th consecutive small gain today with below-average volume. It recently found prompt support near its 50-day moving average (DMA) line ($304.32). It sputtered after briefly rising above the new pivot point cited based on its 3/04/24 high plus 10 cents. Subsequent gains and a strong close above the pivot point backed by at least +40% above average volume may trigger a technical buy signal.
AXON was highlighted in yellow in the 11/08/23 mid-day report (read here) with pivot point cited based on its 10/17/23 high after a cup-with-handle base. It was last shown in detail in this FSU section on 4/08/24 with an annotated graph under the headline, "Volume Totals Cooling While Building a New Base".
Keep in mind it is due to report Mar '24 quarterly results on 5/06/24. Volkume and volatility often increase near earnings news. AXON reported Dec '23 quarterly earnings +60% on +29% sales revenues versus the year-ago period, its 5th strong quarter well above the +25% minimum earnings guideline (C criteria). Annual earnings had a slight downturn in FY '22 after years of strong growth.
The company has a small supply of only 75.3 million shares outstanding (S criteria) which can contribute to greater price volatility in the event of institutional buying or selling. The number of top-rated funds owning its shares rose from 978 in Mar '23 to 1,533 in Mar '24, a reassuring sign concerning the I criteria. AXON has a Timeliness Rating of A and an Accumulation/Distribution Rating of C-.
Charts courtesy www.stockcharts.com
| Symbol/Exchange Company Name Industry Group | PRICE | CHANGE | Day High | Volume (% DAV) (% 50 day avg vol) | 52 Wk Hi | Featured Date | Price Featured | Pivot Featured |
| Max Buy | ||||||||
Novo Nordisk ADR Medical-Ethical Drugs | $126.88 | +0.03 0.02% | $127.97 | 1,874,494 50 DAV is 4,703,000 | $138.28 -8.24% | 3/1/2024 | $124.23 | PP = $124.97 |
| MB = $131.22 | ||||||||
| Most Recent Note - 4/24/2024 5:13:30 PM G - Slumped below its 50 DMA line ($126) which may now act as resistance. A rebound above the 50 DMA line is needed for its outlook to improve. See the latest FSU analysis for more details and a new annotated graph. >>> FEATURED STOCK ARTICLE : Fell Below 50-Day Moving Average Which May Act as Resistance - 4/24/2024 | View all notes | Set NEW NOTE alert | Company Profile | SEC News | Chart | Request a new note | ||||||||
Axon Enterprise Security/Sfty | $313.30 | +5.07 1.64% | $313.59 | 336,044 50 DAV is 527,000 | $329.87 -5.02% | 4/5/2024 | $309.90 | PP = $325.73 |
| MB = $342.02 | ||||||||
Y - Posted a 6th consecutive small gain with below-average volume. It recently found prompt support near its 50 DMA line ($304). A gain and strong close above the pivot point backed by at least +40% above average volume is needed to trigger a proper technical buy signal. Fundamentals remain strong. See the latest FSU analysis for more details and a new annotated graph. >>> FEATURED STOCK ARTICLE : Found Support Near 50-Day Moving Average After Recent Stall - 4/29/2024 | View all notes | Set NEW NOTE alert | Company Profile | SEC News | Chart | Request a new note | ||||||||
TransDigm Group Aerospace/Defense | $1,258.72 | -0.43 -0.03% | $1,269.12 | 123,132 50 DAV is 194,000 | $1,269.51 -0.85% | 4/12/2024 | $1,224.21 | PP = $1,246.32 |
| MB = $1,308.64 | ||||||||
Y - Volume totals are cooling while holding its ground at its all-time high. New pivot point was cited based on its 4/04/24 high plus 10 cents. Subsequent gains above the pivot point backed by at least +40% above average volume are needed to trigger a proper new technical buy signal. Its 50 DMA line ($1,203) defines near-term support to watch. >>> FEATURED STOCK ARTICLE : Volume Totals Cooling While Perched Near High - 4/9/2024 | View all notes | Set NEW NOTE alert | Company Profile | SEC News | Chart | Request a new note | ||||||||
Paccar Trucks and Parts-Hvy Duty | $113.64 | +1.68 1.50% | $114.17 | 3,733,300 50 DAV is 2,328,000 | $125.50 -9.45% | 1/23/2024 | $100.35 | PP = $98.57 |
| MB = $103.50 | ||||||||
| Most Recent Note - 4/24/2024 5:17:09 PM G - Halted its slide after a recently noted slump below its 50 DMA line ($116) triggered a technical sell signal. A prompt rebound above the 50 DMA line is needed for its outlook to improve. Fundamentals remain strong. >>> FEATURED STOCK ARTICLE : Pulling Back From High and Slumping Toward 50-Day Moving Average - 4/12/2024 | View all notes | Set NEW NOTE alert | Company Profile | SEC News | Chart | Request a new note | ||||||||
Hubbell Electrical-Power/Equipmt | $407.19 | -0.34 -0.08% | $411.86 | 540,604 50 DAV is 403,000 | $429.61 -5.22% | 1/30/2024 | $343.26 | PP = $336.83 |
| MB = $353.67 | ||||||||
| Most Recent Note - 4/24/2024 5:15:39 PM G - Posted a 3rd consecutive gain today with below-average volume after finding prompt support near its 50 DMA line ($392.82). >>> FEATURED STOCK ARTICLE : Closed Just Below 50-Day Moving Average With Quiet Loss - 4/19/2024 | View all notes | Set NEW NOTE alert | Company Profile | SEC News | Chart | Request a new note | ||||||||
| Symbol/Exchange Company Name Industry Group | PRICE | CHANGE | Day High | Volume (% DAV) (% 50 day avg vol) | 52 Wk Hi | Featured Date | Price Featured | Pivot Featured |
| Max Buy | ||||||||
U.S. Lime & Minerals Bldg-Cement/Concrt/Ag | $309.00 | +1.56 0.51% | $309.83 | 12,263 50 DAV is 22,000 | $308.00 0.32% | 2/9/2024 | $254.68 | PP = $265.09 |
| MB = $278.34 | ||||||||
| Most Recent Note - 4/26/2024 4:28:41 PM G - Posted a gain with light volume today for a best-ever close and perched within close striking distance of its all-time high. Its 50 DMA line ($285) and recent lows define near-term support to watch. See the latest FSU analysis for more details and a new annotated graph. >>> FEATURED STOCK ARTICLE : Trading in Tight Range Near High - 4/26/2024 | View all notes | Set NEW NOTE alert | Company Profile | SEC News | Chart | Request a new note | ||||||||
Paymentus Holdings Finance-CrdtCard/PmtPr | $20.58 | -0.20 -0.96% | $20.97 | 234,993 50 DAV is 405,000 | $25.21 -18.37% | 3/5/2024 | $19.97 | PP = $18.89 |
| MB = $19.83 | ||||||||
| Most Recent Note - 4/26/2024 5:07:32 PM G - Posted a gain today with below-average volume, finding support above its 50 DMA line ($19.93). Prior highs in the $18 range define the next support. More damaging losses would raise greater concerns. >>> FEATURED STOCK ARTICLE : Prior Highs Define Important Near-Term Support - 4/22/2024 | View all notes | Set NEW NOTE alert | Company Profile | SEC News | Chart | Request a new note | ||||||||
HubSpot Comp Sftwr-Spec Enterprs | $636.16 | +5.03 0.80% | $644.66 | 363,784 50 DAV is 534,000 | $693.85 -8.31% | 4/4/2024 | $686.66 | PP = $660.10 |
| MB = $693.11 | ||||||||
| Most Recent Note - 4/25/2024 4:54:07 PM Y - Pulled back again today with near average volume, testing support at its 50 DMA line ($627) and recent lows. Stalled after highlighted yellow in the 4/04/24 mid-day report with pivot point cited based on its 2/09/24 high plus 10 cents. Fundamentals remain strong. See the latest FSU analysis for more details and an annotated graph. >>> FEATURED STOCK ARTICLE : HUBS Testing 50-day Moving Average Line Again - 4/25/2024 | View all notes | Set NEW NOTE alert | Company Profile | SEC News | Chart | Request a new note | ||||||||
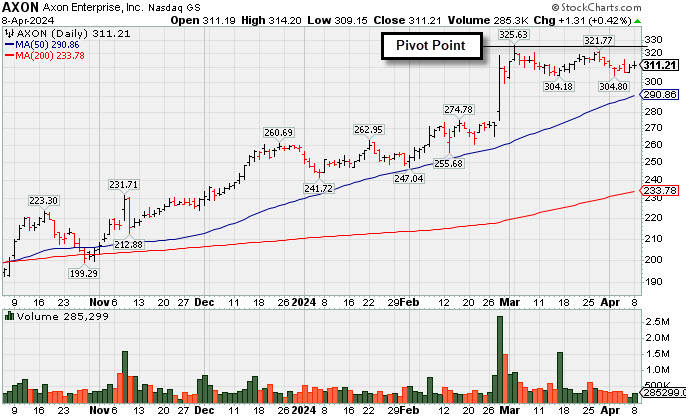
Volume Totals Cooling While Building a New Base - Monday, April 8, 2024
Axon Enterprise Inc's (AXON +$1.31 or +0.42% to $311.21) color code was changed to yellow with new pivot point cited based on its 3/04/24 high plus 10 cents while hovering in a tight range near its all-time high. Volume-driven gains above the pivot point are needed to trigger a proper technical buy signal. Its 50-day moving average (DMA) line ($291) defines near-term support to watch.
AXON was highlighted in yellow in the 11/08/23 mid-day report (read here) with new pivot point cited based on its 10/17/23 high after a cup-with-handle base. It was last shown in detail in this FSU section on 3/14/24 with an annotated graph under the headline, "Hovering Near All-Time High; Spiked Higher Following Earnings".
Bullish action came after AXON reported Dec '23 quarterly earnings +60% on +29% sales revenues versus the year-ago period, its 5th strong quarter well above the +25% minimum earnings guideline (C criteria). Annual earnings had a slight downturn in FY '22 after years of strong growth.
The company has a small supply of only 75.3 million shares outstanding (S criteria) which can contribute to greater price volatility in the event of institutional buying or selling. The number of top-rated funds owning its shares rose from 978 in Mar '23 to 1,517 in Mar '24, a reassuring sign concerning the I criteria. AXON has a Timeliness Rating of A and an Accumulation/Distribution Rating of B.
Charts courtesy www.stockcharts.com
| Symbol/Exchange Company Name Industry Group | PRICE | CHANGE | Day High | Volume (% DAV) (% 50 day avg vol) | 52 Wk Hi | Featured Date | Price Featured | Pivot Featured |
| Max Buy | ||||||||
Arista Networks Computer-Networking | $297.38 | -0.22 -0.07% | $299.18 | 1,323,888 50 DAV is 2,710,000 | $307.74 -3.37% | 3/18/2024 | $188.84 | PP = $292.76 |
| MB = $307.40 | ||||||||
| Most Recent Note - 4/5/2024 7:25:06 PM Y - Still hovering near its all-time high with recent gains lacking great volume conviction. Found support near prior highs in the $292 area and additional near-term support to watch is its 50 DMA line ($279) and an upward trendline connecting its October-March lows. >>> FEATURED STOCK ARTICLE : Consolidating Abover Recent Highs and Above 50-Day Average - 3/26/2024 | View all notes | Set NEW NOTE alert | Company Profile | SEC News | Chart | Request a new note | ||||||||
Novo Nordisk ADR Medical-Ethical Drugs | $127.46 | +1.60 1.27% | $127.63 | 3,011,803 50 DAV is 5,453,000 | $138.28 -7.82% | 3/1/2024 | $124.23 | PP = $124.97 |
| MB = $131.22 | ||||||||
Y - Posted a gain today with lighter volume. Quietly pulling back below the pivot point of the previously noted "3-weeks tight" base and testing its 50 DMA line ($124.30) which defines important near-term support. >>> FEATURED STOCK ARTICLE : Volume Cools While Consolidating Above 50-Day Moving Average Line - 4/3/2024 | View all notes | Set NEW NOTE alert | Company Profile | SEC News | Chart | Request a new note | ||||||||
Axon Enterprise Security/Sfty | $311.21 | +1.31 0.42% | $314.20 | 285,299 50 DAV is 493,000 | $325.63 -4.43% | 4/5/2024 | $309.90 | PP = $325.73 |
| MB = $342.02 | ||||||||
Y - Color code was changed to yellow with new pivot point cited based on its 3/04/24 high plus 10 cents. Volume totals have been cooling while hovering in a tight range near its all-time high. Volume-driven gains above the pivot point are needed to trigger a proper technical buy signal. Its 50-day moving average (DMA) line ($291) defines near-term support to watch. Fundamentals remain strong. See the latest FSU analysis for more details and a new annotated graph. >>> FEATURED STOCK ARTICLE : Volume Totals Cooling While Building a New Base - 4/8/2024 | View all notes | Set NEW NOTE alert | Company Profile | SEC News | Chart | Request a new note | ||||||||
TransDigm Group Aerospace/Defense | $1,233.29 | -1.99 -0.16% | $1,239.26 | 121,851 50 DAV is 218,000 | $1,246.22 -1.04% | 12/12/2023 | $1,000.39 | PP = $1,013.18 |
| MB = $1,063.84 | ||||||||
| Most Recent Note - 4/5/2024 7:26:47 PM G - Rebounded today following a "negative reversal" on the prior session after touching a new all-time high. Its 50 DMA line ($1,168) defines near-term support to watch. >>> FEATURED STOCK ARTICLE : Perched in Tight Range Encountering Distribtion Near All-Time High - 3/15/2024 | View all notes | Set NEW NOTE alert | Company Profile | SEC News | Chart | Request a new note | ||||||||
CrowdStrike Holdings Computer Sftwr-Security | $313.69 | -1.81 -0.57% | $316.64 | 1,432,536 50 DAV is 3,943,000 | $365.00 -14.06% | 1/2/2024 | $246.42 | PP = $261.91 |
| MB = $275.01 | ||||||||
G - Still lingering below its 50 DMA ($317.59) with volume totals cooling. A rebound above the 50 DMA line is needed for its outlook to improve. It has not formed a sound base. Fundamentals remain strong after it reported Jan ''24 quarterly earnings +102% on +33% sales revenues versus the year-ago period. >>> FEATURED STOCK ARTICLE : 50-Day Moving Average Line Support Being Tested - 4/1/2024 | View all notes | Set NEW NOTE alert | Company Profile | SEC News | Chart | Request a new note | ||||||||
| Symbol/Exchange Company Name Industry Group | PRICE | CHANGE | Day High | Volume (% DAV) (% 50 day avg vol) | 52 Wk Hi | Featured Date | Price Featured | Pivot Featured |
| Max Buy | ||||||||
Paccar Trucks and Parts-Hvy Duty | $122.51 | +0.30 0.25% | $123.20 | 1,837,468 50 DAV is 2,184,000 | $125.50 -2.38% | 1/23/2024 | $100.35 | PP = $98.57 |
| MB = $103.50 | ||||||||
| Most Recent Note - 4/5/2024 7:37:28 PM G - Posted a 2nd consecutive gain today with lighter volume after pulling back from its all-time high. Very extended from any sound base, its 50 DMA line ($112.61) defines near-term support to watch. Fundamentals remain strong. >>> FEATURED STOCK ARTICLE : Hit New High With 5th Consecutive Gain - 3/21/2024 | View all notes | Set NEW NOTE alert | Company Profile | SEC News | Chart | Request a new note | ||||||||
Hubbell Electrical-Power/Equipmt | $415.74 | -1.34 -0.32% | $420.03 | 363,288 50 DAV is 444,000 | $429.61 -3.23% | 1/30/2024 | $343.26 | PP = $336.83 |
| MB = $353.67 | ||||||||
G - Holding its ground after a noted "negative reversal" at its all-time high on 4/04/24. It is very extended from the previously noted base. Its 50 DMA line ($380.73) defines important support to watch. >>> FEATURED STOCK ARTICLE : Hubbell Perched at All-Time High After 5 Weekly Gains - 3/22/2024 | View all notes | Set NEW NOTE alert | Company Profile | SEC News | Chart | Request a new note | ||||||||
Manhattan Associates Computer Sftwr-Enterprse | $242.09 | -1.42 -0.58% | $244.95 | 326,083 50 DAV is 384,000 | $266.94 -9.31% | 1/31/2024 | $240.57 | PP = $230.71 |
| MB = $242.25 | ||||||||
| Most Recent Note - 4/5/2024 7:34:27 PM G - Sputtering beneath its 50 DMA line ($247.20) this week raising concerns. Recent lows in the $239-241 area define important near-term support where violations would raise greater concerns and trigger a worrisome technical sell signal. >>> FEATURED STOCK ARTICLE : Manhattan Associates Consolidating Above 50-Day Moving Average - 3/25/2024 | View all notes | Set NEW NOTE alert | Company Profile | SEC News | Chart | Request a new note | ||||||||
U.S. Lime & Minerals Bldg-Cement/Concrt/Ag | $304.28 | -0.72 -0.24% | $308.00 | 30,613 50 DAV is 25,000 | $307.48 -1.04% | 2/9/2024 | $254.68 | PP = $265.09 |
| MB = $278.34 | ||||||||
G - Inching higher again today for a new all-time high, extended from the previously noted base. Its 50 DMA line ($273) defines near-term support to watch. >>> FEATURED STOCK ARTICLE : Gain With Light Volume for Best Ever Close - 4/5/2024 | View all notes | Set NEW NOTE alert | Company Profile | SEC News | Chart | Request a new note | ||||||||
ServiceNow Computer Sftwr-Enterprse | $785.60 | +2.10 0.27% | $789.99 | 989,670 50 DAV is 1,219,000 | $815.32 -3.65% | 2/22/2024 | $771.75 | PP = $815.32 |
| MB = $856.09 | ||||||||
| Most Recent Note - 4/5/2024 7:22:30 PM Y - Posted a solid gain today with average (higher) volume, finding support near its 50 DMA line ($770). Prior lows in the $730 area define the next important near-term support to watch. >>> FEATURED STOCK ARTICLE : NOW Quietly Rebounded Above 50-Day Moving Average Line - 3/20/2024 | View all notes | Set NEW NOTE alert | Company Profile | SEC News | Chart | Request a new note | ||||||||
| Symbol/Exchange Company Name Industry Group | PRICE | CHANGE | Day High | Volume (% DAV) (% 50 day avg vol) | 52 Wk Hi | Featured Date | Price Featured | Pivot Featured |
| Max Buy | ||||||||
Synopsys Computer Sftwr-Design | $576.54 | +1.09 0.19% | $577.87 | 596,661 50 DAV is 1,088,000 | $629.38 -8.40% | 2/22/2024 | $600.65 | PP = $582.85 |
| MB = $611.99 | ||||||||
| Most Recent Note - 4/5/2024 7:35:58 PM Y - Volume totals have been cooling while still consolidating just above near-term support at its 50 DMA line ($566). More damaging losses would raise concerns and trigger a technical sell signal. Previously noted - " A strong volume-driven gain and close above the pivot point is needed to clinch a proper technical buy signal." >>> FEATURED STOCK ARTICLE : Rallying From Support at 50-Day Moving Average Line - 3/19/2024 | View all notes | Set NEW NOTE alert | Company Profile | SEC News | Chart | Request a new note | ||||||||
Paymentus Holdings Finance-CrdtCard/PmtPr | $21.27 | +0.59 2.85% | $21.64 | 469,897 50 DAV is 366,000 | $25.21 -15.63% | 3/5/2024 | $19.97 | PP = $18.89 |
| MB = $19.83 | ||||||||
G - Posted a gain today with higher (+28% above-average) volume. It is extended from the previously noted base. Its 50 DMA line ($18.80) coincides with prior highs in the $18 range defining important support to watch on pullbacks. >>> FEATURED STOCK ARTICLE : Consolidating After Powerful Breakout and Volume-Driven Gains - 3/27/2024 | View all notes | Set NEW NOTE alert | Company Profile | SEC News | Chart | Request a new note | ||||||||
HubSpot Comp Sftwr-Spec Enterprs | $670.15 | +0.15 0.02% | $674.50 | 456,696 50 DAV is 521,000 | $693.85 -3.42% | 4/4/2024 | $686.66 | PP = $660.10 |
| MB = $693.11 | ||||||||
| Most Recent Note - 4/5/2024 11:51:26 AM Y - Gapped up today and on track for a solid gain. On the prior session it finished in middle of its intra-day range after highlighted yellow in the mid-day report with pivot point cited based on its 2/09/24 high plus 10 cents. Hit a new 52-week high with a volume-driven gain triggering a technical buy signal after finding prompt support at its 50 DMA line ($617) in recent weeks. Reported Dec '23 quarterly earnings +59% on +24% sales revenues versus the year-ago period, its 6th consecutive quarterly comparison well above the +25% minimum guideline (C criteria). Annual earnings history (A criteria) has been strong. Faces some resistance due to old overhead supply up to the $866 level. See the latest FSU analysis for more details and a new annotated graph. >>> FEATURED STOCK ARTICLE : Encountered Distributional Pressure and Finished Below Pivot Point - 4/4/2024 | View all notes | Set NEW NOTE alert | Company Profile | SEC News | Chart | Request a new note | ||||||||
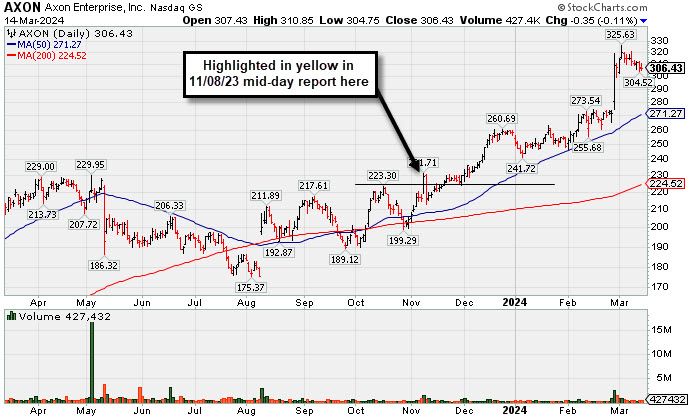
Hovering Near All-Time High; Spiked Higher Following Earnings - Thursday, March 14, 2024
Axon Enterprise Inc (AXON -$0.16 or -0.05% to $306.62) pulled back today with below-average volume, still hovering near its all-time high. Its 50-day moving average (DMA) line ($271) defines near-term support to watch.
AXON was highlighted in yellow in the 11/08/23 mid-day report (read here) with new pivot point cited based on its 10/17/23 high after a cup-with-handle base. It was shown in detail in this FSU section on 2/12/24 with an annotated graph under the headline, "Reversal at All-Time High After 7 Consecutive Gains".
Bullish action came after AXON reported Dec '23 quarterly earnings +60% on +29% sales revenues versus the year-ago period, its 5th strong quarter well above the +25% minimum earnings guideline (C criteria). Annual earnings had a slight downturn in FY '22 after years of strong growth.
The company has a small supply of only 74.9 million shares outstanding (S criteria) which can contribute to greater price volatility in the event of institutional buying or selling. The number of top-rated funds owning its shares rose from 978 in Mar '23 to 1,468 in Dec '23, a reassuring sign concerning the I criteria. AXON has a Timeliness Rating of A and an Accumulation/Distribution Rating of B.
Charts courtesy www.stockcharts.com
Reversal at All-Time High After 7 Consecutive Gains - Monday, February 12, 2024
Axon Enterprise Inc (AXON -$4.27 or -1.58% to $266.71) had a "negative reversal" after reaching a new all-time high today following 7 consecutive gains. Prior highs in the $260-262 area define initial suport above its 50-day moving average (DMA) line ($251.23).
AXON was highlighted in yellow in the 11/08/23 mid-day report (read here) with new pivot point cited based on its 10/17/23 high after a cup-with-handle base. It hit a new all-time high and finished near the session high triggering a technical buy signal. It was shown in detail in this FSU section on 1/09/24 with an annotated graph under the headline, "Consolidating Well Above Near-Term Support".
AXON reported Sep '23 quarterly earnings +70% on +33% sales revenues versus the year-ago period, its 4th strong quarter well above the +25% minimum earnings guideline (C criteria). Annual earnings had a slight downturn in FY '22 after years of strong growth.
The company has a small supply of only 74.9 million shares outstanding (S criteria) which can contribute to greater price volatility in the event of institutional buying or selling. The number of top-rated funds owning its shares rose from 978 in Mar '23 to 1,419 in Dec '23, a reassuring sign concerning the I criteria. AXON has a Timeliness Rating of A and an Accumulation/Distribution Rating of B.
Charts courtesy www.stockcharts.com

| Symbol/Exchange Company Name Industry Group | PRICE | CHANGE | Day High | Volume (% DAV) (% 50 day avg vol) | 52 Wk Hi | Featured Date | Price Featured | Pivot Featured |
| Max Buy | ||||||||
Arista Networks Computer-Networking | $280.88 | -1.57 -0.56% | $292.66 | 9,167,749 50 DAV is 1,797,000 | $284.82 -1.38% | 10/31/2023 | $188.84 | PP = $198.80 |
| MB = $208.74 | ||||||||
G - Posting a 4th consecutive volume-driven gain today hitting yet another new all-time high, getting very extended from any sound base. Its 50 DMA line ($246) defines important near-term support to watch on pullbacks. >>> FEATURED STOCK ARTICLE : Pulled Back From All Time High With Gap Down on Prior Session - 2/1/2024 | View all notes | Set NEW NOTE alert | Company Profile | SEC News | Chart | Request a new note | ||||||||
Novo Nordisk ADR Medical-Ethical Drugs | $120.53 | -0.67 -0.55% | $120.85 | 4,256,829 50 DAV is 4,361,000 | $121.65 -0.92% | 11/2/2023 | $100.97 | PP = $104.10 |
| MB = $109.31 | ||||||||
| Most Recent Note - 2/9/2024 6:09:56 PM G - Gapped up and posted a gain with +21% above average volume for yet another new all-time high. Its 50 DMA line ($105.43) and recent low ($103.38 on 1/23/24) define important near-term support to watch on pullbacks. See the latest FSU analysis for more details and an annotated graph. >>> FEATURED STOCK ARTICLE : Extended From Any Sound Base After Volume-Driven Gains - 2/8/2024 | View all notes | Set NEW NOTE alert | Company Profile | SEC News | Chart | Request a new note | ||||||||
Axon Enterprise Security/Sfty | $266.71 | -4.27 -1.58% | $273.54 | 478,799 50 DAV is 390,000 | $271.39 -1.72% | 11/8/2023 | $127.84 | PP = $223.30 |
| MB = $234.47 | ||||||||
G - After hitting a new all-time high today there was a "negative reversal" following 7 consecutive gains. Prior highs in the $260-262 area define initial support to watch above its 50-day moving average (DMA) line ($248.72). See the latest FSU analysis for more details and new annotated graph. >>> FEATURED STOCK ARTICLE : Reversal at All-Time High After 7 Consecutive Gains - 2/12/2024 | View all notes | Set NEW NOTE alert | Company Profile | SEC News | Chart | Request a new note | ||||||||
TransDigm Group Aerospace/Defense | $1,109.17 | -10.72 -0.96% | $1,119.09 | 219,907 50 DAV is 206,000 | $1,155.24 -3.99% | 12/12/2023 | $1,000.39 | PP = $1,013.18 |
| MB = $1,063.84 | ||||||||
| Most Recent Note - 2/8/2024 1:00:40 PM G - Extended from any sound base today's 8th consecutive gain with above-average volume has it hitting yet another new all-time high. Its 50 DMA line ($1,025) defines near-term support to watch above prior highs in the $1,013-1,015 area. >>> FEATURED STOCK ARTICLE : Inching to New Highs With 6th Consecutive Gain - 1/11/2024 | View all notes | Set NEW NOTE alert | Company Profile | SEC News | Chart | Request a new note | ||||||||
Palo Alto Networks Computer Sftwr-Security | $371.96 | -4.94 -1.31% | $376.30 | 2,864,175 50 DAV is 3,654,000 | $380.84 -2.33% | 1/10/2024 | $313.65 | PP = $318.00 |
| MB = $333.90 | ||||||||
| Most Recent Note - 2/9/2024 6:02:34 PM G - Volume was near average behind today''s 3rd consecutive gain for a new all-time high, getting very extended from any sound base. Prior high ($318) and its 50 DMA line ($316.46) define important support to watch on pullbacks. >>> FEATURED STOCK ARTICLE : Paused After 6 Gains to a New All-Time High - 1/17/2024 | View all notes | Set NEW NOTE alert | Company Profile | SEC News | Chart | Request a new note | ||||||||
| Symbol/Exchange Company Name Industry Group | PRICE | CHANGE | Day High | Volume (% DAV) (% 50 day avg vol) | 52 Wk Hi | Featured Date | Price Featured | Pivot Featured |
| Max Buy | ||||||||
United Rentals Comml Svcs-Leasing | $663.53 | +13.18 2.03% | $673.68 | 515,287 50 DAV is 709,000 | $658.86 0.71% | 1/24/2024 | $576.90 | PP = $585.60 |
| MB = $614.88 | ||||||||
G - Volume was below-average behind today''s gain for yet another new all-time high. Prior high ($585.50) defines initial support to watch. Reported Dec ''23 quarterly earnings +16% on +13% sales revenues versus the year-ago period, below the +25% minimum earnings guideline (C criteria) raising fundamental concerns. >>> FEATURED STOCK ARTICLE : Negative Reversal After New High for United Rentals - 1/24/2024 | View all notes | Set NEW NOTE alert | Company Profile | SEC News | Chart | Request a new note | ||||||||
The Bancorp Banks-Northeast | $44.40 | +0.51 1.16% | $45.46 | 501,997 50 DAV is 489,000 | $47.11 -5.75% | 1/22/2024 | $40.87 | PP = $42.56 |
| MB = $44.69 | ||||||||
| Most Recent Note - 2/9/2024 6:06:20 PM Y - Posted a big gain with average volume and closed near the session high. Found support when testing prior highs in the $42 area and its color code was changed to yellow while trading below its "max buy". Fundamentals remain strong. >>> FEATURED STOCK ARTICLE : Volume-Driven Breakout Triggered Buy Signal After Earnings Report - 1/26/2024 | View all notes | Set NEW NOTE alert | Company Profile | SEC News | Chart | Request a new note | ||||||||
lululemon athletica Retail-Apparel/Shoes/Acc | $466.08 | -4.16 -0.88% | $478.00 | 1,170,718 50 DAV is 1,584,000 | $516.39 -9.74% | 12/8/2023 | $490.61 | PP = $485.93 |
| MB = $510.23 | ||||||||
| Most Recent Note - 2/8/2024 6:31:48 PM G - Posted a solid gain today with average volume, rebounding toward its 50 DMA line ($481) which may act as resistance. A rebound above the 50 DMA line is needed to help its outlook improve. >>> FEATURED STOCK ARTICLE : Violation of 50-Day Moving Average Hurt Outlook - 2/2/2024 | View all notes | Set NEW NOTE alert | Company Profile | SEC News | Chart | Request a new note | ||||||||
CrowdStrike Holdings Computer Sftwr-Security | $321.29 | -8.05 -2.44% | $330.67 | 3,405,909 50 DAV is 3,331,000 | $336.99 -4.66% | 1/2/2024 | $246.42 | PP = $261.91 |
| MB = $275.01 | ||||||||
G - Very extended from any sound base, it pulled back from its all-time high with average volume behind today''s loss after 3 consecutive gains. Its 50 DMA line ($272) defines near-term support to watch. Fundamentals remain strong. >>> FEATURED STOCK ARTICLE : Volume Totals Cooking While Stubbornly Perched at All-Time High - 2/6/2024 | View all notes | Set NEW NOTE alert | Company Profile | SEC News | Chart | Request a new note | ||||||||
e.l.f. Beauty Cosmetics/Personal Care | $171.91 | -2.61 -1.50% | $179.58 | 1,392,378 50 DAV is 1,479,000 | $175.74 -2.18% | 1/2/2024 | $138.23 | PP = $153.63 |
| MB = $161.31 | ||||||||
| Most Recent Note - 2/8/2024 6:30:19 PM G - Perched near its all-time high today after another big volume-driven gain. Reported Dec '23 quarterly earnings +54% on +85% sales revenues versus the year-ago period, continuing its strong earnings track record. Volume and volatility often increase near earnings news. Its 50 DMA line ($147) defines important near-term support to watch. >>> FEATURED STOCK ARTICLE : Peched at All-Time High With Earnings News Due - 2/5/2024 | View all notes | Set NEW NOTE alert | Company Profile | SEC News | Chart | Request a new note | ||||||||
| Symbol/Exchange Company Name Industry Group | PRICE | CHANGE | Day High | Volume (% DAV) (% 50 day avg vol) | 52 Wk Hi | Featured Date | Price Featured | Pivot Featured |
| Max Buy | ||||||||
Coca-Cola Femsa ADR Beverages-Non-Alcoholic | $97.78 | +0.17 0.17% | $98.42 | 89,564 50 DAV is 155,000 | $102.94 -5.01% | 1/12/2024 | $93.38 | PP = $99.34 |
| MB = $104.31 | ||||||||
| Most Recent Note - 2/8/2024 6:40:59 PM Y - Holding its ground with volume totals cooling after abruptly reversing from its high this week and undercutting its prior high raising concerns. Its 50 DMA line ($92.34) recently acted as support. A valid secondary buy point was noted up to +5% above the 12/19/23 high since finding support at its 10 WMA line after an earlier breakout. Its Relative Strength Rating is currently 82, above the 80+ minimum guideline for buy candidates. >>> FEATURED STOCK ARTICLE : Secondary Buy Point Noted After Finding Support - 1/12/2024 | View all notes | Set NEW NOTE alert | Company Profile | SEC News | Chart | Request a new note | ||||||||
Paccar Trucks and Parts-Hvy Duty | $106.02 | +0.01 0.01% | $106.41 | 1,378,149 50 DAV is 2,326,000 | $106.23 -0.20% | 1/23/2024 | $100.35 | PP = $98.57 |
| MB = $103.50 | ||||||||
G - Hit a new all-time high with today''s 8th consecutive gain, getting extended from any sound base. Reported Dec '23 quarterly earnings +53% on +11% sales revenues versus the year-ago period, its 9th quarterly comparison with better than the +25% minimum earnings guideline (C criteria). There was a downturn in FY' 20 annual earnings (A criteria) like many companies during the pandemic. >>> FEATURED STOCK ARTICLE : Volume-Driven Breakout for Paccar - 1/23/2024 | View all notes | Set NEW NOTE alert | Company Profile | SEC News | Chart | Request a new note | ||||||||
Hubbell Electrical-Power/Equipmt | $359.82 | -3.19 -0.88% | $364.76 | 295,342 50 DAV is 391,000 | $363.36 -0.97% | 1/30/2024 | $343.26 | PP = $336.83 |
| MB = $353.67 | ||||||||
| Most Recent Note - 2/8/2024 6:38:20 PM G - Hit yet another new all-time high with today''s gain backed by below-average volume, wedging above its "max buy" level, and its color code is changed to green. Prior high ($340) defines initial support to watch on pullbacks. >>> FEATURED STOCK ARTICLE : Volume Heavy Behind Breakout Gain for Hubbell - 1/30/2024 | View all notes | Set NEW NOTE alert | Company Profile | SEC News | Chart | Request a new note | ||||||||
Manhattan Associates Computer Sftwr-Enterprse | $245.86 | -4.64 -1.85% | $251.00 | 315,461 50 DAV is 433,000 | $258.91 -5.04% | 1/31/2024 | $240.57 | PP = $230.71 |
| MB = $242.25 | ||||||||
G - Pulled back from its all-time high with light volume behind today''s loss. Prior highs in the $230 area define near-term support to watch on pullbacks. >>> FEATURED STOCK ARTICLE : Big Volume Behind Breakout Gain - 1/31/2024 | View all notes | Set NEW NOTE alert | Company Profile | SEC News | Chart | Request a new note | ||||||||
Tenable Holdings Computer Sftwr-Security | $50.69 | -1.20 -2.31% | $52.50 | 1,403,610 50 DAV is 1,009,000 | $53.50 -5.25% | 2/7/2024 | $49.50 | PP = $49.87 |
| MB = $52.36 | ||||||||
| Most Recent Note - 2/9/2024 6:12:18 PM Y - Posted a 4th consecutive volume-driven gain today for a new high close approaching its "max buy" level. Bullish action this week came after it reported earnings for the Dec '23 quarter +108% on +16% sales revenues versus the year-ago period. Prior highs in the $49 area define initial support to watch on pullbacks. Prior quarterly and annual earnings history is a good match with the fact-based investment system's fundamental guidelines. >>> FEATURED STOCK ARTICLE : Gap Up Gain Followed Latest Earnings Report - 2/7/2024 | View all notes | Set NEW NOTE alert | Company Profile | SEC News | Chart | Request a new note | ||||||||
| Symbol/Exchange Company Name Industry Group | PRICE | CHANGE | Day High | Volume (% DAV) (% 50 day avg vol) | 52 Wk Hi | Featured Date | Price Featured | Pivot Featured |
| Max Buy | ||||||||
U.S. Lime & Minerals Bldg-Cement/Concrt/Ag | $262.30 | +2.31 0.89% | $266.88 | 36,477 50 DAV is 18,000 | $264.99 -1.02% | 2/9/2024 | $254.68 | PP = $265.09 |
| MB = $278.34 | ||||||||
Y - Hitting a new all-time high with today's 4th consecutive gain backed by ever-increasing volume. Finished strong and managed a best-ever close after highlighted in yellow in the 2/09/24 mid-day report with pivot point cited based on its 1/24/24 high plus 10 cents. Subsequent gains and a close above the pivot point backed by at least +40% above average volume may trigger a conviciing new technical buy signal. Through Dec '23 its quarterly and annual earnings (C and A criteria) history has been strong, a good match with the fact-based investment system's guidelines. Thinly traded firm has only 5.7 million shares outstanding (S criteria), which can contribute to greater price volatility in the event of institutional buying or selling. >>> FEATURED STOCK ARTICLE : Strong Finish for Thinly Traded U.S Lime & Minerals - 2/9/2024 | View all notes | Set NEW NOTE alert | Company Profile | SEC News | Chart | Request a new note | ||||||||
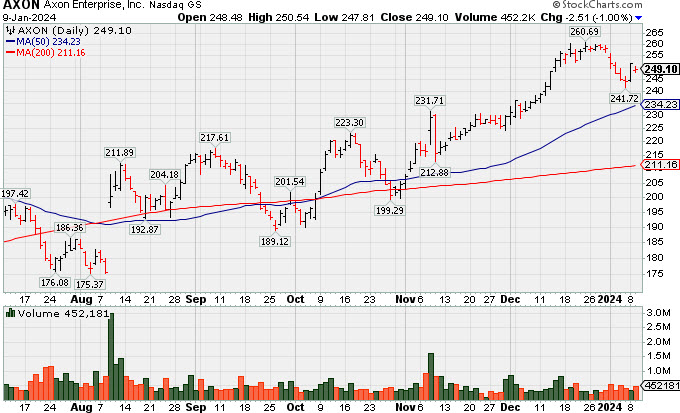
Consolidating Well Above Near-Term Support - Tuesday, January 9, 2024
Axon Enterprise Inc (AXON -$2.51 or -1.00% to $249.10) pulled back today with average volume. Its 50-day moving average (DMA) line ($233) defines near-term support above prior highs in the $229-231 area.
AXON was highlighted in yellow in the 11/08/23 mid-day report (read here) with new pivot point cited based on its 10/17/23 high after a cup-with-handle base. It hit a new all-time high and finished near the session high triggering a technical buy signal. It was shown in detail in this FSU section on 12/13/23 with an annotated graph under the headline, "Axon Enterprise Hits New High With 6th Straight Gain".
AXON reported Sep '23 quarterly earnings +70% on +33% sales revenues versus the year-ago period, its 4th strong quarter well above the +25% minimum earnings guideline (C criteria). Annual earnings had a slight downturn in FY '22 after years of strong growth.
The company has a small supply of only 74.9 million shares outstanding (S criteria) which can contribute to greater price volatility in the event of institutional buying or selling. The number of top-rated funds owning its shares rose from 978 in Mar '23 to 1,376 in Sep '23, a reassuring sign concerning the I criteria. AXON has a Timeliness Rating of A and an Accumulation/Distribution Rating of B+.
Charts courtesy www.stockcharts.com
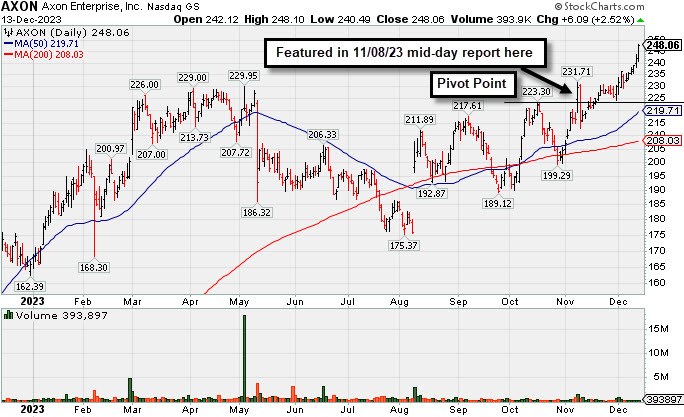
Axon Enterprise Hits New High With 6th Straight Gain - Wednesday, December 13, 2023
Axon Enterprise Inc (AXON +$6.09 or +2.52% to $248.06) hit a new all-time high with today's 6th consecutive gain backed by below average volume. On pullbacks, the prior highs in the $229-231 area define near-term support to watch above its 50-day moving average (DMA) line ($219.71).
AXON was highlighted in yellow in the 11/08/23 mid-day report (read here) with new pivot point cited based on its 10/17/23 high after a cup-with-handle base. It hit a new all-time high and finished near the session high triggering a technical buy signal. It was shown in detail that evening under the headline, "Breakout for Axon as it Returns to Featured Stocks List".
AXON reported Sep '23 quarterly earnings +70% on +33% sales revenues versus the year-ago period, its 4th strong quarter well above the +25% minimum earnings guideline (C criteria). Annual earnings had a slight downturn in FY '22 after years of strong growth.
The company has a small supply of only 74.8 million shares outstanding (S criteria) which can contribute to greater price volatility in the event of institutional buying or selling. The number of top-rated funds owning its shares rose from 400 in Sep '19 to 1,358 in Sep '23, a reassuring sign concerning the I criteria. AXON has a Timeliness Rating of A and an Accumulation/Distribution Rating of A.
Charts courtesy www.stockcharts.com
Breakout for Axon as it Returns to Featured Stocks List - Wednesday, November 8, 2023
Axon Enterprise Inc (AXON +$13.09 or +6.05% to $229.46) was highlighted in yellow with new pivot point cited based on its 10/17/23 high after a cup-with-handle base. It hit a new all-time high today and finished near the session high triggering a technical buy signal. It found support near its 200 DMA line in recent months. AXON reported Sep '23 quarterly earnings +70% on +33% sales revenues versus the year-ago period, its 4th strong quarter well above the +25% minimum earnings guideline (C criteria). Annual earnings had a slight downturn in FY '22 after years of strong growth.
The company has a small supply of only 74.8 million shares outstanding (S criteria) which can contribute to greater price volatility in the event of institutional buying or selling. The number of top-rated funds owning its shares rose from 400 in Sep '19 to 1,367 in Sep '23, a reassuring sign concerning the I criteria. AXON has a Timeliness Rating of A and an Accumulation/Distribution Rating of A-.
Ch
arts courtesy www.stockcharts.com
x
Slumping Toward 50-Day Average Following Great Rally - Friday, February 26, 2021
Axon Enterprise Inc (AXON +$5.59 or +3.50% to $165.49) posted a gain today breaking a streak of 4 consecutive losses while slumping toward its 50-day moving average DMA line ($153.35). It reported Dec '20 quarterly earnings +144% on +32% sales revenues versus the year ago period. Fundamentals remain strong. Five of the past 6 quarterly comparisons versus the year ago periods showed earnings increases above the +25% minimum guideline (C criteria) with strong underlying sales revenues increases. Its annual earnings (A criteria) history has also been strong, helping it get an 98 Earnings Per Share Rating.
Formerly this company's shares traded under the ticker symbol AAXN where prior notes and detailed analysis may be reviewed. It made considerable progress but then retreated since last shown in this FSU section on 2/02/21 with an annotated graph under the headline, "Extended From Prior Base Following Streak fo Volume-Driven Gains".
The company has a small supply of only 63.5 million shares outstanding (S criteria) which can contribute to greater price volatility in the event of institutional buying or selling. The number of top-rated funds owning its shares rose from 400 in Sep '19 to 579 in Dec '20, a reassuring sign concerning the I criteria. AXON has a Timeliness Rating of B and an Accumulation/Distribution Rating of B. The Security/Safety industry group currently has a Group Relative Strength Rating of B+ (70). AXON completed a new Pubic Offering on 6/17/20. Such offerings often hinder price progress temporarily, yet they help companies attract greater institutional ownership interest (I criteria).
Charts courtesy www.stockcharts.com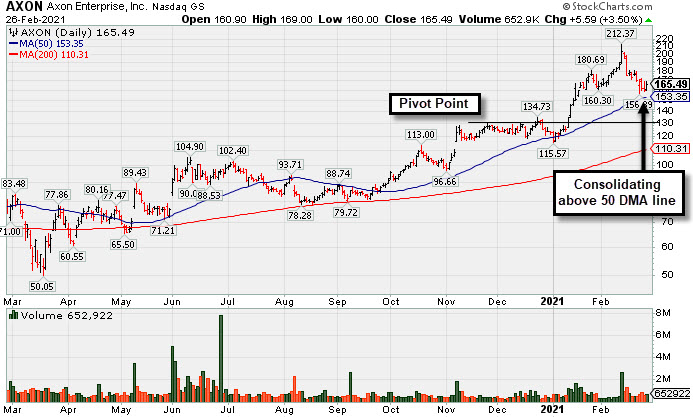
Extended From Prior Base Following Streak fo Volume-Driven Gains - Tuesday, February 2, 2021
Axon Enterprise Inc (AXON +$0.38 or +0.23% to $166.53) is very extended from any sound base. The prior high ($134) defines important support coinciding with its 50-day moving average (DMA) line which acted as support during the recent consolidation. Fundamentals remain strong. Formerly this company's shares traded under the ticker symbol AAXN where prior notes and detailed analysis may be reviewed. It made considerable progress since last shown in this FSU section on 1/15/21 with an annotated graph under the headline, "Hit New Highs With Streak of Big Volume-Driven Gains".
The company has a small supply of only 63.5 million shares outstanding (S criteria) which can contribute to greater price volatility in the event of institutional buying or selling. The number of top-rated funds owning its shares rose from 400 in Sep '19 to 569 in Dec '20, a reassuring sign concerning the I criteria. AXON has a Timeliness Rating of B and an Accumulation/Distribution Rating of A+. The Security/Safety industry group currently has a Group Relative Strength Rating of B+ (73). AXON completed a new Pubic Offering on 6/17/20. Such offerings often hinder price progress temporarily, yet they help companies attract greater institutional ownership interest (I criteria).
It reported Sep '20 quarterly earnings +43% on +27% sales revenues versus the year ago period. Four of the past 5 quarterly comparisons versus the year ago periods showed earnings increases above the +25% minimum guideline (C criteria) with strong underlying sales revenues increases. Its annual earnings (A criteria) history has also been strong, helping it get an 84 Earnings Per Share Rating.
Charts courtesy www.stockcharts.com