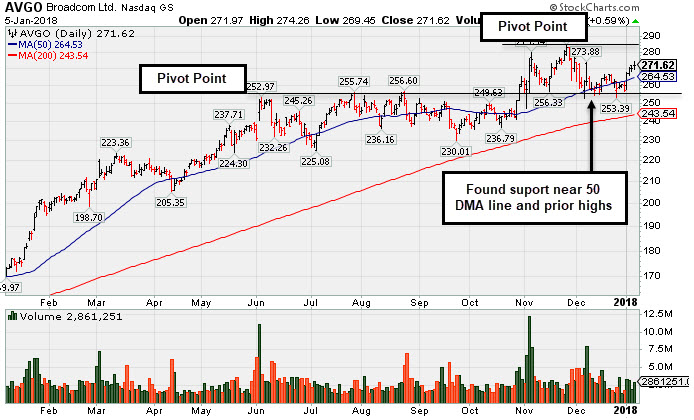
New Pivot Point Cited After Rebound Above 50-Day Moving Average - Friday, January 5, 2018
Broadcom Limited (AVGO +$1.60 or +0.59% to $271.62) rebounded above its 50-day moving average (DMA) line ($264.53 with gains this week helping its outlook improve. A new pivot point is cited based on its 11/27/17 high plus 10 cents. Subsequent volume-driven gains for new highs may trigger a new (or add-on) technical buy signal. Its current Accumulation/Distribution Rating is B+, meanwhile, it has a Timeliness Rating of B and Sponsorship Rating of B.
It made recent bids to acquire Qualcomm Inc (QCOM). Earnings rose +32% on +17% sales revenues for the Oct '17 quarter, its 6th consecutive quarterly earnings increase above the +25% minimum guideline (C criteria). Earnings rose by +29%, +38%, +51%, +46%, and +42%, respectively, in the Jul ,Oct '16, Jan, Apr, and Jul '17 quarterly comparisons versus the year ago periods. Sales revenues rose +119%, +125%, +134%, +18% and +18% during that time span. Its annual earnings (A criteria) history has been strong.
This Singapore-based Electronics - Semiconductor firm was last shown in this FSU section on 12/08/17 under the headline, "Testing Support at Prior Highs and 50-Day Average ". Other leadership in the Semiconductor group has been a reassuring sign concerning the L criteria. The number of top-rated funds owning its shares rose from 2,240 in Mar '17 to 2,387 in Dec '17, a reassuring sign concerning the I criteria. Its current Up//Down Volume ratio of 1.6 is an unbiased indication its shares have been under accumulation over the past 50 days.
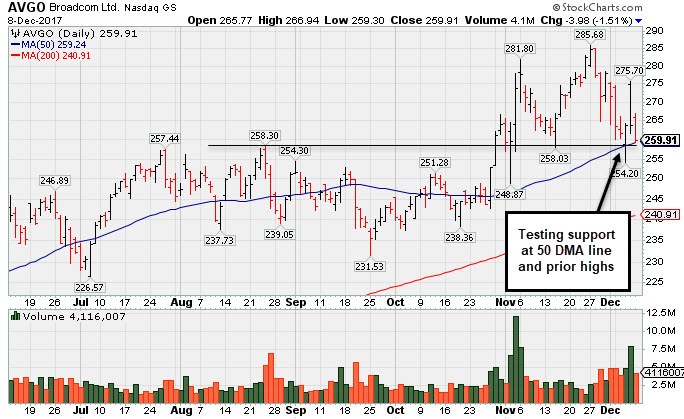
Testing Support at Prior Highs and 50-Day Average - Friday, December 8, 2017
Broadcom Limited (AVGO -$3.98 or -1.51% to $259.91) is testing support near prior highs in the $259 area and its 50-day moving average (DMA) line ($259.91). More damaging losses would raise greater concerns.
Recently it reported earnings +32% on +17% sales revenues for the Oct '17 quarter, its 6th consecutive quarterly earnings increase above the +25% minimum guideline (C criteria). Earnings rose by +29%, +38%, +51%, +46%, and +42%, respectively, in the Jul ,Oct '16, Jan, Apr, and Jul '17 quarterly comparisons versus the year ago periods. Sales revenues rose +119%, +125%, +134%, +18% and +18% during that time span. Its annual earnings (A criteria) history has been strong.
Its current Accumulation/Distribution Rating is C, meanwhile, it has a Timeliness Rating of A and Sponsorship Rating of B. Recently made bids to acquire Qualcomm Inc (QCOM).
This Singapore-based Electronics - Semiconductor firm was last shown in this FSU section on 11/13/17 under the headline, "Consolidating Near Record High Following Volume-Driven Gains ". Other leadership in the Semiconductor group has been a reassuring sign concerning the L criteria. The number of top-rated funds owning its shares rose from 2,095 in Sep '16 to 2,387 in Sep '17, a reassuring sign concerning the I criteria. Its current Up//Down Volume ratio of 1.6 is an unbiased indication its shares have been under accumulation over the past 50 days.
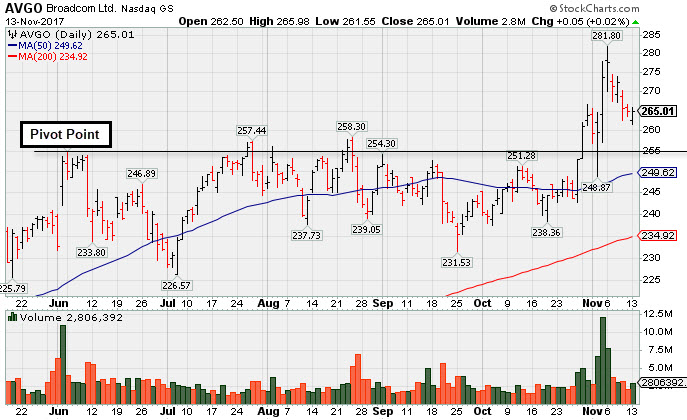
Consolidating Near Record High Following Volume-Driven Gains - Monday, November 13, 2017
Broadcom Limited (AVGO +$0.05 or +0.02% to $265.01) is consolidating above prior highs in the $259 area defining initial support to watch above its 50-day moving average (DMA) line. It pulled back from its all-time high following 11/06/17 news it made a bid for Qualcomm Inc (QCOM).
Its current Accumulation/Distribution Rating is A-, meanwhile, it has a Timeliness Rating of A and Sponsorship Rating of B. The Jul '17 quarter marked its 5th consecutive quarterly earnings increase above the +25% minimum guideline (C criteria). Earnings rose by +29%, +38%, +51%, +46%, and +42%, respectively, in the Jul ,Oct '16, Jan, Apr, and Jul '17 quarterly comparisons versus the year ago periods. Sales revenues rose +119%, +125%, +134%, +18% and +18% during that time span. Its annual earnings (A criteria) history has been strong.
This Singapore-based Electronics - Semiconductor firm held its ground after last shown in this FSU section on 10/17/17 under the headline, "Slumped Below 50-Day Moving Average Line Again". Other leadership in the Semiconductor group has been a reassuring sign concerning the L criteria. The number of top-rated funds owning its shares rose from 2,095 in Sep '16 to 2,383 in Sep '17, a reassuring sign concerning the I criteria. Its current Up//Down Volume ratio of 1.3 is an unbiased indication its shares have been under accumulation over the past 50 days.
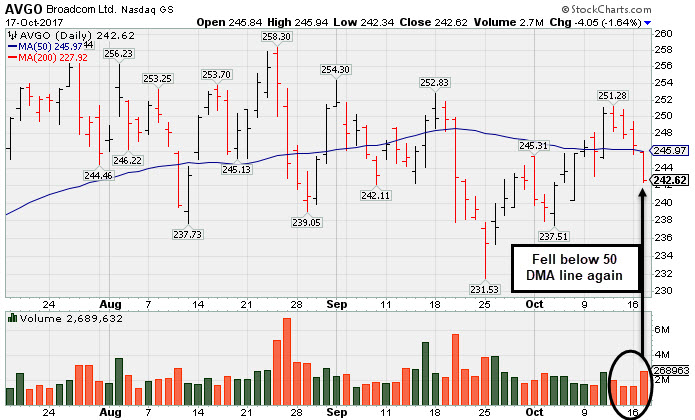
Slumped Below 50-Day Moving Average Line Again - Tuesday, October 17, 2017
Broadcom Limited (AVGO -$4.05 or -1.64% to $242.62) raised greater concerns while slumping with higher (near average) volume today and falling back below its 50-day moving average (DMA) line. It has been enduring distributional pressure, and its color code was changed to green. A convincing rebound above the 50 DMA line would help its outlook improve. The low on 7/26/17 coincides with prior highs in the $227 area, and its 200 DMA line ($229) also defines important near-term support to watch
Its current Accumulation/Distribution Rating is D, meanwhile, it has a Timeliness Rating of B and Sponsorship Rating of B. Note that AVGO failed to produce a technical buy signal after highlighted in yellow with pivot point cited based on its 6/05/17 high plus 10 cents as it was noted in the 8/24/17 mid-day report - "Subsequent volume-driven gains above the pivot and for new highs may trigger a technical buy signal. Prior quarterly and annual earnings history (C and A criteria) is a good match with the fact-based investment system's fundamental guidelines."
The Jul '17 quarter marked its 5th consecutive quarterly earnings increase above the +25% minimum guideline (C criteria). Earnings rose by +29%, +38%, +51%, +46%, and +42%, respectively, in the Jul ,Oct '16, Jan, Apr, and Jul '17 quarterly comparisons versus the year ago periods. Sales revenues rose +119%, +125%, +134%, +18% and +18% during that time span. Its annual earnings (A criteria) history has been strong.
Other leadership in the Semiconductor group has been a reassuring sign concerning the L criteria. This Singapore-based Electronics - Semiconductor firm was last shown in this FSU section on 9/21/17 under the headline, "Technical Deterioration Raises Concerns". The number of top-rated funds owning its shares rose from 2,095 in Sep '16 to 2,345 in Sep '17, a reassuring sign concerning the I criteria. However, its current Up//Down Volume ratio of 0.8 is an unbiased indication its shares have been under distributional pressure over the past 50 days.
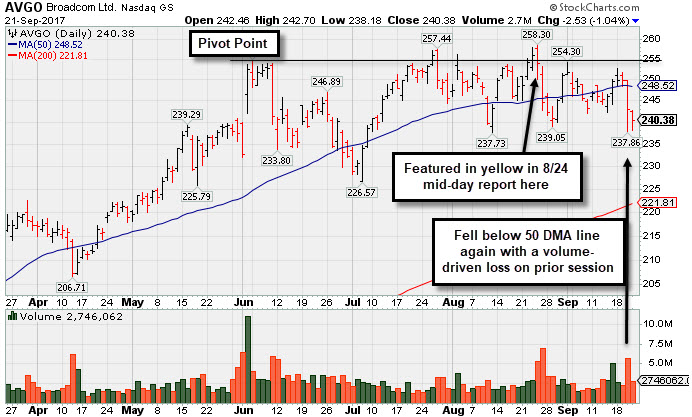
Technical Deterioration Raises Concerns - Thursday, September 21, 2017
Broadcom Limited (AVGO -$2.53 or -1.04% to $240.38) raised greater concerns while slumping further below its 50-day moving average (DMA) line ($249) with today's loss. Recently it has been enduring distributional pressure, and its color code was changed to green. Only a prompt rebound above the 50 DMA line would help its outlook improve. Meanwhile, the low on 7/26/17 coincides with prior highs in the $227 area, defining the next important support level to watch
Weak action came after it reported earnings +42% on +18% sales revenues for the Jul '17 quarter. Volume and volatility often increase near earnings news. Disciplined investors always watch for a proper technical buy signal before taking action. avoid chasing stocks more than +5% above prior highs, and strictly limit losses by selling any stock that falls more than -7% from their purchase price.
Its current Accumulation/Distribution Rating is D, meanwhile, it has a Timeliness Rating of B and Sponsorship Rating of B. Note that AVGO failed to produce a technical buy signal after highlighted in yellow with pivot point cited based on its 6/05/17 high plus 10 cents as it was noted in the 8/24/17 mid-day report - "Subsequent volume-driven gains above the pivot and for new highs may trigger a technical buy signal. Prior quarterly and annual earnings history (C and A criteria) is a good match with the fact-based investment system's fundamental guidelines."
The Jul '17 quarter marked its 5th consecutive quarterly earnings increase above the +25% minimum guideline (C criteria). Earnings rose by +29%, +38%, +51%, +46%, and +42%, respectively, in the Jul ,Oct '16, Jan, Apr, and Jul '17 quarterly comparisons versus the year ago periods. Sales revenues rose +119%, +125%, +134%, +18% and +18% during that time span. Its annual earnings (A criteria) history has been strong.
This Singapore-based Electronics - Semiconductor firm was last shown in this FSU section on 8/25/17 under the headline, "Pullback Followed Latest Strong Earnings Report From Tech Leader". The number of top-rated funds owning its share rose from 2,095 in Sep '16 to 2,292 in Jun '17, a reassuring sign concerning the I criteria. Other leadership in the Semiconductor group has been a reassuring sign concerning the L criteria.
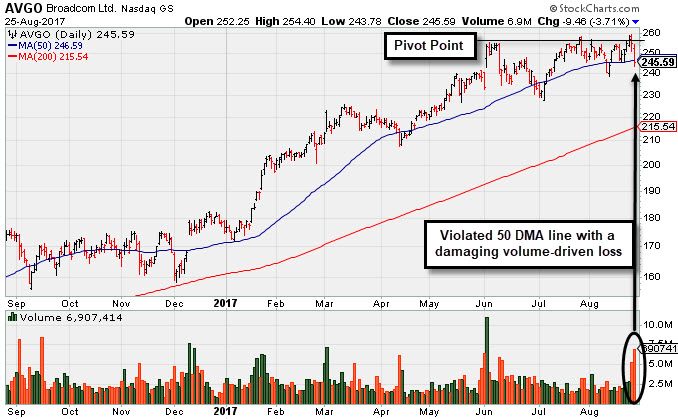
Pullback Followed Latest Strong Earnings Report From Tech Leader - Friday, August 25, 2017
Broadcom Limited (AVGO -$9.46 or -3.71% to $245.59) pulled back with above average volume and violated its 50-day moving average (DMA) line ($246.59) today triggering a technical sell signal. The weak action came after it reported earnings +42% on +18% sales revenues for the Jul '17 quarter. Volume and volatility often increase near earnings news. Disciplined investors always watch for a proper technical buy signal before taking action. avoid chasing stocks more than +5% above prior highs, and strictly limit losses by selling any stock that falls more than -7% from their purchase price.
Note that AVGO failed to produce a technical buy signal after highlighted in yellow with pivot point cited based on its 6/05/17 high plus 10 cents as it was noted in the 8/24/17 mid-day report - "Subsequent volume-driven gains above the pivot and for new highs may trigger a technical buy signal. Prior quarterly and annual earnings history (C and A criteria) is a good match with the fact-based investment system's fundamental guidelines."
The Jul '17 quarter marked its 5th consecutive quarterly earnings increase above the +25% minimum guideline (C criteria). Earnings rose by +29%, +38%, +51%, +46%, and +42% in the Jul ,Oct '16, Jan, Apr, and Jul '17 quarterly comparisons versus the year ago periods. Sales revenues rose +119%, +125%, +134%, +18% and +18% during that time span. Its annual earnings (A criteria) history has been strong.
This Singapore-based Electronics - Semiconductor firm was mentioned in the 5/27/15 commentary (read here) on M&A news, as it combined with Avago Technologies Ltd, which was last shown in this FSU section on 6/18/15 under the headline, "Volume Totals Cooling During Consolidation After Breakout".
The number of top-rated funds owning its share rose from 2,095 in Sep '16 to 2,265 in Jun '17, a reassuring sign concerning the I criteria. Other leadership in the Semiconductor group has been a reassuring sign concerning the L criteria.
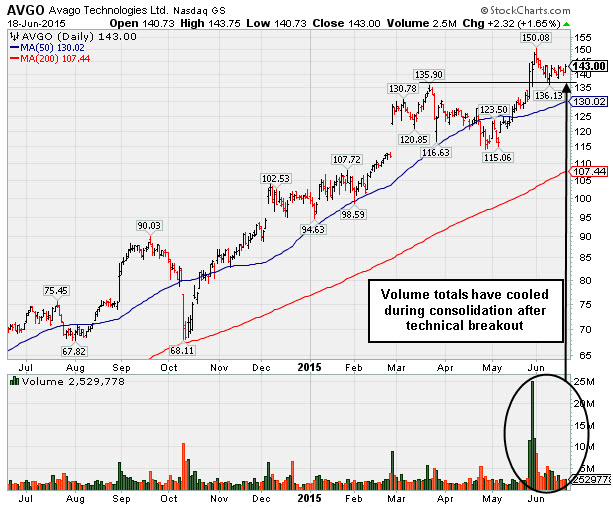
Volume Totals Cooling During Consolidation After Breakout - Thursday, June 18, 2015
Avago Technologies Ltd (AVGO +$2.32 or +1.65% to $143.00) has held its ground and volume totals have been cooling while consolidating above support at prior highs in the $136 area, a reassuring sign that few investors have been headed for the exit. It was last shown in this FSU section on 5/28/15 under the headline, "Strong Sales and Earnings Acceleration For Tech Leader", after highlighted in yellow with pivot point cited based on its 3/23/15 high plus 10 cents in the earlier mid-day report (read here). This Singapore-based Electronics - Semiconductor firm was featured after technically breaking out of a riskier "late stage" base with a considerable volume-driven gain. It announced plans to acquire Broadcom (BRCM) as mentioned in the 5/27/15 commentary (read here).
Its current Up/Down Volume Ratio of 1.4 is an unbiaaed indicatin its shares have been under accumulation over the past 50 days. The number of top-rated funds owning its share rose from 1137 in Jun '14 to 1466 in Mar '15, a reassuring sign concerning the I criteria. Leadership in the Semiconductor group is a reassuring sign concerning the L criteria.
The Apr '15 quarter marked its 6th consecutive quarterly earnings increase above the +25% minimum guideline (C criteria). Earnings rose by +29%, +39%, +70%, +124%, +149%, and +151% in the Jan, Apr, Jul, Oct '14, Jan '15, and Apr '15 quarterly comparisons versus the year ago periods, respectively, showing impressive acceleration. Sales revenues rose +23%, 25%, +97%, +115%, +131%, and +130% during that time span. Its annual earnings (A criteria) history has been strong.
Disciplined investors avoid chasing stocks more than +5% above prior highs, and they always limit losses by selling any stock that falls more than -7% from their purchase price. The graph below shows the volume totals cooling after its technical breakout gain.
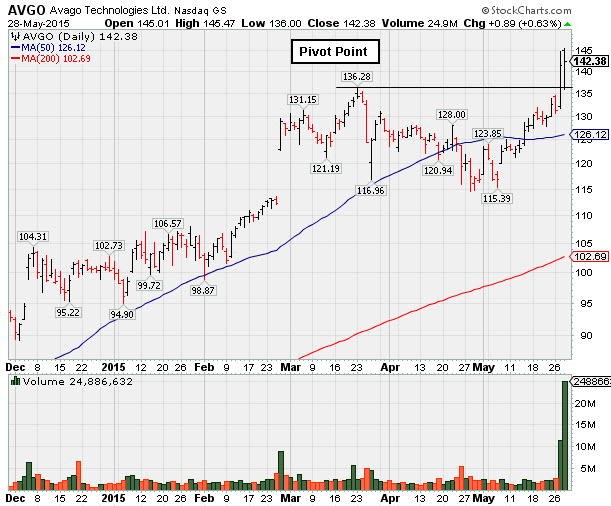
Strong Sales and Earnings Acceleration For Tech Leader - Thursday, May 28, 2015
Avago Technologies Ltd (AVGO +$0.89 or +0.63% to $142.38) was highlighted in yellow with pivot point cited based on its 3/23/15 high plus 10 cents in the earlier mid-day report (read here). This Singapore-based Electronics - Semiconductor firm spiked to a new 52-week high on the prior session, technically breaking out of a riskier "late stage" base with a considerable volume-driven gain. It announced plans to acquire Broadcom (BRCM) as mentioned in the 5/27/15 commentary (read here).
The Apr '15 quarter marked its 6th consecutive quarterly earnings increase above the +25% minimum guideline (C criteria). Earnings rose by +29%, +39%, +70%, +124%, +149%, and +151% in the Jan, Apr, Jul, Oct '14, Jan '15, and Apr '15 quarterly comparisons versus the year ago periods, respectively, showing impressive acceleration. Sales revenues rose +23%, 25%, +97%, +115%, +131%, and +130% during that time span. Its annual earnings (A criteria) history has been strong.
AVGO undercut its 50-day moving average (DMA) line then rebounded since noted in the 3/26/15 mid-day report - "Strong earnings making it a better match with the fact-based investment system, however it did not form a sound base. Patient investors may watch for a new base to possibly develop and be noted in the weeks ahead."
The number of top-rated funds owning its share rose from 1137 in Jun '14 to 1457 in Mar '15, a reassuring sign concerning the I criteria. Leadership in the Semiconductor group is a reassuring sign concerning the L criteria.
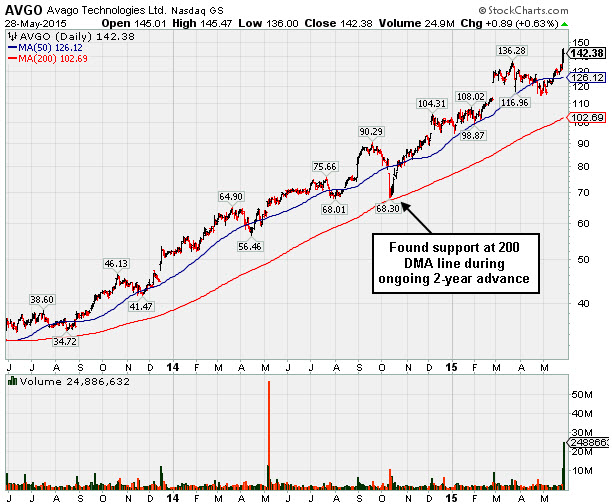
The 6-month graph below shows the huge volume behind its breakout gain and additional gain today. The 2-year graph that follows gives investors a look at the ongoing and considerable rally it has enjoyed, during which time it pulled back and tested support at its longer-term 200 DMA line.
Disciplined investors avoid chasing stocks more than +5% above prior highs, and they always limit losses by selling any stock that falls more than -7% from their purchase price.