You are not logged in.
This means you
CAN ONLY VIEW reports that were published prior to Monday, April 14, 2025.
You
MUST UPGRADE YOUR MEMBERSHIP if you want to see any current reports.
AFTER MARKET UPDATE - THURSDAY, DECEMBER 31ST, 2009
Previous After Market Report Next After Market Report >>>
|
|
|
|
DOW |
-120.46 |
10,428.05 |
-1.14% |
|
Volume |
679,920,340 |
+6% |
|
Volume |
1,275,778,820 |
-4% |
|
NASDAQ |
-22.13 |
2,269.15 |
-0.97% |
|
Advancers |
987 |
32% |
|
Advancers |
1,052 |
36% |
|
S&P 500 |
-11.32 |
1,115.10 |
-1.00% |
|
Decliners |
2,020 |
65% |
|
Decliners |
1,740 |
60% |
|
Russell 2000 |
-8.02 |
625.39 |
-1.27% |
|
52 Wk Highs |
176 |
|
|
52 Wk Highs |
99 |
|
|
S&P 600 |
-4.70 |
332.63 |
-1.39% |
|
52 Wk Lows |
2 |
|
|
52 Wk Lows |
12 |
|
|
 |
First Decade Of New Millennium Ends In Red Despite Big 2009 Gains
Adam Sarhan, Contributing Writer,
The major averages ended lower on the last trading day of the year. Volume, an important indicator of institutional sponsorship, was reported lighter than Wednesday's totals which indicated large institutions were not aggressively buying or selling stocks. Decliners led advancers by a 2-to-1 ratio on the NYSE and by a 3-to-2 ratio on the Nasdaq exchange. There were 24 high-ranked companies from the CANSLIM.net Leaders List that made a new 52-week high and appeared on the CANSLIM.net BreakOuts Page, higher than the total of 18 issues that appeared on the prior session. New 52-week highs solidly outnumbered new 52-week lows on the NYSE and on the Nasdaq exchange.
Economic Data- Weekly Jobless Claims:
At 8:30AM EST, the Labor Department said initial jobless claims fell -28,000 to 452,000 in the week ending December 19. The report topped the Street's 460,000 estimate and supports the notion that the ailing jobs market is improving. Continuing claims fell 127,000 in the week ended December 12 to 5.076 million. Every Thursday, the Labor Department releases the report which compiles data showing the number of individuals who filed for unemployment insurance for the first time. Remember, the report is counter intuitive because an increasing number means more people are filing for unemployment claims and suggests a deteriorating labor market. The converse is also true, lower readings is a sign of strength. Investors tend to look at the four-week moving average because it smoothes out weekly volatility.
Performance Data For The Decade & 2009
2000's Performance Data:
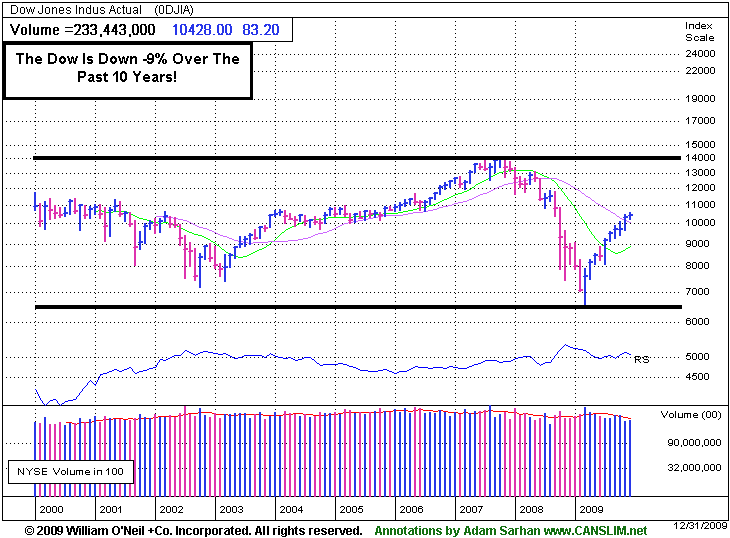
The 2000's will go down in history as a blasé decade for the stock market. Over the past 10 years the major averages are actually down ,which is a historical anomaly. During that period, the tech-heavy Nasdaq Composite Index is the standout loser- shedding a whopping -44% while the benchmark S&P 500 lost -24% and the Dow Industrials gave up -9%.
Multi Decade Consolidation:
Over the past 100 years, there have been multiple times when the stock market spent nearly two decades moving sideways before a new massive multi-decade bull market was born. The first 10 year consolidation occurred between 1906-1916 and was followed by the roaring 20's and then the Great Depression. The next notable consolidation occurred between 1966-1982 (16 years) before the massive bull market of the 1980s and 1990s was born. Are we in the middle of one of those protracted consolidations? Yes, evidenced by the fact that the major averages have been trading in one massive base over the past 10 years.
Emerging markets enjoyed hefty gains over the last decade. Brazil's stock market surged a whopping +301% while China's soared +72%. Other emerging markets enjoyed huge moves during the past 10 years as capital continues to flow into these younger areas as their economies continue to enjoy tremendous growth!
2009 Performance:
For the year, tech-heavy Nasdaq Composite led its peers, surging a whopping +45%. The small cap Russell 2000 index jumped +25%, while the benchmark S&P 500 and Dow Jones Industrial Average rose +24% and +19% respectively this year. Since the March lows, the Russell 2000 vaulted +85% while the Nasdaq composite surged a whopping +81%. The S&P 500 and Dow Industrials rose +70% and +64%, respectively. On a percentage basis, the past nine months have been one of the strongest in history which bodes well for the bulls.
Market Action: Price & Volume
Looking at the market, the action remains constructive. The Dow Jones Industrial Average, small cap Russell 2000 Index, S&P 500 Index and Nasdaq Composite and NYSE Composite indices are all trading just below their respective 2009 highs which bodes well for this rally. The inverse relationship with the US dollar has eased in recent weeks as both stocks and the greenback have rallied in tandem. Ideally, one would like to see leadership and volume expand over the next few weeks as the major averages continue advancing.
PICTURED: The Dow Jones Industrial Average is down -9% over the past decade.
|
|
|
 |
Internet Index Was Strongest Performing Group For 2009
Kenneth J. Gruneisen - Passed the CAN SLIM® Master's Exam
The Gold & Silver Index ($XAU +0.08%) inched higher on Thursday while the majority of groups closed the final session of the decade with modest losses. Financial shares continued to sputter as the Bank Index ($BKX -0.21%) and Broker/Dealer Index ($XBD -0.55%) ended with small losses. The Retail Index ($RLX -1.24%) fell, and the Healthcare Index ($HMO -1.57%) also fell more than -1%. Unanimous losses dragged the tech sector's Internet Index ($IIX -1.04%), Networking Index ($NWX -0.88%), Biotechnology Index ($BTK -0.66%), and Semiconductor Index ($SOX -0.41%) down. Energy-related shares also edged lower as the Integrated Oil Index ($XOI -0.83%) and Oil Services Index ($OSX -0.65%) each fell less than -1%.
Charts courtesy www.stockcharts.com
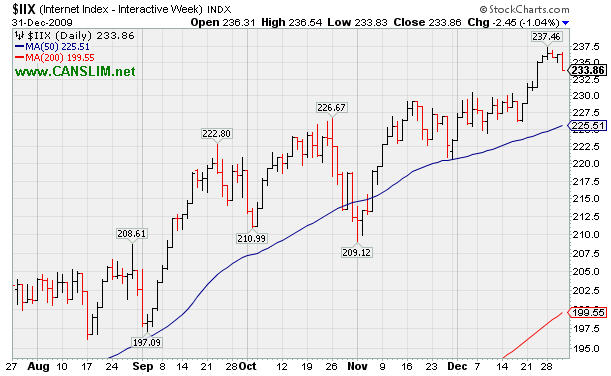
PICTURED: The Internet Index ($IIX -1.04%) was one of the best gainers as it led the groups routinely followed in this Industry Group Watch section with the best gain for 2009.
| Oil Services |
$OSX |
194.92 |
-1.28 |
-0.65% |
+60.57% |
| Healthcare |
$HMO |
1,472.94 |
-23.48 |
-1.57% |
+53.40% |
| Integrated Oil |
$XOI |
1,068.21 |
-8.99 |
-0.83% |
+9.04% |
| Semiconductor |
$SOX |
359.91 |
-1.48 |
-0.41% |
+69.63% |
| Networking |
$NWX |
231.06 |
-2.05 |
-0.88% |
+60.58% |
| Internet |
$IIX |
233.86 |
-2.45 |
-1.04% |
+74.82% |
| Broker/Dealer |
$XBD |
115.04 |
-0.64 |
-0.55% |
+48.50% |
| Retail |
$RLX |
411.12 |
-5.15 |
-1.24% |
+47.22% |
| Gold & Silver |
$XAU |
168.25 |
+0.13 |
+0.08% |
+35.85% |
| Bank |
$BKX |
42.71 |
-0.09 |
-0.21% |
-3.63% |
| Biotech |
$BTK |
942.13 |
-6.25 |
-0.66% |
+45.58% |
|
|
|
 |
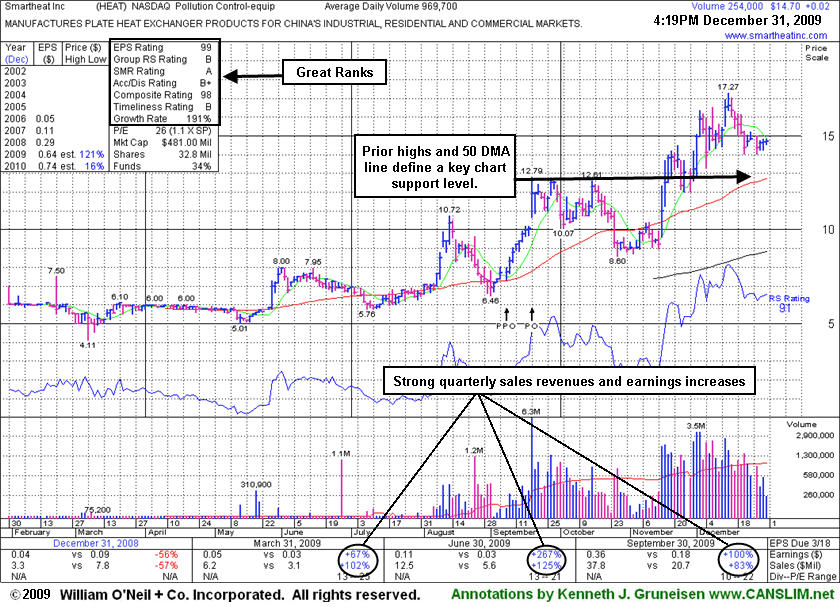
Consolidation Continues Well Above Support
Kenneth J. Gruneisen - Passed the CAN SLIM® Master's Exam
Smartheat Inc (HEAT -$0.16 or -1.09% to $14.52) is consolidating well above prior chart highs and its 50-day moving average (DMA) line coinciding in the $12.60 area as important support levels. The investment system rules say a stock should be held a minimum of 8 weeks after rising more than +20% in the first 2-3 weeks from being bought. HEAT traded as much as +43.9% higher since first featured in yellow in the 11/17/09 mid-day report (read here) when technically rising from a "double bottom" base, reaching a new all-time high.
The number of top-rated funds owning an interest in its shares rose from 3 in Jun '09 to 27 in Sept '09, which is reassuring concerning the I criteria. The 3 latest quarters show sales revenues and earnings increases well above the +25% guideline, satisfying the C criteria. There is limited history for this small Chinese firm in the Pollution Control - Equipment group, however its reported annual earnings (A criteria) history has been strong.
|
|
|
Color Codes Explained :
Y - Better candidates highlighted by our
staff of experts.
G - Previously featured
in past reports as yellow but may no longer be buyable under the
guidelines.
***Last / Change / Volume quote data in this table corresponds with the timestamp on the note***
Symbol/Exchange
Company Name
Industry Group |
Last |
Chg. |
Vol
% DAV |
Date Featured |
Price Featured |
Latest Pivot Point
Featured |
Status |
| Latest Max Buy Price |
ARST
-
|
$25.58
|
-0.22
|
183,980
38% DAV
486,700
|
9/1/2009
(Date
Featured) |
$19.91
(Price
Featured) |
PP = $27.20 |
Y |
| MB = $28.56 |
Most Recent Note - 12/31/2009 4:33:03 PM
Y - Quietly hovering near all-time highs, it is on the right side of a near 8 week base. Color code was changed to yellow with new pivot point and max buy levels noted. ARST was first featured in yellow at $19.91 in the 9/01/09 mid-day report with an annotated daily graph (read here).
>>> The latest Featured Stock Update with an annotated graph appeared on 12/16/2009. click here.
|
|
C
A
S
I |
News |
Chart |
SEC
View all notes Alert
me of new notes
Company
Profile
|
ASIA
-
|
$30.45
|
-0.63
|
355,899
28% DAV
1,271,800
|
12/24/2009
(Date
Featured) |
$31.05
(Price
Featured) |
PP = $32.40 |
Y |
| MB = $34.02 |
Most Recent Note - 12/31/2009 4:51:29 PM
Y - Perched near all-time highs with volume drying up. It has formed an advanced "3 weeks tight" type pattern, and color code was changed to yellow. A subsequent breakout with heavy volume is needed to confirm a new technical buy signal. Traded up as much as +68.13% since first featured in the August 2009 CANSLIM.net News (read here).
>>> The latest Featured Stock Update with an annotated graph appeared on 12/23/2009. click here.
|
|
C
A
S
I |
News |
Chart |
SEC
View all notes Alert
me of new notes
Company
Profile
|
BIDU
- NASDAQ
Baidu Inc Ads
INTERNET - Internet Information Providers
|
$411.23
|
-5.00
|
669,900
38% DAV
1,777,300
|
9/8/2009
(Date
Featured) |
$351.80
(Price
Featured) |
PP = $440.00 |
Y |
| MB = $462.00 |
Most Recent Note - 12/31/2009 4:54:20 PM
Y - Losses on light volume this week led to deterioration back below its 50 DMA line. Technically, it has built a sloppy base over the past 10 weeks, and gains above its previously cited pivot point with at least +50% above average volume could trigger a new buy signal. BIDU traded up as much as +23% from its price when featured in yellow in the 9/08/09 Mid-Day BreakOuts Report (read here).
>>> The latest Featured Stock Update with an annotated graph appeared on 12/21/2009. click here.
|
|
C
A
S
I |
News |
Chart |
SEC
View all notes Alert
me of new notes
Company
Profile
|
CAAS
- NASDAQ
China Automotive Systems
AUTOMOTIVE - Auto Parts
|
$18.71
|
-0.48
|
439,190
58% DAV
759,700
|
11/30/2009
(Date
Featured) |
$18.84
(Price
Featured) |
PP = $17.62 |
G |
| MB = $18.50 |
Most Recent Note - 12/31/2009 5:01:28 PM
G - Down on light volume today while continuing its choppy consolidation for the past 5 weeks. It found prompt support following a sharp pullback to its short-term average line. The Chinese maker of power steering systems had negated most of its bullish action since featured in the 11/30/09 mid-day report (read here).
>>> The latest Featured Stock Update with an annotated graph appeared on 12/29/2009. click here.
|
|
C
A
S
I |
News |
Chart |
SEC
View all notes Alert
me of new notes
Company
Profile
|
CACC
- NASDAQ
Credit Acceptance Corp
FINANCIAL SERVICES - Credit Services
|
$42.10
|
-0.03
|
41,016
101% DAV
40,600
|
9/29/2009
(Date
Featured) |
$33.48
(Price
Featured) |
PP = $37.10 |
G |
| MB = $38.96 |
Most Recent Note - 12/31/2009 5:02:54 PM
G - Down for a 3rd consecutive session today, consolidating from all-time highs after getting extended from its prior base. Previous chart highs near $35-37 are an important support level to watch. The Finance - Consumer/Commercial Loans firm has maintained a great track record of annual and quarterly sales revenues and earnings increases. It was featured on 9/29/09 in yellow in the mid-day report (read here).
>>> The latest Featured Stock Update with an annotated graph appeared on 12/22/2009. click here.
|
|
C
A
S
I |
News |
Chart |
SEC
View all notes Alert
me of new notes
Company
Profile
|
CRM
- NYSE
Salesforce.com Inc
INTERNET - Internet Software & Services
|
$73.77
|
-0.25
|
1,359,037
79% DAV
1,719,300
|
12/18/2009
(Date
Featured) |
$67.32
(Price
Featured) |
PP = $67.82 |
G |
| MB = $71.21 |
Most Recent Note - 12/31/2009 5:05:30 PM
G - Holding its ground after a recent streak of 7 consecutive gains lifted it near its $75 all-time high from June 2008. It is now extended from its prior base after rising from a 5-week flat base above important support at its 50 DMA line. Its 12/18/09 gain with more than +50% above average volume triggered a technical buy signal.
>>> The latest Featured Stock Update with an annotated graph appeared on 12/18/2009. click here.
|
|
C
A
S
I |
News |
Chart |
SEC
View all notes Alert
me of new notes
Company
Profile
|
CTRP
- NASDAQ
Ctrip.com Intl Ltd Adr
LEISURE - Resorts & Casinos
|
$71.86
|
-1.16
|
619,636
56% DAV
1,105,200
|
12/1/2009
(Date
Featured) |
$75.38
(Price
Featured) |
PP = $73.91 |
G |
| MB = $77.61 |
Most Recent Note - 12/31/2009 5:07:50 PM
G - Quietly consolidating above its 50 DMA line, but its recent slump under its pivot point raised concerns. Featured on 12/01/09 in yellow in the mid-day report (read here). Fundamentally, its sales revenues and earnings increases have shown acceleration in the 3 most recent quarterly comparisons and rose above the +25% guideline. Based on weak technical action it was dropped from the Featured Stocks list on 6/10/08, when it closed at $49.84, yet it has rebounded very impressively from subsequent lows in the $16 area.
>>> The latest Featured Stock Update with an annotated graph appeared on 12/30/2009. click here.
|
|
C
A
S
I |
News |
Chart |
SEC
View all notes Alert
me of new notes
Company
Profile
|
GMCR
- NASDAQ
Green Mtn Coffee Roastrs
FOOD & BEVERAGE - Processed & Packaged Goods
|
$81.47
|
+1.47
|
1,904,180
124% DAV
1,538,800
|
12/28/2009
(Date
Featured) |
$77.49
(Price
Featured) |
PP = $76.50 |
G |
| MB = $80.33 |
Most Recent Note - 12/31/2009 5:12:29 PM
G - Hit another new all-time high today above its "max buy" level with its 7th consecutive gain, and its color code was changed to green. Considerable gain on 12/28/09 prompted its re-appearance in yellow in the mid-day report (read here) as it rose above the pivot point of a 10-week "double bottom" type base on +62% above average volume, confirming a new technical buy signal. Based on weak action it was dropped from the Featured Stocks list on 12/01/09. Its 12/18/09 gain on heavy volume repaired its prior 50 DMA line violation, helping its outlook improve.
>>> The latest Featured Stock Update with an annotated graph appeared on 12/28/2009. click here.
|
|
C
A
S
I |
News |
Chart |
SEC
View all notes Alert
me of new notes
Company
Profile
|
HEAT
-
|
$14.52
|
-0.16
|
303,637
31% DAV
969,700
|
11/17/2009
(Date
Featured) |
$12.00
(Price
Featured) |
PP = $12.61 |
G |
| MB = $13.24 |
Most Recent Note - 12/31/2009 5:37:03 PM
G - Consolidating well above prior chart highs and its 50 DMA line coinciding in the $12.60 area as important support levels. The investment system rules say a stock should be held a minimum of 8 weeks after rising more than +20% in the first 2-3 weeks from being bought. HEAT traded as much as +43.9% higher since first featured in yellow in the 11/17/09 mid-day report (read here) when technically rising from a "double bottom" base, reaching a new all-time high.
>>> The latest Featured Stock Update with an annotated graph appeared on 12/31/2009. click here.
|
|
C
A
S
I |
News |
Chart |
SEC
View all notes Alert
me of new notes
Company
Profile
|
LFT
-
|
$37.02
|
-0.56
|
158,612
39% DAV
407,300
|
11/17/2009
(Date
Featured) |
$31.77
(Price
Featured) |
PP = $33.04 |
G |
| MB = $34.69 |
Most Recent Note - 12/31/2009 5:38:45 PM
G - Hovering near all-time highs with a 3rd consecutive loss on light volume. Extended from a sound buy point now after recently rising from a choppy 14-week base. Its 50 DMA line and prior chart highs are an initial support levels to watch. A proposed offering of additional shares on 11/16/09 seems well received by the market. Its fundamentals remain strong.
>>> The latest Featured Stock Update with an annotated graph appeared on 12/17/2009. click here.
|
|
C
A
S
I |
News |
Chart |
SEC
View all notes Alert
me of new notes
Company
Profile
|
VIT
-
|
$19.21
|
-0.17
|
169,301
34% DAV
500,500
|
12/24/2009
(Date
Featured) |
$20.07
(Price
Featured) |
PP = $21.17 |
Y |
| MB = $22.23 |
Most Recent Note - 12/31/2009 5:41:44 PM
Y - Pulled back this week after approaching all-time highs while working on the right side of a choppy 11-week base. Featured in yellow in the 12/24/09 mid-day report (read here). No overhead supply exists to act as resistance, however it did not yet rise above the pivot point cited with the volume needed to trigger a proper new technical buy signal, so patience and disciplined are needed. Following its steep ascent from its March low ($4.31), an additional public offering of shares on 7/10/09 coincided with a successful earlier test of 50 DMA support. Fundamentally, this high-ranked Computer - Tech Services firm's earnings and sales revenues increases have been above or at the +25% minimum guideline.
>>> The latest Featured Stock Update with an annotated graph appeared on 12/24/2009. click here.
|
|
C
A
S
I |
News |
Chart |
SEC
View all notes Alert
me of new notes
Company
Profile
|
|
|
|
THESE ARE NOT BUY RECOMMENDATIONS!
Comments contained in the body of this report are technical
opinions only. The material herein has been obtained
from sources believed to be reliable and accurate, however,
its accuracy and completeness cannot be guaranteed.
This site is not an investment advisor, hence it does
not endorse or recommend any securities or other investments.
Any recommendation contained in this report may not
be suitable for all investors and it is not to be deemed
an offer or solicitation on our part with respect to
the purchase or sale of any securities. All trademarks,
service marks and trade names appearing in this report
are the property of their respective owners, and are
likewise used for identification purposes only.
This report is a service available
only to active Paid Premium Members.
You may opt-out of receiving report notifications
at any time. Questions or comments may be submitted
by writing to Premium Membership Services 665 S.E. 10 Street, Suite 201 Deerfield Beach, FL 33441-5634 or by calling 1-800-965-8307
or 954-785-1121.
|
|
|


