You are not logged in.
This means you
CAN ONLY VIEW reports that were published prior to Monday, April 14, 2025.
You
MUST UPGRADE YOUR MEMBERSHIP if you want to see any current reports.
AFTER MARKET UPDATE - MONDAY, JANUARY 4TH, 2010
Previous After Market Report Next After Market Report >>>
|
|
|
|
DOW |
+155.91 |
10,583.96 |
+1.50% |
|
Volume |
1,014,752,220 |
+49% |
|
Volume |
1,998,105,020 |
+57% |
|
NASDAQ |
+39.27 |
2,308.42 |
+1.73% |
|
Advancers |
2,466 |
78% |
|
Advancers |
2,143 |
75% |
|
S&P 500 |
+17.89 |
1,132.99 |
+1.60% |
|
Decliners |
600 |
19% |
|
Decliners |
630 |
22% |
|
Russell 2000 |
+14.71 |
640.10 |
+2.35% |
|
52 Wk Highs |
322 |
|
|
52 Wk Highs |
217 |
|
|
S&P 600 |
+7.01 |
339.64 |
+2.11% |
|
52 Wk Lows |
1 |
|
|
52 Wk Lows |
5 |
|
|
 |
New Year Brings Gains With Positive Breadth And Higher Volume
Adam Sarhan, Contributing Writer,
The major averages rallied on the first trading day of 2010 as the US dollar fell and healthy economic data was released from the US and China. As expected, volume, an important indicator of institutional sponsorship, was reported higher than Thursday's pre-holiday totals which indicated large institutions were more aggressively buying stocks. Advancers trumped decliners by a 4-to-1 ratio on the NYSE and by over a 3-to-1 ratio on the Nasdaq exchange. There were 63 high-ranked companies from the CANSLIM.net Leaders List that made a new 52-week high and appeared on the CANSLIM.net BreakOuts Page, higher than the total of 24 issues that appeared on the prior session. New 52-week highs solidly outnumbered new 52-week lows on the NYSE and on the Nasdaq exchange, while new lows were back in the single digits on each exchange.
Overnight, stronger than expected manufacturing data was released from China which sparked a broad based rally in overseas markets. Manufacturing in China grew by the strongest level since April 2004 and helped allay concerns that the global economic recovery was waning. It is important to note that China was one of the first countries to recover from the first global recession since World War II. The buying continued in the US when the Institute for Supply Management’s (ISM) factory gauge rose to 55.9. The report topped estimates and was the highest level in more than three years, which suggests the US manufacturing sector is definitely in recovery mode.
The US dollar fell on Monday which sent a slew of dollar denominated assets higher. Crude oil rose for an eighth consecutive day. Gold jumped above its 50-day moving average (DMA) line. Orange-juice futures hit limit-up (the most allowed in one session) amid below average temperatures in the US, and copper vaulted to a 16-month high after a strike at a mine in Chile threatened to curb supply. Temperatures across much of the US are colder than normal as a cold front moves through the South.
Market Action: Price & Volume
Looking at the market, the action remains very healthy. The major averages appear set to continue advancing as this rally begins its 44th week (since the March 12, 2009 follow-through day). In addition, most bull markets last for approximately 36 months, so the fact that we are beginning the rally's 10th month suggests there is more room to go higher. The Dow Jones Industrial Average, small cap Russell 2000 Index, S&P 500 Index and Nasdaq Composite and NYSE Composite indices are all trading near their respective 2009 highs which bodes well for the rally. New highs swelling is a sign that leadership is beginning to expand, which is another welcome sign. Ideally, new highs will continue to be plentiful in the coming weeks, providing the important fuel needed to help the major averages continue advancing.
PICTURED: The Dow Jones Industrial Average closed above resistance with a triple digit gain on Monday, which was a very healthy sign.
|
|
|
 |
Broad Based Gains In Defensive, Technology, and Finanical Sectors
Kenneth J. Gruneisen - Passed the CAN SLIM® Master's Exam
Defensive groups were among the best gainers on the first session of 2010 as the Gold & Silver Index ($XAU +3.43%), Oil Services Index ($OSX +3.87%), Integrated Oil Index ($XOI +3.02%), and Healthcare Index ($HMO +3.42%) each posted better than +3% gains. Tech sector gains were led by the Networking Index ($NWX +2.32%) and Semiconductor Index ($SOX +1.71%), followed by the Internet Index ($IIX +1.31%) and Biotechnology Index ($BTK +1.38%). The Retail Index ($RLX -0.00%) was unchanged. One of the encouraging underpinnings during Monday's rally was the financial group, with a gain from the Bank Index ($BKX +2.27%) helping it close above its 50-day moving average (DMA) line.
Charts courtesy www.stockcharts.com
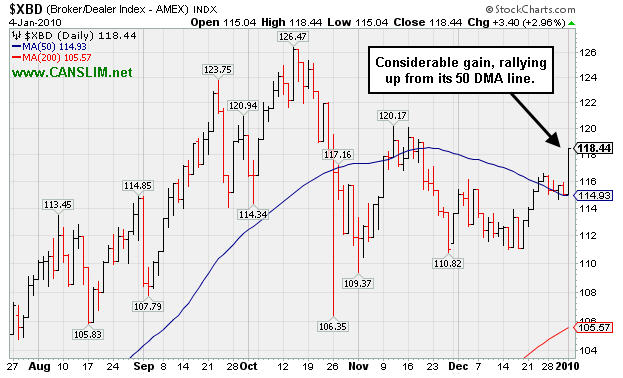
PICTURED: The Broker/Dealer Index ($XBD +2.96%) posted a solid gain, rallying up from its 50-day moving average (DMA) line.
| Oil Services |
$OSX |
202.47 |
+7.55 |
+3.87% |
+3.87% |
| Healthcare |
$HMO |
1,523.30 |
+50.36 |
+3.42% |
+3.42% |
| Integrated Oil |
$XOI |
1,100.51 |
+32.30 |
+3.02% |
+3.02% |
| Semiconductor |
$SOX |
366.08 |
+6.17 |
+1.71% |
+1.71% |
| Networking |
$NWX |
236.42 |
+5.36 |
+2.32% |
+2.32% |
| Internet |
$IIX |
236.92 |
+3.06 |
+1.31% |
+1.31% |
| Broker/Dealer |
$XBD |
118.44 |
+3.40 |
+2.96% |
+2.95% |
| Retail |
$RLX |
411.11 |
-0.01 |
-0.00% |
-0.00% |
| Gold & Silver |
$XAU |
174.02 |
+5.77 |
+3.43% |
+3.43% |
| Bank |
$BKX |
43.68 |
+0.97 |
+2.27% |
+2.27% |
| Biotech |
$BTK |
955.15 |
+13.02 |
+1.38% |
+1.38% |
|
|
|
 |
Breakout With Triple Average Volume Triggers Fresh Buy Signal
Kenneth J. Gruneisen - Passed the CAN SLIM® Master's Exam
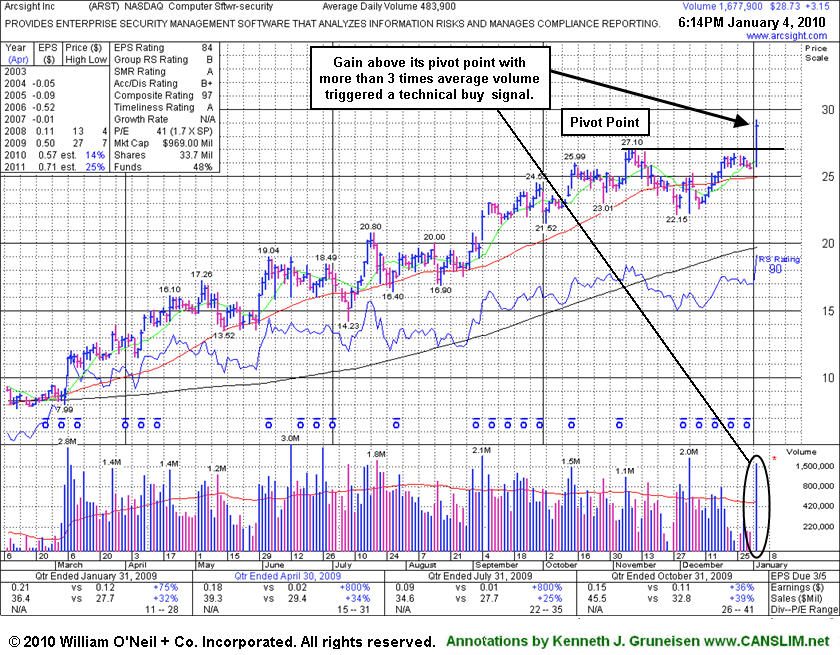
ArcSight, Inc. (ARST +$3.15 or +12.31% to $28.73) gapped up today and triggered a technical buy signal as it blasted above its latest pivot point. It quickly rallied on above its "max buy" level to new all-time highs with volume on the session more than 3 times average behind its considerable gain. Its color code was changed to green as it soon got extended from its latest 8 week base. Its recent rebound above its 50-day moving average (DMA) line was noted as it helped its outlook improve. Patience had allowed for it to form a sufficient new bullish base pattern, however the consolidation on the right side did not constitute a proper downward sloping "handle" for an ideal cup-with-handle pattern. Normally stocks are expected to correct by about -10-15% as the handle forms. Its powerful breakout on volume was an undeniable sign of institutional buying demand, nonetheless, even without a more recent shakeout. Prior chart highs in the $27 area are now an important support level, while any technical deterioration back into its latest base would raise concerns.
While ARST was considered a "late-stage" breakout possibility when first featured, it continued putting up solid sales revenues and earnings results since first featured in yellow at $19.91 in the 9/01/09 mid-day report with an annotated daily graph (read here).
|
|
|
Color Codes Explained :
Y - Better candidates highlighted by our
staff of experts.
G - Previously featured
in past reports as yellow but may no longer be buyable under the
guidelines.
***Last / Change / Volume quote data in this table corresponds with the timestamp on the note***
Symbol/Exchange
Company Name
Industry Group |
Last |
Chg. |
Vol
% DAV |
Date Featured |
Price Featured |
Latest Pivot Point
Featured |
Status |
| Latest Max Buy Price |
ARST
-
|
$28.73
|
+3.15
|
1,684,406
348% DAV
483,900
|
9/1/2009
(Date
Featured) |
$19.91
(Price
Featured) |
PP = $27.20 |
G |
| MB = $28.56 |
Most Recent Note - 1/4/2010 5:46:25 PM
G - Gapped up today and triggered a technical buy signal as it blasted above its pivot point and "max buy" levels to new all-time highs with volume more than 3 times average behind its considerable gain. Color code is changed to green as it quickly gets extended from its latest 8 week base. ARST was first featured in yellow at $19.91 in the 9/01/09 mid-day report with an annotated daily graph (read here).
>>> The latest Featured Stock Update with an annotated graph appeared on 1/4/2010. click here.
|
|
C
A
S
I |
News |
Chart |
SEC
View all notes Alert
me of new notes
Company
Profile
|
ASIA
-
|
$31.39
|
+0.94
|
848,423
67% DAV
1,258,600
|
12/24/2009
(Date
Featured) |
$31.05
(Price
Featured) |
PP = $32.40 |
Y |
| MB = $34.02 |
Most Recent Note - 1/4/2010 5:49:23 PM
Y - Gain today for its second best close. Perched near all-time highs with volume drying up while consolidating in a very tight trading range for the past 4 weeks. A subsequent breakout with heavy volume is needed to confirm a new technical buy signal. Traded up as much as +68.13% since first featured in the August 2009 CANSLIM.net News (read here).
>>> The latest Featured Stock Update with an annotated graph appeared on 12/23/2009. click here.
|
|
C
A
S
I |
News |
Chart |
SEC
View all notes Alert
me of new notes
Company
Profile
|
BIDU
- NASDAQ
Baidu Inc Ads
INTERNET - Internet Information Providers
|
$410.03
|
-1.20
|
1,324,427
76% DAV
1,752,600
|
9/8/2009
(Date
Featured) |
$351.80
(Price
Featured) |
PP = $440.00 |
Y |
| MB = $462.00 |
Most Recent Note - 1/4/2010 5:51:07 PM
Y - Loss today with below average volume while edging further below its 50 DMA line. Technically, it has built a sloppy base over the past 10 weeks, and gains above its previously cited pivot point with at least +50% above average volume could trigger a new buy signal. BIDU traded up as much as +23% from its price when featured in yellow in the 9/08/09 Mid-Day BreakOuts Report (read here).
>>> The latest Featured Stock Update with an annotated graph appeared on 12/21/2009. click here.
|
|
C
A
S
I |
News |
Chart |
SEC
View all notes Alert
me of new notes
Company
Profile
|
CAAS
- NASDAQ
China Automotive Systems
AUTOMOTIVE - Auto Parts
|
$20.85
|
+2.14
|
1,856,170
246% DAV
753,900
|
11/30/2009
(Date
Featured) |
$18.84
(Price
Featured) |
PP = $17.62 |
G |
| MB = $18.50 |
Most Recent Note - 1/4/2010 5:53:23 PM
G - Considerable gain today with more than twice average volume, ending the session near prior all-time high closes after a choppy consolidation for the past 5 weeks. It found prompt support following a sharp pullback to its short-term average line. The Chinese maker of power steering systems had negated most of its bullish action since featured in the 11/30/09 mid-day report (read here).
>>> The latest Featured Stock Update with an annotated graph appeared on 12/29/2009. click here.
|
|
C
A
S
I |
News |
Chart |
SEC
View all notes Alert
me of new notes
Company
Profile
|
CACC
- NASDAQ
Credit Acceptance Corp
FINANCIAL SERVICES - Credit Services
|
$43.84
|
+1.74
|
62,597
153% DAV
41,000
|
9/29/2009
(Date
Featured) |
$33.48
(Price
Featured) |
PP = $37.10 |
G |
| MB = $38.96 |
Most Recent Note - 1/4/2010 5:54:55 PM
G - Gapped up today and tallied a solid gain with above average volume for a new high close. Trading near all-time highs, it is extended from its prior base. Previous chart highs near $35-37 are an important support level to watch. The Finance - Consumer/Commercial Loans firm has maintained a great track record of annual and quarterly sales revenues and earnings increases. It was featured on 9/29/09 in yellow in the mid-day report (read here).
>>> The latest Featured Stock Update with an annotated graph appeared on 12/22/2009. click here.
|
|
C
A
S
I |
News |
Chart |
SEC
View all notes Alert
me of new notes
Company
Profile
|
CRM
- NYSE
Salesforce.com Inc
INTERNET - Internet Software & Services
|
$74.82
|
+1.05
|
1,976,460
114% DAV
1,727,400
|
12/18/2009
(Date
Featured) |
$67.32
(Price
Featured) |
PP = $67.82 |
G |
| MB = $71.21 |
Most Recent Note - 1/4/2010 5:57:28 PM
G - Small gain today with average volume for a new high close, leaving it perched near its $75 all-time high from June 2008. It is now extended from its prior base after rising from a 5-week flat base above important support at its 50 DMA line. Its 12/18/09 gain with more than +50% above average volume triggered a technical buy signal.
>>> The latest Featured Stock Update with an annotated graph appeared on 12/18/2009. click here.
|
|
C
A
S
I |
News |
Chart |
SEC
View all notes Alert
me of new notes
Company
Profile
|
CTRP
- NASDAQ
Ctrip.com Intl Ltd Adr
LEISURE - Resorts & Casinos
|
$72.50
|
+0.64
|
831,272
76% DAV
1,098,600
|
12/1/2009
(Date
Featured) |
$75.38
(Price
Featured) |
PP = $73.91 |
G |
| MB = $77.61 |
Most Recent Note - 1/4/2010 6:01:43 PM
G - Consolidating in a tight trading range above its 50 DMA line for about 5 weeks. Its recent slump under its pivot point raised concerns. Featured on 12/01/09 in yellow in the mid-day report (read here). Fundamentally, its sales revenues and earnings increases have shown acceleration in the 3 most recent quarterly comparisons and rose above the +25% guideline. Based on weak technical action it was dropped from the Featured Stocks list on 6/10/08, when it closed at $49.84, yet it has rebounded very impressively from subsequent lows in the $16 area.
>>> The latest Featured Stock Update with an annotated graph appeared on 12/30/2009. click here.
|
|
C
A
S
I |
News |
Chart |
SEC
View all notes Alert
me of new notes
Company
Profile
|
GMCR
- NASDAQ
Green Mtn Coffee Roastrs
FOOD & BEVERAGE - Processed & Packaged Goods
|
$81.30
|
-0.17
|
1,584,715
103% DAV
1,541,900
|
12/28/2009
(Date
Featured) |
$77.49
(Price
Featured) |
PP = $76.50 |
G |
| MB = $80.33 |
Most Recent Note - 1/4/2010 6:03:36 PM
G - Held its ground today near all-time highs just above its "max buy" level. Considerable gain on 12/28/09 prompted its re-appearance in yellow in the mid-day report (read here) as it rose above the pivot point of a 10-week "double bottom" type base on +62% above average volume, confirming a new technical buy signal. Based on weak action it was dropped from the Featured Stocks list on 12/01/09. Its 12/18/09 gain on heavy volume repaired its prior 50 DMA line violation, helping its outlook improve.
>>> The latest Featured Stock Update with an annotated graph appeared on 12/28/2009. click here.
|
|
C
A
S
I |
News |
Chart |
SEC
View all notes Alert
me of new notes
Company
Profile
|
HEAT
-
|
$15.86
|
+1.34
|
1,234,675
127% DAV
970,000
|
11/17/2009
(Date
Featured) |
$12.00
(Price
Featured) |
PP = $12.61 |
G |
| MB = $13.24 |
Most Recent Note - 1/4/2010 6:05:43 PM
G - Gapped up today and tallied a considerable gain with slightly above average volume. Recently consolidating well above prior chart highs and its 50 DMA line coinciding in the $12.60 area as important support levels. The investment system rules say a stock should be held a minimum of 8 weeks after rising more than +20% in the first 2-3 weeks from being bought. HEAT traded as much as +43.9% higher since first featured in yellow in the 11/17/09 mid-day report (read here) when technically rising from a "double bottom" base, reaching a new all-time high.
>>> The latest Featured Stock Update with an annotated graph appeared on 12/31/2009. click here.
|
|
C
A
S
I |
News |
Chart |
SEC
View all notes Alert
me of new notes
Company
Profile
|
LFT
-
|
$39.89
|
+2.87
|
583,345
147% DAV
396,000
|
11/17/2009
(Date
Featured) |
$31.77
(Price
Featured) |
PP = $33.04 |
G |
| MB = $34.69 |
Most Recent Note - 1/4/2010 6:07:34 PM
G - Considerable gain today with slightly above average volume for a new all-time high. Extended from a sound buy point now after recently rising from a choppy 14-week base. Its 50 DMA line and prior chart highs are initial support levels to watch. A proposed offering of additional shares on 11/16/09 seems well received by the market. Its fundamentals remain strong.
>>> The latest Featured Stock Update with an annotated graph appeared on 12/17/2009. click here.
|
|
C
A
S
I |
News |
Chart |
SEC
View all notes Alert
me of new notes
Company
Profile
|
PEGA
- NASDAQ
Pegasystems Inc
COMPUTER SOFTWARE & SERVICES - Business Software & Services
|
$34.95
|
+0.95
|
111,889
44% DAV
256,300
|
1/4/2010
(Date
Featured) |
$34.00
(Price
Featured) |
PP = $36.19 |
Y |
| MB = $38.00 |
Most Recent Note - 1/4/2010 6:10:25 PM
Y -Gain today on light volume, perched near all-time highs with no overhead supply remaining to act as resistance. Returned to the Featured Stocks page again with its fresh appearance in the new January 2010 issue of CANSLIM.net News (read here).
>>> The latest Featured Stock Update with an annotated graph appeared on 1/3/2010. click here.
|
|
C
A
S
I |
News |
Chart |
SEC
View all notes Alert
me of new notes
Company
Profile
|
VIT
-
|
$19.99
|
+0.78
|
777,275
158% DAV
491,900
|
12/24/2009
(Date
Featured) |
$20.07
(Price
Featured) |
PP = $21.17 |
Y |
| MB = $22.23 |
Most Recent Note - 1/4/2010 6:12:25 PM
Y - Gain with above average volume today, approaching all-time highs while working on the right side of a choppy 11-week base. Featured in yellow in the 12/24/09 mid-day report (read here). No overhead supply exists to act as resistance, however it did not yet rise above the pivot point cited with the volume needed to trigger a proper new technical buy signal, so patience and disciplined are needed. Following its steep ascent from its March low ($4.31), an additional public offering of shares on 7/10/09 coincided with a successful earlier test of 50 DMA support. Fundamentally, this high-ranked Computer - Tech Services firm's earnings and sales revenues increases have been above or at the +25% minimum guideline.
>>> The latest Featured Stock Update with an annotated graph appeared on 12/24/2009. click here.
|
|
C
A
S
I |
News |
Chart |
SEC
View all notes Alert
me of new notes
Company
Profile
|
|
|
|
THESE ARE NOT BUY RECOMMENDATIONS!
Comments contained in the body of this report are technical
opinions only. The material herein has been obtained
from sources believed to be reliable and accurate, however,
its accuracy and completeness cannot be guaranteed.
This site is not an investment advisor, hence it does
not endorse or recommend any securities or other investments.
Any recommendation contained in this report may not
be suitable for all investors and it is not to be deemed
an offer or solicitation on our part with respect to
the purchase or sale of any securities. All trademarks,
service marks and trade names appearing in this report
are the property of their respective owners, and are
likewise used for identification purposes only.
This report is a service available
only to active Paid Premium Members.
You may opt-out of receiving report notifications
at any time. Questions or comments may be submitted
by writing to Premium Membership Services 665 S.E. 10 Street, Suite 201 Deerfield Beach, FL 33441-5634 or by calling 1-800-965-8307
or 954-785-1121.
|
|
|


