You are not logged in.
This means you
CAN ONLY VIEW reports that were published prior to Tuesday, April 15, 2025.
You
MUST UPGRADE YOUR MEMBERSHIP if you want to see any current reports.
AFTER MARKET UPDATE - WEDNESDAY, DECEMBER 30TH, 2009
Previous After Market Report Next After Market Report >>>
|
|
|
|
DOW |
+3.10 |
10,548.51 |
+0.03% |
|
Volume |
644,415,370 |
+1% |
|
Volume |
1,331,968,080 |
+9% |
|
NASDAQ |
+2.88 |
2,291.28 |
+0.13% |
|
Advancers |
1,368 |
44% |
|
Advancers |
1,428 |
50% |
|
S&P 500 |
+0.22 |
1,126.42 |
+0.02% |
|
Decliners |
1,622 |
52% |
|
Decliners |
1,298 |
45% |
|
Russell 2000 |
+0.23 |
633.41 |
+0.04% |
|
52 Wk Highs |
136 |
|
|
52 Wk Highs |
92 |
|
|
S&P 600 |
+0.21 |
337.33 |
+0.06% |
|
52 Wk Lows |
3 |
|
|
52 Wk Lows |
7 |
|
|
 |
Mixed Action As Indices Hold Ground Near 2009 Highs
Adam Sarhan, Contributing Writer,
The major averages opened lower on concern that the Fed will withdraw its stimulus measures sooner than expected as the economic recovery continues. Volume, an important indicator of institutional sponsorship, was reported lighter than Tuesday's totals which indicated large institutions were not aggressively buying or selling stocks. Decliners narrowly led advancers on the NYSE while the mix on the Nasdaq exchange was slightly favoring advancers. There were 18 high-ranked companies from the CANSLIM.net Leaders List that made a new 52-week high and appeared on the CANSLIM.net BreakOuts Page, lower than the total of 27 issues that appeared on the prior session. New 52-week highs solidly outnumbered new 52-week lows on the NYSE and on the Nasdaq exchange.
At 9:45AM EST the Institute of Supply Management (ISM) released its Chicago purchasers index (PMI). The index surveys purchasers from both the manufacturing and non manufacturing (i.e. service) sectors of the economy. In the simplest form, the report compiles a survey to analyze business conditions in the Chicago area. The index came in at 60 which easily topped the Street's forecast. The Chicago PMI has now posted three consecutive monthly gains all at accelerating rates (60.0 Dec, 56.1 Nov, 54.2 Oct). It was also the highest reading since January 2006! The stronger than expected report suggests the economy is improving and bodes well for the recovery. Paradoxically, evidence of a stronger economy led many to worry about the Fed withdrawing its stimulus measures and possibly erring on the side of raising rates in early 2010.
Looking at the market, the action remains constructive. The Dow Jones Industrial Average, small cap Russell 2000 Index, S&P 500 Index and Nasdaq Composite and NYSE Composite indices are all trading near fresh 2009 highs which bodes well for this rally. The inverse relationship with the US dollar has eased in recent weeks as both stocks and the greenback have rallied in tandem. Ideally, one would like to see leadership and volume expand over the next few weeks as the major averages continue advancing.
Sign Up Now! A full overview of the market, the entire financial crisis, and leading/lagging stocks and sectors will be discussed in CANSLIM.net's Q4 Webcast tonight!
PICTURED: The Dow Jones Indistrial Average closed higher on lighter volume than the prior session.
|
|
|
 |
Financial Group's Lagging Action Continues
Kevin Thomas
Defensive groups were sluggish as the Gold & Silver Index ($XAU -0.80%), Healthcare Index ($HMO -0.22%) and energy-related shares were among Wednesday's laggards. The Oil Services Index ($OSX -0.15%) and Integrated Oil Index ($XOI +0.09%) essentially ended unchanged. The Retail Index ($RLX -0.53%) also was modestly lower, limiting the major averages from making more upward progress. Tech sector gains were mostly modest, yet unanimous gains from the Internet Index ($IIX +0.20%), Networking Index ($NWX +0.32%), Biotechnology Index ($BTK +0.39%), and a standout gain from the Semiconductor Index ($SOX +1.46%) helped the small-cap indices outpace their peers. The Broker/Dealer Index ($XBD +0.35%) has been hovering near its 50-day moving average line, and the financial group has recently been noted while lagging behind many other stronger group indices which are trading at or near 2009 highs.
Charts courtesy www.stockcharts.com
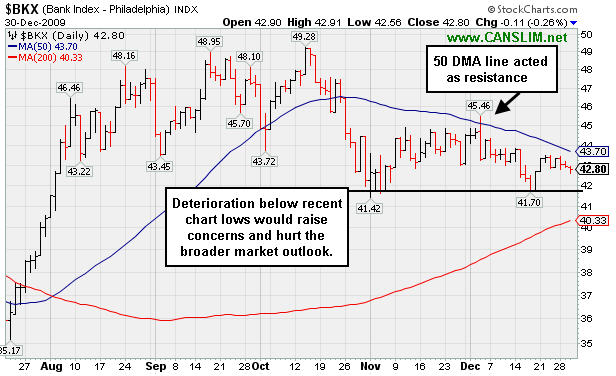
PICTURED: The Bank Index ($BKX -0.26%) continues to struggle below its 50-day moving average line. That short-term average acted as resistance in early December. Subsequent deterioration below its prior chart lows would be an ominous sign, especially because the financial group is a reliable leading indicator for the broader market. This point is also being illustrated in CANSLIM.net's Q4 Webcast which airs at 8PM EST on December 30, 2009 and will be available to be viewed on-demand.
| Oil Services |
$OSX |
196.20 |
-0.30 |
-0.15% |
+61.63% |
| Healthcare |
$HMO |
1,496.42 |
-3.32 |
-0.22% |
+55.85% |
| Integrated Oil |
$XOI |
1,077.20 |
+0.95 |
+0.09% |
+9.95% |
| Semiconductor |
$SOX |
361.39 |
+5.21 |
+1.46% |
+70.33% |
| Networking |
$NWX |
233.11 |
+0.74 |
+0.32% |
+62.01% |
| Internet |
$IIX |
236.31 |
+0.47 |
+0.20% |
+76.65% |
| Broker/Dealer |
$XBD |
115.68 |
+0.40 |
+0.35% |
+49.32% |
| Retail |
$RLX |
416.27 |
-2.21 |
-0.53% |
+49.06% |
| Gold & Silver |
$XAU |
168.12 |
-1.35 |
-0.80% |
+35.74% |
| Bank |
$BKX |
42.80 |
-0.11 |
-0.26% |
-3.43% |
| Biotech |
$BTK |
948.38 |
+3.73 |
+0.39% |
+46.54% |
|
|
|
 |
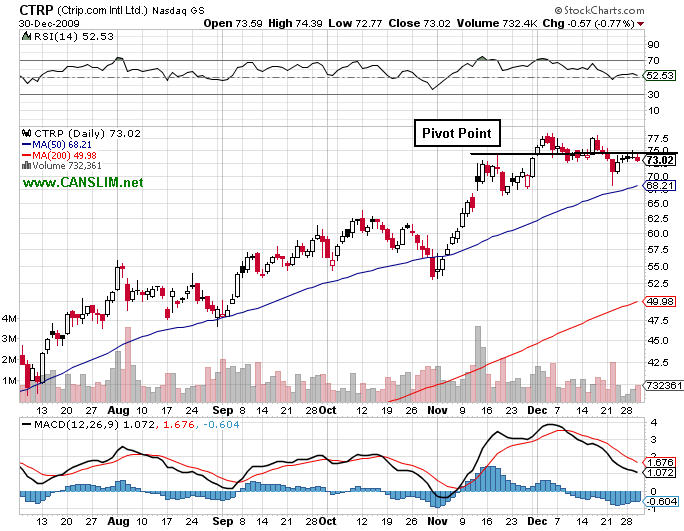
Consolidation Under Pivot Point Raised Concerns
Kenneth J. Gruneisen - Passed the CAN SLIM® Master's Exam
Ctrip.com International (CTRP -$0.57 or -0.77% to $73.02) posted a small loss today on lighter than average volume. Last week's slump under its pivot point raised concerns while falling on higher volume toward its 50-day moving average (DMA) line - its next important chart support level. Near its pivot point now, it encountered some distributional pressure when recently rallying above its "max buy" price of $77.60. Featured on 12/01/09 in yellow in the mid-day report (read here). It triggered a technical buy signal as it rose with more than +50% above average volume from a brief consolidation resembling a "high-tight-flag" pattern which it formed after repairing a late-October breach of its 50 DMA line and sprinting considerably higher. Fundamentally, its sales revenues and earnings increases have shown acceleration in the 3 most recent quarterly comparisons and rose solidly above the +25% guideline in the latest period ended September 30, 2009.
A follow-up study on 12/29/08 included an annotated graph under the headline "Disciplined Investors Avoided This Trip To The House Of Pain." That was well after if was dropped from the Featured Stocks list on 6/10/09 based on weak technical action when it closed at $49.84. Technically, it has rebounded very impressively from subsequent lows in the $16 area. It has maintained a strong and steady annual; earnings (A criteria) history. Fundamentals have shown greater sales revenues and earnings increases in the most current quarterly comparisons (C criteria), which is a very encouraging sign. The number of top-rated funds owning its shares increased from 52 in Mar '09 to 114 in Dec '09, which helps satisfy the I criteria.
A FRESH ANNOTATED DAILYGRAPH WILL BE ADDED FOR THIS STOCK SOON. CHART SERVICE IS CURRENTLY IN USE FOR TONIGHT'S Q4 WEBCAST "HOW TO NAVIGATE DURING VOLATILE TIMES" DO NOT MISS YOUR OPPORTUNITY TO ATTEND OR VIEW THE PRESENTATION ON-DEMAND AT A CONVENIENT TIME. |
|
|
Color Codes Explained :
Y - Better candidates highlighted by our
staff of experts.
G - Previously featured
in past reports as yellow but may no longer be buyable under the
guidelines.
***Last / Change / Volume quote data in this table corresponds with the timestamp on the note***
Symbol/Exchange
Company Name
Industry Group |
Last |
Chg. |
Vol
% DAV |
Date Featured |
Price Featured |
Latest Pivot Point
Featured |
Status |
| Latest Max Buy Price |
ARST
-
|
$25.80
|
-0.52
|
190,740
39% DAV
494,100
|
9/1/2009
(Date
Featured) |
$19.91
(Price
Featured) |
PP = $27.20 |
Y |
| MB = $28.56 |
Most Recent Note - 12/30/2009 6:26:33 PM
Y - Small loss today on light volume while quietly hovering near all-time highs. It has been basing for 7 weeks. Color code was changed to yellow with new pivot point and max buy levels noted. ARST was first featured in yellow at $19.91 in the 9/01/09 mid-day report with an annotated daily graph (read here).
>>> The latest Featured Stock Update with an annotated graph appeared on 12/16/2009. click here.
|
|
C
A
S
I |
News |
Chart |
SEC
View all notes Alert
me of new notes
Company
Profile
|
ASIA
-
|
$31.08
|
+0.76
|
498,667
39% DAV
1,288,500
|
12/24/2009
(Date
Featured) |
$31.05
(Price
Featured) |
PP = $32.40 |
Y |
| MB = $34.02 |
Most Recent Note - 12/30/2009 6:27:55 PM
Y - Small gain today on very light volume leaves it near all-time highs. It has formed an advanced "3 weeks tight" type pattern, and color code was changed to yellow. A subsequent breakout with heavy volume is needed to confirm a new technical buy signal. Traded up as much as +68.13% since first featured in the August 2009 CANSLIM.net News (read here).
>>> The latest Featured Stock Update with an annotated graph appeared on 12/23/2009. click here.
|
|
C
A
S
I |
News |
Chart |
SEC
View all notes Alert
me of new notes
Company
Profile
|
BIDU
- NASDAQ
Baidu Inc Ads
INTERNET - Internet Information Providers
|
$416.23
|
-3.40
|
727,290
40% DAV
1,804,800
|
9/8/2009
(Date
Featured) |
$351.80
(Price
Featured) |
PP = $440.00 |
Y |
| MB = $462.00 |
Most Recent Note - 12/30/2009 6:29:51 PM
Y - Loss on light volume today, closing back below its 50 DMA line. Technically, it has built a sloppy base over the past 9 weeks, and gains above its previously cited pivot point with at least +50% above average volume could trigger a new buy signal. BIDU traded up as much as +23% from its price when featured in yellow in the 9/08/09 Mid-Day BreakOuts Report (read here).
>>> The latest Featured Stock Update with an annotated graph appeared on 12/21/2009. click here.
|
|
C
A
S
I |
News |
Chart |
SEC
View all notes Alert
me of new notes
Company
Profile
|
CAAS
- NASDAQ
China Automotive Systems
AUTOMOTIVE - Auto Parts
|
$19.19
|
-0.19
|
701,932
93% DAV
757,900
|
11/30/2009
(Date
Featured) |
$18.84
(Price
Featured) |
PP = $17.62 |
G |
| MB = $18.50 |
Most Recent Note - 12/30/2009 6:37:49 PM
G - Fell today on near average volume. Consolidating after 3 consecutive considerable gains backed by above average volume signaled prompt support and accumulation following a pullback its short-term average line. It positively reversed after a gap down and pullback near support at its 50 DMA line. The Chinese maker of power steering systems had negated most of its bullish action since featured in the 11/30/09 mid-day report (read here).
>>> The latest Featured Stock Update with an annotated graph appeared on 12/29/2009. click here.
|
|
C
A
S
I |
News |
Chart |
SEC
View all notes Alert
me of new notes
Company
Profile
|
CACC
- NASDAQ
Credit Acceptance Corp
FINANCIAL SERVICES - Credit Services
|
$42.13
|
-0.77
|
57,171
143% DAV
39,900
|
9/29/2009
(Date
Featured) |
$33.48
(Price
Featured) |
PP = $37.10 |
G |
| MB = $38.96 |
Most Recent Note - 12/30/2009 6:40:48 PM
G - Today's loss on higher volume indicated distributional pressure while consolidating from all-time highs. After getting extended from its prior base, previous chart highs near $35-37 are an important support level to watch. The Finance - Consumer/Commercial Loans firm has maintained a great track record of annual and quarterly sales revenues and earnings increases. It was featured on 9/29/09 in yellow in the mid-day report (read here).
>>> The latest Featured Stock Update with an annotated graph appeared on 12/22/2009. click here.
|
|
C
A
S
I |
News |
Chart |
SEC
View all notes Alert
me of new notes
Company
Profile
|
CRM
- NYSE
Salesforce.com Inc
INTERNET - Internet Software & Services
|
$74.02
|
-0.62
|
3,030,916
181% DAV
1,672,200
|
12/18/2009
(Date
Featured) |
$67.32
(Price
Featured) |
PP = $67.82 |
G |
| MB = $71.21 |
Most Recent Note - 12/30/2009 6:42:47 PM
G - A small gap down and loss on above average volume today followed 7 consecutive gains that had it trading near its $75 all-time high from June 2008. It is now extended from its prior base after rising from a 5-week flat base above important support at its 50 DMA line. Its 12/18/09 gain with more than +50% above average volume triggered a technical buy signal.
>>> The latest Featured Stock Update with an annotated graph appeared on 12/18/2009. click here.
|
|
C
A
S
I |
News |
Chart |
SEC
View all notes Alert
me of new notes
Company
Profile
|
CTRP
- NASDAQ
Ctrip.com Intl Ltd Adr
LEISURE - Resorts & Casinos
|
$73.02
|
-0.57
|
732,361
66% DAV
1,112,600
|
12/1/2009
(Date
Featured) |
$75.38
(Price
Featured) |
PP = $73.91 |
G |
| MB = $77.61 |
Most Recent Note - 12/30/2009 6:46:16 PM
G - Small loss today with below average volume. Last week's slump under its pivot point raised concerns while falling on higher volume toward its 50 DMA line - its next important chart support level. Featured on 12/01/09 in yellow in the mid-day report (read here). Fundamentally, its sales revenues and earnings increases have shown acceleration in the 3 most recent quarterly comparisons and rose above the +25% guideline. Based on weak technical action it was dropped from the Featured Stocks list on 6/10/08, when it closed at $49.84, yet it has rebounded very impressively from subsequent lows in the $16 area.
>>> The latest Featured Stock Update with an annotated graph appeared on 12/30/2009. click here.
|
|
C
A
S
I |
News |
Chart |
SEC
View all notes Alert
me of new notes
Company
Profile
|
GMCR
- NASDAQ
Green Mtn Coffee Roastrs
FOOD & BEVERAGE - Processed & Packaged Goods
|
$80.00
|
+0.03
|
933,925
60% DAV
1,560,600
|
12/28/2009
(Date
Featured) |
$77.49
(Price
Featured) |
PP = $76.50 |
Y |
| MB = $80.33 |
Most Recent Note - 12/30/2009 6:50:56 PM
Y - Small gain today with light volume for a new high close, approaching its "max buy" level. Considerable gain on 12/28/09 prompted its re-appearance in yellow in the mid-day report (read here) as it rose above the pivot point of a 10-week "double bottom" type base on +62% above average volume, confirming a new technical buy signal. Based on weak action it was dropped from the Featured Stocks list on 12/01/09. Its 12/18/09 gain on heavy volume repaired its prior 50 DMA line violation, helping its outlook improve.
>>> The latest Featured Stock Update with an annotated graph appeared on 12/28/2009. click here.
|
|
C
A
S
I |
News |
Chart |
SEC
View all notes Alert
me of new notes
Company
Profile
|
HEAT
-
|
$14.68
|
+0.08
|
538,493
56% DAV
964,900
|
11/17/2009
(Date
Featured) |
$12.00
(Price
Featured) |
PP = $12.61 |
G |
| MB = $13.24 |
Most Recent Note - 12/30/2009 6:53:24 PM
G - Gain today on light volume while consolidating well above prior chart highs and its 50 DMA line coinciding in the $12.60 area as important support levels. The investment system rules say a stock should be held a minimum of 8 weeks after rising more than +20% in the first 2-3 weeks from being bought. HEAT traded as much as +43.9% higher since first featured in yellow in the 11/17/09 mid-day report (read here) when technically rising from a "double bottom" base, reaching a new all-time high.
>>> The latest Featured Stock Update with an annotated graph appeared on 12/15/2009. click here.
|
|
C
A
S
I |
News |
Chart |
SEC
View all notes Alert
me of new notes
Company
Profile
|
LFT
-
|
$37.58
|
-0.47
|
104,046
25% DAV
411,300
|
11/17/2009
(Date
Featured) |
$31.77
(Price
Featured) |
PP = $33.04 |
G |
| MB = $34.69 |
Most Recent Note - 12/30/2009 6:55:53 PM
G - Second consecutive small loss on very light volume while hovering near all-time highs. Extended from a sound buy point now after recently rising from a choppy 14-week base. Its 50 DMA line and prior chart highs are an initial support levels to watch. A proposed offering of additional shares on 11/16/09 seems well received by the market. Its fundamentals remain strong.
>>> The latest Featured Stock Update with an annotated graph appeared on 12/17/2009. click here.
|
|
C
A
S
I |
News |
Chart |
SEC
View all notes Alert
me of new notes
Company
Profile
|
VIT
-
|
$19.38
|
-0.48
|
435,465
86% DAV
505,700
|
12/24/2009
(Date
Featured) |
$20.07
(Price
Featured) |
PP = $21.17 |
Y |
| MB = $22.23 |
Most Recent Note - 12/30/2009 6:57:49 PM
Y - Small loss today, pulling back after approaching all-time highs. Featured in yellow in the 12/24/09 mid-day report (read here) while working on the right side of a choppy 10-week base. No overhead supply exists to act as resistance, however it did not yet rise above the pivot point cited with the volume needed to trigger a proper new technical buy signal, so patience and disciplined are needed. Following its steep ascent from its March low ($4.31), an additional public offering of shares on 7/10/09 coincided with a successful earlier test of 50 DMA support. Fundamentally, this high-ranked Computer - Tech Services firm's earnings and sales revenues increases have been above or at the +25% minimum guideline.
>>> The latest Featured Stock Update with an annotated graph appeared on 12/24/2009. click here.
|
|
C
A
S
I |
News |
Chart |
SEC
View all notes Alert
me of new notes
Company
Profile
|
|
|
|
THESE ARE NOT BUY RECOMMENDATIONS!
Comments contained in the body of this report are technical
opinions only. The material herein has been obtained
from sources believed to be reliable and accurate, however,
its accuracy and completeness cannot be guaranteed.
This site is not an investment advisor, hence it does
not endorse or recommend any securities or other investments.
Any recommendation contained in this report may not
be suitable for all investors and it is not to be deemed
an offer or solicitation on our part with respect to
the purchase or sale of any securities. All trademarks,
service marks and trade names appearing in this report
are the property of their respective owners, and are
likewise used for identification purposes only.
This report is a service available
only to active Paid Premium Members.
You may opt-out of receiving report notifications
at any time. Questions or comments may be submitted
by writing to Premium Membership Services 665 S.E. 10 Street, Suite 201 Deerfield Beach, FL 33441-5634 or by calling 1-800-965-8307
or 954-785-1121.
|
|
|


