You are not logged in.
This means you
CAN ONLY VIEW reports that were published prior to Monday, February 26, 2024.
You
MUST UPGRADE YOUR MEMBERSHIP if you want to see any current reports.
AFTER MARKET UPDATE - FRIDAY, DECEMBER 20TH, 2019
Previous After Market Report Next After Market Report >>>
|
|
|
|
DOW |
+78.13 |
28,455.09 |
+0.28% |
|
Volume |
2,813,908,200 |
+189% |
|
Volume |
3,800,525,600 |
+59% |
|
NASDAQ |
+37.74 |
8,924.96 |
+0.42% |
|
Advancers |
1,708 |
59% |
|
Advancers |
1,806 |
58% |
|
S&P 500 |
+15.85 |
3,221.22 |
+0.49% |
|
Decliners |
1,174 |
41% |
|
Decliners |
1,326 |
42% |
|
Russell 2000 |
+4.81 |
1,671.90 |
+0.29% |
|
52 Wk Highs |
272 |
|
|
52 Wk Highs |
337 |
|
|
S&P 600 |
+0.44 |
1,022.88 |
+0.04% |
|
52 Wk Lows |
9 |
|
|
52 Wk Lows |
51 |
|
|
 |
Record Rally Continues as Options Expirations Inflate Volume
Kenneth J. Gruneisen - Passed the CAN SLIM® Master's Exam
The Dow rose 78 points to cap its weekly gain at 1.1%. The S&P 500 climbed 0.5% and notched a fourth straight week of gains with a 1.7% advance. The Nasdaq Composite added 0.4%, jumping 2.2% for the week. Advancers led decliners by almost a 3-2 margin on the NYSE and on the Nasdaq exchange. The volume totals were much higher than the prior session on the NYSE and on the Nasdaq exchange, inflated by options expirations. There were 112 high-ranked companies from the Leaders List that hit a new 52-week high and were listed on the BreakOuts Page, versus the total of 55 on the prior session. New 52-week highs totals swelled and easily outnumbered new 52-week lows totals on the NYSE and on the Nasdaq exchange. The major indices (M criteria) are in a "confirmed uptrend" after enduring distributional pressure in recent weeks. The Featured Stocks Page provides the most timely analysis on high-ranked leaders. Charts used courtesy of www.stockcharts.com
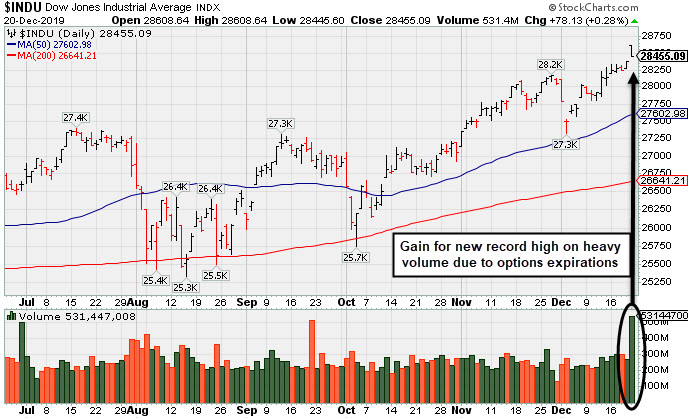
PICTURED: The Dow Jones Industrial Average hit a new record high with a gain backed by heavy volume due to options expirations. It recently found support near prior highs and above its 50-day moving average (DMA) line.
Stocks The major averages climbed to fresh record highs on Friday as easing geopolitical concerns continued to provide a tailwind to global equity markets. Both President Trump and Treasury Secretary Steven Mnuchin gave positive remarks surrounding the agreed upon “phase-one” trade deal.
Economic data was in focus, with the core PCE deflator, which is the Fed’s preferred gauge of inflation, ticking up to a 1.6% annualized reading. It came in below the Fed’s 2.0% target, but above consensus forecasts of 1.5%. Separately, the final print of third-quarter U.S. GDP came in at a 2.1% annualized reading, matching analyst estimates. Additional surveys revealed personal income rose more than anticipated in November, while personal spending climbed 0.4%, in-line with projections. A final reading on consumer sentiment levels in December came in at 99.3, just above the preliminary reading of 99.2. Treasuries were mixed, with the yield on the 10-year note adding one basis point to 1.92%.
All 11 S&P 500 sectors ended the session in positive territory with the Energy and Utilities groups pacing the gains. In corporate news, Nike (NKE -1.2%) fell after the athletic apparel maker reported lower-than-expected revenue growth in North America following a beat on both the top and bottom line. In commodities, WTI crude lost 1.4% to $60.33/barrel paring its weekly advance to 0.5%. COMEX gold dipped 0.2% to $1,474.70/ounce.
|
 Kenneth J. Gruneisen started out as a licensed stockbroker in August 1987, a couple of months prior to the historic stock market crash that took the Dow Jones Industrial Average down -22.6% in a single day. He has published daily fact-based fundamental and technical analysis on high-ranked stocks online for two decades. Through FACTBASEDINVESTING.COM, Kenneth provides educational articles, news, market commentary, and other information regarding proven investment systems that work in good times and bad.
Comments contained in the body of this report are technical opinions only and are not necessarily those of Gruneisen Growth Corp. The material herein has been obtained from sources believed to be reliable and accurate, however, its accuracy and completeness cannot be guaranteed. Our firm, employees, and customers may effect transactions, including transactions contrary to any recommendation herein, or have positions in the securities mentioned herein or options with respect thereto. Any recommendation contained in this report may not be suitable for all investors and it is not to be deemed an offer or solicitation on our part with respect to the purchase or sale of any securities. |
|
 |
Semiconductor, Biotech, and Integrated Oil Indexes Rose
Kenneth J. Gruneisen - Passed the CAN SLIM® Master's Exam
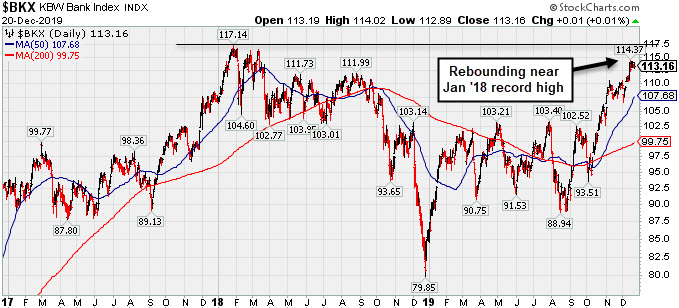
The Retail Index ($RLX -0.06%), Broker/Dealer Index ($XBD -0.12%) and the Bank Index ($BKX +0.01%) each finished flat on Friday. The tech sector was led higher by the Semiconductor Index ($SOX +1.03%) and the Biotech Index ($BTK +0.68%), but the Networking Index ($NWX -0.41%) edged lower. The Gold & Silver Index ($XAU 1.85%) and Oil Services Index ($OSX -1.08%) both slumped while the Integrated Oil Index ($XOI +0.65%) posted a modest gain.
PICTURED: The 3-year graph of the Bank Index ($BKX +0.01%) shows it approaching its record high hit in January 2018.
| Oil Services |
$OSX |
76.64 |
-0.84 |
-1.08% |
-4.91% |
| Integrated Oil |
$XOI |
1,255.75 |
+8.06 |
+0.65% |
+8.34% |
| Semiconductor |
$SOX |
1,853.87 |
+18.90 |
+1.03% |
+60.48% |
| Networking |
$NWX |
581.44 |
-2.38 |
-0.41% |
+18.98% |
| Broker/Dealer |
$XBD |
293.21 |
-0.35 |
-0.12% |
+23.54% |
| Retail |
$RLX |
2,415.05 |
-1.57 |
-0.06% |
+23.76% |
| Gold & Silver |
$XAU |
97.56 |
-1.84 |
-1.85% |
+38.07% |
| Bank |
$BKX |
113.16 |
+0.01 |
+0.01% |
+31.90% |
| Biotech |
$BTK |
5,170.44 |
+35.07 |
+0.68% |
+22.50% |
|
|
|
 |
Perched Within Close Striking Distance of 52-Week High
Kenneth J. Gruneisen - Passed the CAN SLIM® Master's Exam
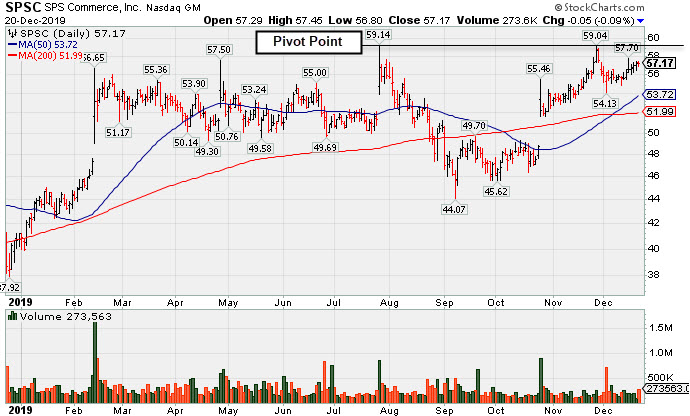
S P S Commerce Inc (SPSC -$0.05 or -0.09% to $57.17) paused today after 6 consecutive gains and remains perched near its all-time high. Subsequent gains above its pivot point backed by at least +40% above average volume are needed to trigger a new technical buy signal. Fundamentals remain strong.
A 2:1 split impacted share price on 8/23/19 when it was dropped from the Featured Stocks list. It reported earnings +27% on +13% sales revenues for the Sep '19 quarter, and 3 of the past 4 quarterly comparisons were above the +25% minimum earnings guideline (C criteria). A small downturn in FY '16 earnings was previously noted as a flaw in its annual earnings (A criteria) history.
The number of top-rated funds owning its shares rose from 238 in Mar '18 to 480 in Sep '19, a reassuring sign concerning the I criteria. Its current Up/Down Volume Ratio of 1.6 is an unbiased indication its shares have been under accumulation over the past 50 days. It has a Timeliness Rating of B and Sponsorship Rating of D. The small supply of 34.8 million shares outstanding (S criteria) can contribute to greater price volatility in the even of institutional buying or selling.
Charts courtesy of www.stockcharts.com
|
|
|
Color Codes Explained :
Y - Better candidates highlighted by our
staff of experts.
G - Previously featured
in past reports as yellow but may no longer be buyable under the
guidelines.
***Last / Change / Volume data in this table is the closing quote data***
Symbol/Exchange
Company Name
Industry Group |
PRICE |
CHANGE
(%Change) |
Day High |
Volume
(% DAV)
(% 50 day avg vol) |
52 Wk Hi
% From Hi |
Featured
Date |
Price
Featured |
Pivot Featured |
|
Max Buy |
 MLR
-
NYSE
MLR
-
NYSE
Miller Industries Inc
AUTOMOTIVE - Auto Parts
|
$37.01
|
+0.11
0.30% |
$37.22
|
77,335
168.12% of 50 DAV
50 DAV is 46,000
|
$38.18
-3.06%
|
9/24/2019
|
$34.00
|
PP = $35.36
|
|
MB = $37.13
|
Most Recent Note - 12/17/2019 5:16:44 PM
G - Hit a new 52-week high as it rallied above its "max buy" level today with a gain backed by light volume and its color code was changed to green. Prior highs in the $35 area define initial support along with its 50 DMA line. Resilient after reporting Sep '19 earnings which were below the fundamental guidelines of the fact-based investment system.
>>> FEATURED STOCK ARTICLE : Miller Still Quietly Hovering Above Prior Highs - 12/4/2019 |
View all notes |
Set NEW NOTE alert |
Company Profile |
SEC
News |
Chart |
Request a new note
C
A
S
I |
CCBG
-
NASDAQ
Capital City Bk Gp
BANKING - Regional - Mid-Atlantic Banks
|
$30.35
|
+0.11
0.36% |
$30.58
|
84,350
200.83% of 50 DAV
50 DAV is 42,000
|
$30.88
-1.72%
|
12/16/2019
|
$30.07
|
PP = $30.95
|
|
MB = $32.50
|
Most Recent Note - 12/17/2019 5:15:49 PM
Y - Posted a 4th consecutive gain backed by above average volume and finished strong today while challenging its 52-week high. Subsequent gains above the new pivot point cited based on its 11/06/19 high plus 10 cents may trigger a new (or add-on) technical buy signal. Found support at its 50 DMA line ($28.76) during its orderly consolidation.
>>> FEATURED STOCK ARTICLE : Found Support at 50-Day Moving Average - 12/10/2019 |
View all notes |
Set NEW NOTE alert |
Company Profile |
SEC
News |
Chart |
Request a new note
C
A
S
I |
FTNT
-
NASDAQ
Fortinet Inc
Computer Sftwr-Security
|
$106.92
|
-2.61
-2.38% |
$110.28
|
2,242,317
162.02% of 50 DAV
50 DAV is 1,384,000
|
$109.79
-2.61%
|
12/9/2019
|
$103.85
|
PP = $106.10
|
|
MB = $111.41
|
 Most Recent Note - 12/20/2019 5:26:10 PM
Y - There was a "negative reversal" for a loss with heavier volume today after hitting another new 52-week high. Wedged higher with gains lacking great volume conviction after highlighted in yellow with pivot point cited based on its 11/20/19 high plus 10 cents. Prior high in the $97 area defines initial support to watch on pullbacks.
>>> FEATURED STOCK ARTICLE : Extended From Prior Base Perched Near Record HIgh - 12/2/2019 |
View all notes |
Set NEW NOTE alert |
Company Profile |
SEC
News |
Chart |
Request a new note
C
A
S
I |
SPSC
-
NASDAQ
S P S Commerce Inc
COMPUTER SOFTWARE and SERVICES - Application Software
|
$57.17
|
-0.05
-0.09% |
$57.45
|
314,312
154.83% of 50 DAV
50 DAV is 203,000
|
$59.14
-3.33%
|
11/29/2019
|
$56.59
|
PP = $59.24
|
|
MB = $62.20
|
Most Recent Note - 12/20/2019 5:20:26 PM
Y - Paused today after 6 consecutive small gains, perched near its all-time high. Subsequent gains above its pivot point backed by at least +40% above average volume are needed to trigger a new technical buy signal. Fundamentals remain strong. See the latest FSU analysis for more details and a new annotated graph.
>>> FEATURED STOCK ARTICLE : Perched Within Close Striking Distance of 52-Week High - 12/20/2019 |
View all notes |
Set NEW NOTE alert |
Company Profile |
SEC
News |
Chart |
Request a new note
C
A
S
I |
AUDC
-
NASDAQ
Audiocodes Ltd
ELECTRONICS - Scientific and Technical Instrum
|
$25.28
|
+0.33
1.32% |
$25.47
|
200,623
75.42% of 50 DAV
50 DAV is 266,000
|
$26.00
-2.77%
|
9/13/2019
|
$19.68
|
PP = $19.84
|
|
MB = $20.83
|
Most Recent Note - 12/16/2019 5:15:38 PM
G - Posted a gain today with average volume for a new all-time high. Getting very extended from the previously noted base. Prior highs in the $22 area define initial support above its 50 DMA line ($21.47). Fundamentals remain strong. See the latest FSU analysis for more details and an annotated graph.
>>> FEATURED STOCK ARTICLE : Reversed Into Red After Hitting Yet Another New High - 12/13/2019 |
View all notes |
Set NEW NOTE alert |
Company Profile |
SEC
News |
Chart |
Request a new note
C
A
S
I |
Symbol/Exchange
Company Name
Industry Group |
PRICE |
CHANGE
(%Change) |
Day High |
Volume
(% DAV)
(% 50 day avg vol) |
52 Wk Hi
% From Hi |
Featured
Date |
Price
Featured |
Pivot Featured |
|
Max Buy |
CHDN
-
NASDAQ
Churchill Downs Inc
LEISURE - Gaming Activities
|
$134.18
|
-0.86
-0.64% |
$136.55
|
430,463
151.57% of 50 DAV
50 DAV is 284,000
|
$137.42
-2.36%
|
10/8/2019
|
$129.77
|
PP = $132.83
|
|
MB = $139.47
|
Most Recent Note - 12/20/2019 5:22:19 PM
G - Churned above average volume and ended lower today while challenging its 52-week high. Its 50 DMA line ($130) defines near-term support above the prior low ($121.81 on 11/07/19) The Jun and Sep '19 quarterly earnings versus the year ago periods were both below the +25% minimum guideline (C criteria) and raised fundamental concerns.
>>> FEATURED STOCK ARTICLE : Met Resistance After Rebounding Near Prior High - 12/9/2019 |
View all notes |
Set NEW NOTE alert |
Company Profile |
SEC
News |
Chart |
Request a new note
C
A
S
I |
LULU
-
NASDAQ
Lululemon Athletica
MANUFACTURING - Textile Manufacturing
|
$230.29
|
+6.16
2.75% |
$230.57
|
3,293,709
158.89% of 50 DAV
50 DAV is 2,073,000
|
$235.50
-2.21%
|
9/6/2019
|
$201.25
|
PP = $194.35
|
|
MB = $204.07
|
Most Recent Note - 12/17/2019 5:07:25 PM
G - Recently reported earnings +28% on +23% sales revenues for the Oct '19 quarter. Its 50 DMA line ($212.49) and prior high in the $209 area define important near-term support levels to watch. See the latest FSU analysis for more details and a new annotated graph.
>>> FEATURED STOCK ARTICLE : Retreated From High After Another Strong Earnings Report - 12/17/2019 |
View all notes |
Set NEW NOTE alert |
Company Profile |
SEC
News |
Chart |
Request a new note
C
A
S
I |
CPRT
-
NASDAQ
Copart Inc
SPECIALTY RETAIL - Auto Dealerships
|
$90.72
|
+1.32
1.48% |
$90.82
|
9,368,989
553.07% of 50 DAV
50 DAV is 1,694,000
|
$92.41
-1.83%
|
9/5/2019
|
$79.13
|
PP = $79.84
|
|
MB = $83.83
|
Most Recent Note - 12/19/2019 5:18:33 PM
G - Consolidating in a tight range well above its 50 DMA line ($85.45) which defines near-term support. Fundamentals remain strong.
>>> FEATURED STOCK ARTICLE : Extended From Prior Base and Hovering Near Record High - 12/12/2019 |
View all notes |
Set NEW NOTE alert |
Company Profile |
SEC
News |
Chart |
Request a new note
C
A
S
I |
NMIH
-
NASDAQ
N M I Holdings Inc Cl A
Finance-MrtgandRel Svc
|
$34.43
|
-0.33
-0.95% |
$35.41
|
2,058,260
439.80% of 50 DAV
50 DAV is 468,000
|
$35.79
-3.80%
|
11/8/2019
|
$32.89
|
PP = $31.44
|
|
MB = $33.01
|
Most Recent Note - 12/19/2019 5:16:57 PM
G - Finished at the session low after hitting a new all-time high with heavier volume behind today's 5th consecutive gain. Prior highs in the $30-31 area and its 50 DMA line ($31.55) define important near-term support. See the latest FSU analysis for more details and a new annotated graph.
>>> FEATURED STOCK ARTICLE : Hit New High But Encountered Distributional Pressure - 12/19/2019 |
View all notes |
Set NEW NOTE alert |
Company Profile |
SEC
News |
Chart |
Request a new note
C
A
S
I |
SPLK
-
NASDAQ
Splunk Inc
Computer Sftwr-Database
|
$150.96
|
+0.82
0.55% |
$151.61
|
7,056,567
358.02% of 50 DAV
50 DAV is 1,971,000
|
$152.68
-1.13%
|
11/25/2019
|
$147.79
|
PP = $142.16
|
|
MB = $149.27
|
Most Recent Note - 12/16/2019 5:09:36 PM
Y - Still consolidating above its pivot point and below its "max buy" level. Prior highs in the $142-143 area define initial support to watch on pullbacks. See the latest FSU analysis for more details and a new annotated graph.
>>> FEATURED STOCK ARTICLE : Consolidating Above Prior Highs Following Impressive Rally - 12/16/2019 |
View all notes |
Set NEW NOTE alert |
Company Profile |
SEC
News |
Chart |
Request a new note
C
A
S
I |
Symbol/Exchange
Company Name
Industry Group |
PRICE |
CHANGE
(%Change) |
Day High |
Volume
(% DAV)
(% 50 day avg vol) |
52 Wk Hi
% From Hi |
Featured
Date |
Price
Featured |
Pivot Featured |
|
Max Buy |
PAYC
-
NYSE
Paycom Software Inc
COMPUTER SOFTWARE and SERVICES - Application Software
|
$263.54
|
+1.78
0.68% |
$264.61
|
322,669
57.62% of 50 DAV
50 DAV is 560,000
|
$279.95
-5.86%
|
11/20/2019
|
$252.97
|
PP = $259.81
|
|
MB = $272.80
|
Most Recent Note - 12/17/2019 5:11:08 PM
Y - Quietly slumped back below its pivot point raising some concerns while falling back into the prior base. Fundamentals remain strong.
>>> FEATURED STOCK ARTICLE : Consolidating Near Prior Highs Which Define Initial Support - 12/11/2019 |
View all notes |
Set NEW NOTE alert |
Company Profile |
SEC
News |
Chart |
Request a new note
C
A
S
I |
BLD
-
NYSE
Topbuild Corp
Bldg-Constr Prds/Misc
|
$103.06
|
+1.48
1.46% |
$103.67
|
1,504,969
547.26% of 50 DAV
50 DAV is 275,000
|
$113.74
-9.39%
|
12/9/2019
|
$109.71
|
PP = $113.84
|
|
MB = $119.53
|
Most Recent Note - 12/19/2019 5:21:27 PM
G - Color code is changed to green after slumping further below its 50 DMA line ($105.44) with today's damaging volume-driven loss triggering a technical sell signal. Reported earnings +24% on +5% sales revenues for the Sep '19 quarter versus the year ago period, just below the +25% minimum guideline (C criteria).
>>> FEATURED STOCK ARTICLE : Consolidating After Getting Extended From Any Sound Base - 12/3/2019 |
View all notes |
Set NEW NOTE alert |
Company Profile |
SEC
News |
Chart |
Request a new note
C
A
S
I |
GLOB
-
NYSE
Globant SA
Computer-Tech Services
|
$106.00
|
+4.77
4.71% |
$106.30
|
374,100
135.05% of 50 DAV
50 DAV is 277,000
|
$112.33
-5.64%
|
11/14/2019
|
$106.87
|
PP = $112.43
|
|
MB = $118.05
|
Most Recent Note - 12/17/2019 5:13:17 PM
G - Subsequent volume-driven gains for new highs are still needed to trigger a technical buy signal. Found support near its 50 DMA line ($99) after volume-driven losses. Prior lows and its 200 DMA line define the next important support to watch. Fundamentals remain strong.
>>> FEATURED STOCK ARTICLE : Found Support at 50-Day Average During Choppy Consolidation - 12/5/2019 |
View all notes |
Set NEW NOTE alert |
Company Profile |
SEC
News |
Chart |
Request a new note
C
A
S
I |
|
|
|
THESE ARE NOT BUY RECOMMENDATIONS!
Comments contained in the body of this report are technical
opinions only. The material herein has been obtained
from sources believed to be reliable and accurate, however,
its accuracy and completeness cannot be guaranteed.
This site is not an investment advisor, hence it does
not endorse or recommend any securities or other investments.
Any recommendation contained in this report may not
be suitable for all investors and it is not to be deemed
an offer or solicitation on our part with respect to
the purchase or sale of any securities. All trademarks,
service marks and trade names appearing in this report
are the property of their respective owners, and are
likewise used for identification purposes only.
This report is a service available
only to active Paid Premium Members.
You may opt-out of receiving report notifications
at any time. Questions or comments may be submitted
by writing to Premium Membership Services 665 S.E. 10 Street, Suite 201 Deerfield Beach, FL 33441-5634 or by calling 1-800-965-8307
or 954-785-1121.
|
|
|