***Last / Change / Volume data in this table is the closing quote data***
Symbol/Exchange
Company Name
Industry Group |
PRICE |
CHANGE
(%Change) |
Day High |
Volume
(% DAV)
(% 50 day avg vol) |
52 Wk Hi
% From Hi |
Featured
Date |
Price
Featured |
Pivot Featured |
|
Max Buy |
ABV
-
NYSE
Comp De Bebidas Adr
FOOD and BEVERAGE - Beverages - Brewers
|
$134.71
|
-4.41
-3.17% |
$138.05
|
670,645
102.28% of 50 DAV
50 DAV is 655,700
|
$145.36
-7.33%
|
11/4/2010
|
$142.35
|
PP = $143.63
|
|
MB = $150.81
|
 Most Recent Note - 11/16/2010 4:30:06 PM
G - Loss today with average volume has it slumping near a recent low ($133.38 on 10/27/10) that defines support above its 50 DMA line. Color code is changed to green based upon its latest weakness, yet it remains only -7.3% off its all time high.
>>> The latest Featured Stock Update with an annotated graph appeared on 10/11/2010. Click here.
View all notes |
Alert me of new notes |
CANSLIM.net Company Profile |
SEC |
Zacks Reports |
StockTalk |
News |
Chart |
Request a new note
C
A N
S L
I M


|
ARUN
-
NASDAQ
Aruba Networks Inc
COMPUTER HARDWARE - Networking andamp; Communication Dev
|
$21.35
|
-0.24
-1.11% |
$21.49
|
3,651,367
152.75% of 50 DAV
50 DAV is 2,390,400
|
$23.85
-10.48%
|
8/30/2010
|
$18.12
|
PP = $18.51
|
|
MB = $19.44
|
Most Recent Note - 11/15/2010 4:23:12 PM
G - Closed near the session low today with a considerable loss with slightly above average volume indicative of distributional pressure. Its 50 DMA line defines important near-term support to watch. Earnings news is due on Wednesday, November 17, 2010 for its latest quarter ended October 31, 2010.
>>> The latest Featured Stock Update with an annotated graph appeared on 10/26/2010. Click here.
View all notes |
Alert me of new notes |
CANSLIM.net Company Profile |
SEC |
Zacks Reports |
StockTalk |
News |
Chart |
Request a new note
C
A N
S L
I M
|
BIDU
-
NASDAQ
Baidu Inc Ads
INTERNET - Internet Information Providers
|
$103.60
|
-5.20
-4.78% |
$109.17
|
16,535,057
139.08% of 50 DAV
50 DAV is 11,889,200
|
$115.04
-9.94%
|
9/17/2010
|
$85.73
|
PP = $88.42
|
|
MB = $92.84
|
Most Recent Note - 11/16/2010 3:47:13 PM
G - Enduring mild distributional pressure today, slumping toward its 50 DMA line. It may produce more climactic gains, however it is extended from a sound base pattern now and a riskier "late stage" candidate. BIDU is up 11-fold from when it was first featured in yellow on October 30, 2006 (read here). Following a deep correction and Bear Market, it has been a fixture on the Featured Stocks page and rallied +212% in the 14 months since returning to prominence September 8, 2009 (read here).
>>> The latest Featured Stock Update with an annotated graph appeared on 10/7/2010. Click here.
View all notes |
Alert me of new notes |
CANSLIM.net Company Profile |
SEC |
Zacks Reports |
StockTalk |
News |
Chart |
Request a new note
C
A N
S L
I M
|
CACC
-
NASDAQ
Credit Acceptance Corp
FINANCIAL SERVICES - Credit Services
|
$55.39
|
-2.00
-3.48% |
$57.22
|
57,203
227.00% of 50 DAV
50 DAV is 25,200
|
$63.45
-12.70%
|
11/3/2010
|
$59.86
|
PP = $63.55
|
|
MB = $66.73
|
Most Recent Note - 11/16/2010 10:54:30 AM
G - Violated the previously noted chart low ($55.07 on 10/04/10), raising concerns with today's early loss marking its 8th consecutive decline. Long ago chart high ($53.97) are the next likely support level above its 200 DMA line.
>>> The latest Featured Stock Update with an annotated graph appeared on 10/29/2010. Click here.
View all notes |
Alert me of new notes |
CANSLIM.net Company Profile |
SEC |
Zacks Reports |
StockTalk |
News |
Chart |
Request a new note
C
A N
S L
I M
|
CMG
-
NYSE
Chipotle Mexican Grill
LEISURE - Restaurants
|
$225.09
|
-5.28
-2.29% |
$232.95
|
936,042
116.13% of 50 DAV
50 DAV is 806,000
|
$240.78
-6.52%
|
9/1/2010
|
$158.31
|
PP = $155.52
|
|
MB = $163.30
|
Most Recent Note - 11/15/2010 4:43:30 PM
G - Consolidating near all-time highs, stubbornly holding its ground after recent volume-driven gains. It may produce more climactic gains, however it is very extended from any sound base pattern. Its 50 DMA line (now $187) defines the nearest chart support level.
>>> The latest Featured Stock Update with an annotated graph appeared on 10/28/2010. Click here.
View all notes |
Alert me of new notes |
CANSLIM.net Company Profile |
SEC |
Zacks Reports |
StockTalk |
News |
Chart |
Request a new note
C
A N
S L
I M
|
Symbol/Exchange
Company Name
Industry Group |
PRICE |
CHANGE
(%Change) |
Day High |
Volume
(% DAV)
(% 50 day avg vol) |
52 Wk Hi
% From Hi |
Featured
Date |
Price
Featured |
Pivot Featured |
|
Max Buy |
CTRP
-
NASDAQ
Ctrip.Com Intl Ltd Adr
LEISURE - Resorts and Casinos
|
$45.38
|
-0.93
-2.01% |
$47.09
|
2,755,149
140.09% of 50 DAV
50 DAV is 1,966,700
|
$53.16
-14.64%
|
9/24/2010
|
$46.75
|
PP = $47.11
|
|
MB = $49.47
|
Most Recent Note - 11/16/2010 4:24:30 PM
G - Slumped further below its 50 DMA line today. The loss with above average volume raised greater concerns as it closed below its old high close ($45.80 from 6/21/10) completely negating its prior breakout and all gains since its breakout shown in the last FSU section analysis.
>>> The latest Featured Stock Update with an annotated graph appeared on 9/28/2010. Click here.
View all notes |
Alert me of new notes |
CANSLIM.net Company Profile |
SEC |
Zacks Reports |
StockTalk |
News |
Chart |
Request a new note
C
A N
S L
I M
|
DECK
-
NASDAQ
Deckers Outdoor Corp
CONSUMER NON-DURABLES - Textile - Apparel Footwear
|
$59.97
|
-0.95
-1.56% |
$60.72
|
1,152,812
96.44% of 50 DAV
50 DAV is 1,195,400
|
$63.55
-5.63%
|
10/27/2010
|
$54.16
|
PP = $54.86
|
|
MB = $57.60
|
Most Recent Note - 11/16/2010 10:57:04 AM
G - Extended from its latest sound base, it is now consolidating above prior highs defining important chart support to watch above its 50 DMA line.
>>> The latest Featured Stock Update with an annotated graph appeared on 10/27/2010. Click here.
View all notes |
Alert me of new notes |
CANSLIM.net Company Profile |
SEC |
Zacks Reports |
StockTalk |
News |
Chart |
Request a new note
C
A N
S L
I M
|
EBIX
-
NASDAQ
Ebix Inc
COMPUTER SOFTWARE and SERVICES - Business Software and Services
|
$20.80
|
-0.75
-3.48% |
$21.35
|
1,040,074
134.45% of 50 DAV
50 DAV is 773,600
|
$28.21
-26.27%
|
9/23/2010
|
$21.78
|
PP = $22.74
|
|
MB = $23.88
|
Most Recent Note - 11/16/2010 3:51:09 PM
G - Down for a 6th consecutive loss today. Based on technical weakness it will be dropped from the Featured Stocks list tonight. While prior resistance in the $20 area may act as support, only a powerful rebound above its 50 DMA line would help its outlook.
>>> The latest Featured Stock Update with an annotated graph appeared on 9/24/2010. Click here.
View all notes |
Alert me of new notes |
CANSLIM.net Company Profile |
SEC |
Zacks Reports |
StockTalk |
News |
Chart |
Request a new note
C
A N
S L
I M
|
EZPW
-
NASDAQ
Ezcorp Inc Cl A
SPECIALTY RETAIL - Specialty Retail, Other
|
$25.02
|
-0.17
-0.67% |
$25.04
|
512,008
170.27% of 50 DAV
50 DAV is 300,700
|
$25.65
-2.46%
|
11/5/2010
|
$24.02
|
PP = $23.85
|
|
MB = $25.04
|
Most Recent Note - 11/16/2010 4:38:51 PM
G - Hovering near its all-time high while enduring mild distributional pressure, it closed near the session high today, yet its loss was backed by above average volume.
>>> The latest Featured Stock Update with an annotated graph appeared on 11/6/2010. Click here.
View all notes |
Alert me of new notes |
CANSLIM.net Company Profile |
SEC |
Zacks Reports |
StockTalk |
News |
Chart |
Request a new note
C
A N
S L
I M
|
FFIV
-
NASDAQ
F 5 Networks Inc
INTERNET - Internet Software and Services
|
$115.95
|
-3.60
-3.01% |
$120.30
|
2,635,729
98.83% of 50 DAV
50 DAV is 2,667,000
|
$127.95
-9.38%
|
6/16/2010
|
$74.50
|
PP = $74.10
|
|
MB = $77.81
|
Most Recent Note - 11/16/2010 4:26:15 PM
G - Pulling back from all-time highs, it is extended from any sound base pattern. Prior highs in the $112 area define initial chart support.
>>> The latest Featured Stock Update with an annotated graph appeared on 11/15/2010. Click here.
View all notes |
Alert me of new notes |
CANSLIM.net Company Profile |
SEC |
Zacks Reports |
StockTalk |
News |
Chart |
Request a new note
C
A N
S L
I M
|
Symbol/Exchange
Company Name
Industry Group |
PRICE |
CHANGE
(%Change) |
Day High |
Volume
(% DAV)
(% 50 day avg vol) |
52 Wk Hi
% From Hi |
Featured
Date |
Price
Featured |
Pivot Featured |
|
Max Buy |
FOSL
-
NASDAQ
Fossil Inc
CONSUMER DURABLES - Recreational Goods, Other
|
$65.86
|
-2.13
-3.13% |
$67.60
|
1,066,804
138.76% of 50 DAV
50 DAV is 768,800
|
$70.07
-6.01%
|
10/20/2010
|
$54.12
|
PP = $55.61
|
|
MB = $58.39
|
Most Recent Note - 11/16/2010 11:00:58 AM
G - Extended from any sound base, it is consolidating in a tight range for the past week with volume totals cooling. An upward trendline connecting its July-October lows defines support to watch above its 50 DMA line.
>>> The latest Featured Stock Update with an annotated graph appeared on 10/5/2010. Click here.
View all notes |
Alert me of new notes |
CANSLIM.net Company Profile |
SEC |
Zacks Reports |
StockTalk |
News |
Chart |
Request a new note
C
A N
S L
I M
|
HMSY
-
NASDAQ
H M S Holdings Corp
COMPUTER SOFTWARE and SERVICES - Healthcare Information Service
|
$60.46
|
-0.63
-1.03% |
$61.08
|
225,702
105.12% of 50 DAV
50 DAV is 214,700
|
$62.91
-3.89%
|
9/27/2010
|
$57.97
|
PP = $58.36
|
|
MB = $61.28
|
Most Recent Note - 11/15/2010 1:22:18 PM
Y - Perched less than -3% off its 52-week high with no resistance remaining due to overhead supply. Prompt support showed up near its 50 DMA line while trading was volatile near its latest earnings report. Any subsequent violation of its 50 DMA could raise greater concerns.
>>> The latest Featured Stock Update with an annotated graph appeared on 9/27/2010. Click here.
View all notes |
Alert me of new notes |
CANSLIM.net Company Profile |
SEC |
Zacks Reports |
StockTalk |
News |
Chart |
Request a new note
C
A N
S L
I M
|
HS
-
NYSE
Healthspring Inc
HEALTH SERVICES - Health Care Plans
|
$27.28
|
+0.07
0.26% |
$27.37
|
611,745
84.37% of 50 DAV
50 DAV is 725,100
|
$29.80
-8.46%
|
8/27/2010
|
$19.91
|
PP = $19.75
|
|
MB = $20.74
|
Most Recent Note - 11/15/2010 4:33:24 PM
G - Finished near the session low today -8.7% off its 52-week high, and volume totals have recently been cooling while consolidating above its 50 DMA line which acted as support.
>>> The latest Featured Stock Update with an annotated graph appeared on 10/22/2010. Click here.
View all notes |
Alert me of new notes |
CANSLIM.net Company Profile |
SEC |
Zacks Reports |
StockTalk |
News |
Chart |
Request a new note
C
A N
S L
I M
|
IGTE
-
NASDAQ
Igate Corp
COMPUTER SOFTWARE and SERVICES - Information Technology Service
|
$22.10
|
-0.55
-2.44% |
$22.78
|
780,165
111.90% of 50 DAV
50 DAV is 697,200
|
$22.90
-3.49%
|
10/26/2010
|
$17.29
|
PP = $19.55
|
|
MB = $20.53
|
Most Recent Note - 11/15/2010 4:37:00 PM
G - A small gain on below average volume today ended 5 cents off its best ever close. Extended from its latest base, its prior chart highs in the $19 area define initial chart support above its 50 DMA line.
>>> The latest Featured Stock Update with an annotated graph appeared on 11/11/2010. Click here.
View all notes |
Alert me of new notes |
CANSLIM.net Company Profile |
SEC |
Zacks Reports |
StockTalk |
News |
Chart |
Request a new note
C
A N
S L
I M
|
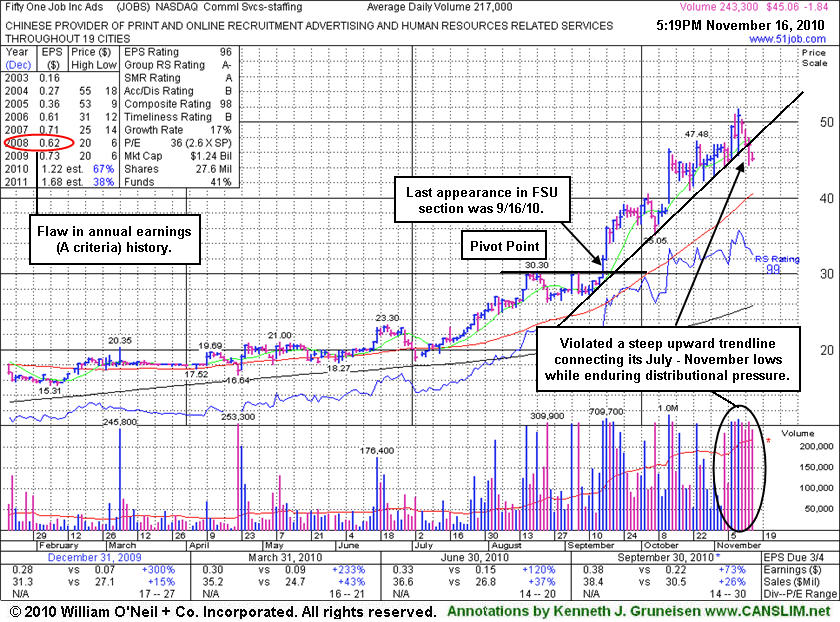
JOBS
-
NASDAQ
Fifty One Job Inc Ads
DIVERSIFIED SERVICES - Staffing and; Outsourcing Service
|
$45.06
|
-1.84
-3.92% |
$45.99
|
243,262
113.09% of 50 DAV
50 DAV is 215,100
|
$51.75
-12.93%
|
10/13/2010
|
$42.07
|
PP = $40.60
|
|
MB = $42.63
|
Most Recent Note - 11/16/2010 11:04:40 AM
G - Small gap down today followed another distribution day, and it has violated the previously noted initial support defined buy an upward trendline connecting its September-November lows. Its 50 DMA line is the next important support to watch.
>>> The latest Featured Stock Update with an annotated graph appeared on 11/16/2010. Click here.
View all notes |
Alert me of new notes |
CANSLIM.net Company Profile |
SEC |
Zacks Reports |
StockTalk |
News |
Chart |
Request a new note
C
A N
S L
I M
|
Symbol/Exchange
Company Name
Industry Group |
PRICE |
CHANGE
(%Change) |
Day High |
Volume
(% DAV)
(% 50 day avg vol) |
52 Wk Hi
% From Hi |
Featured
Date |
Price
Featured |
Pivot Featured |
|
Max Buy |
LFT
-
NYSE
Longtop Financl Tech Ads
COMPUTER SOFTWARE and SERVICES - Business Software and Services
|
$39.44
|
-0.05
-0.13% |
$39.74
|
571,945
111.04% of 50 DAV
50 DAV is 515,100
|
$42.86
-7.98%
|
11/5/2010
|
$41.83
|
PP = $40.96
|
|
MB = $43.01
|
Most Recent Note - 11/15/2010 10:06:26 AM
G - Violated prior highs in the $40-41 area and slumped quickly below its 50 DMA line today, raising concerns. Color code is changed to green, and only a prompt rebound above the $40 would help its outlook.
>>> The latest Featured Stock Update with an annotated graph appeared on 10/14/2010. Click here.
View all notes |
Alert me of new notes |
CANSLIM.net Company Profile |
SEC |
Zacks Reports |
StockTalk |
News |
Chart |
Request a new note
C
A N
S L
I M
|
LULU
-
NASDAQ
Lululemon Athletica
MANUFACTURING - Textile Manufacturing
|
$47.08
|
+0.38
0.81% |
$47.34
|
1,023,433
86.17% of 50 DAV
50 DAV is 1,187,700
|
$49.75
-5.37%
|
10/8/2010
|
$47.66
|
PP = $46.67
|
|
MB = $49.00
|
Most Recent Note - 11/16/2010 4:14:49 PM
Y - Finished higher after a gap down today, making a bullish "positive reversal" on the session. Its 50 DMA line is an initial support level above recent lows in the $42 area.
>>> The latest Featured Stock Update with an annotated graph appeared on 10/8/2010. Click here.
View all notes |
Alert me of new notes |
CANSLIM.net Company Profile |
SEC |
Zacks Reports |
StockTalk |
News |
Chart |
Request a new note
C
A N
S L
I M
|
MWIV
-
NASDAQ
M W I Veterinary Supply
HEALTH SERVICES - Medical Instruments and; Supplies
|
$57.45
|
-1.43
-2.43% |
$58.37
|
48,797
86.98% of 50 DAV
50 DAV is 56,100
|
$63.94
-10.15%
|
11/4/2010
|
$61.79
|
PP = $59.60
|
|
MB = $62.58
|
Most Recent Note - 11/16/2010 4:44:01 PM
Y - Small gap down today, testing its 50 DMA line which has been repeatedly noted as a very important support level.
>>> The latest Featured Stock Update with an annotated graph appeared on 11/2/2010. Click here.
View all notes |
Alert me of new notes |
CANSLIM.net Company Profile |
SEC |
Zacks Reports |
StockTalk |
News |
Chart |
Request a new note
C
A N
S L
I M
|
NEM
-
NYSE
Newmont Mining Corp
METALS and MINING - Gold
|
$59.39
|
-1.27
-2.09% |
$60.90
|
10,419,171
151.94% of 50 DAV
50 DAV is 6,857,200
|
$65.50
-9.33%
|
8/31/2010
|
$61.32
|
PP = $63.48
|
|
MB = $66.65
|
Most Recent Note - 11/16/2010 4:03:20 PM
G - Slumping toward recent lows and its 200 DMA line, its loss today on above average volume leaves it -10% off its 52-week high. Distributional action has raised concerns, meanwhile its Relative Strength rank has also slumped to a mediocre 60, well below the 80+ guideline. Recent lows in the $57 area define near-term support above its 200 DMA line. Based on weak action it will be dropped from the Featured Stocks list tonight.
>>> The latest Featured Stock Update with an annotated graph appeared on 11/10/2010. Click here.
View all notes |
Alert me of new notes |
CANSLIM.net Company Profile |
SEC |
Zacks Reports |
StockTalk |
News |
Chart |
Request a new note
C
A N
S L
I M
|
NEOG
-
NASDAQ
Neogen Corp
DRUGS - Diagnostic Substances
|
$35.08
|
-1.04
-2.88% |
$36.31
|
59,226
68.47% of 50 DAV
50 DAV is 86,500
|
$36.90
-4.93%
|
9/1/2010
|
$30.79
|
PP = $30.49
|
|
MB = $32.01
|
Most Recent Note - 11/16/2010 3:54:20 PM
G - Recently stalled after quietly claiming a new all-time high. Its 50 DMA line recently has been a reliable support level, while any subsequent violation could raise concerns and trigger sell signals.
>>> The latest Featured Stock Update with an annotated graph appeared on 10/13/2010. Click here.
View all notes |
Alert me of new notes |
CANSLIM.net Company Profile |
SEC |
Zacks Reports |
StockTalk |
News |
Chart |
Request a new note
C
A N
S L
I M
|
Symbol/Exchange
Company Name
Industry Group |
PRICE |
CHANGE
(%Change) |
Day High |
Volume
(% DAV)
(% 50 day avg vol) |
52 Wk Hi
% From Hi |
Featured
Date |
Price
Featured |
Pivot Featured |
|
Max Buy |
NFLX
-
NASDAQ
Netflix Inc
SPECIALTY RETAIL - Music and Video Stores
|
$165.40
|
-2.90
-1.72% |
$169.23
|
3,909,194
69.74% of 50 DAV
50 DAV is 5,605,300
|
$184.74
-10.47%
|
11/9/2010
|
$173.10
|
PP = $184.84
|
|
MB = $194.08
|
Most Recent Note - 11/15/2010 4:29:22 PM
Y - Consolidating near all-time highs, stubbornly holding its ground. It has formed an advanced "ascending base" type pattern marked by 3 pullbacks in the 10-20% range since its earlier technical breakout (on 8/10/10) from a double bottom base. Color code was changed to yellow with new pivot point cited based on its 52-week high plus ten cents. A subsequent breakout with heavy volume would signal a new (or add-on) technical buy signal, however it is a riskier "late stage" set-up.
>>> The latest Featured Stock Update with an annotated graph appeared on 10/1/2010. Click here.
View all notes |
Alert me of new notes |
CANSLIM.net Company Profile |
SEC |
Zacks Reports |
StockTalk |
News |
Chart |
Request a new note
C
A N
S L
I M
|
NTAP
-
NASDAQ
Netapp Inc
COMPUTER HARDWARE - Data Storage Devices
|
$52.69
|
-1.24
-2.30% |
$54.77
|
9,603,302
134.34% of 50 DAV
50 DAV is 7,148,300
|
$57.96
-9.09%
|
9/8/2010
|
$46.98
|
PP = $44.99
|
|
MB = $47.24
|
Most Recent Note - 11/16/2010 4:05:41 PM
G - Down on slightly above average volume today for a 4th consecutive loss. Its 50 DMA line ($50.93 now) and prior highs define important chart support to watch.
>>> The latest Featured Stock Update with an annotated graph appeared on 11/3/2010. Click here.
View all notes |
Alert me of new notes |
CANSLIM.net Company Profile |
SEC |
Zacks Reports |
StockTalk |
News |
Chart |
Request a new note
C
A N
S L
I M
|
ORCL
-
NASDAQ
Oracle Corp
COMPUTER SOFTWARE and SERVICES - Application Software
|
$27.58
|
-0.82
-2.89% |
$28.10
|
31,179,498
75.57% of 50 DAV
50 DAV is 41,258,100
|
$29.82
-7.51%
|
9/20/2010
|
$27.32
|
PP = $26.73
|
|
MB = $28.07
|
Most Recent Note - 11/16/2010 3:59:46 PM
Y - Loss today after a small gap down has it trading below its 50 DMA line, raising some concerns even while the volume total is below average. More damaging losses would raise greater concerns.
>>> The latest Featured Stock Update with an annotated graph appeared on 9/20/2010. Click here.
View all notes |
Alert me of new notes |
CANSLIM.net Company Profile |
SEC |
Zacks Reports |
StockTalk |
News |
Chart |
Request a new note
C
A N
S L
I M
|
PAY
-
NYSE
Verifone Systems Inc
COMPUTER HARDWARE - Transaction Automation Systems
|
$31.84
|
-0.80
-2.45% |
$32.50
|
673,785
52.32% of 50 DAV
50 DAV is 1,287,700
|
$35.94
-11.41%
|
8/25/2010
|
$24.30
|
PP = $23.74
|
|
MB = $24.93
|
Most Recent Note - 11/16/2010 3:56:37 PM
G - Slumping near prior highs ($31.40) and its 50 DMA line with volume totals still below average while consolidating. It has the look of an advanced "ascending base" pattern after an impressive rally from its 7/26/10 breakout.
>>> The latest Featured Stock Update with an annotated graph appeared on 10/25/2010. Click here.
View all notes |
Alert me of new notes |
CANSLIM.net Company Profile |
SEC |
Zacks Reports |
StockTalk |
News |
Chart |
Request a new note
C
A N
S L
I M
|
RAX
-
NYSE
Rackspace Hosting Inc
INTERNET - Internet Software and; Services
|
$26.65
|
-0.40
-1.48% |
$27.37
|
1,549,803
57.35% of 50 DAV
50 DAV is 2,702,400
|
$29.35
-9.20%
|
9/21/2010
|
$22.84
|
PP = $23.61
|
|
MB = $24.79
|
Most Recent Note - 11/15/2010 9:54:06 AM
G - Gapped down today, slumping toward prior highs near $26 that define initial chart support above its 50 DMA line. This high-ranked Internet - Network Solutions firm is -8% from last week's all-time highs.
>>> The latest Featured Stock Update with an annotated graph appeared on 9/21/2010. Click here.
View all notes |
Alert me of new notes |
CANSLIM.net Company Profile |
SEC |
Zacks Reports |
StockTalk |
News |
Chart |
Request a new note
C
A N
S L
I M
|
Symbol/Exchange
Company Name
Industry Group |
PRICE |
CHANGE
(%Change) |
Day High |
Volume
(% DAV)
(% 50 day avg vol) |
52 Wk Hi
% From Hi |
Featured
Date |
Price
Featured |
Pivot Featured |
|
Max Buy |
ROVI
-
NASDAQ
Rovi Corp
COMPUTER SOFTWARE andamp; SERVICES - Security Software andamp; Services
|
$52.02
|
-0.49
-0.93% |
$52.46
|
1,574,344
99.62% of 50 DAV
50 DAV is 1,580,400
|
$53.61
-2.97%
|
10/29/2010
|
$49.99
|
PP = $53.10
|
|
MB = $55.76
|
Most Recent Note - 11/15/2010 4:39:33 PM
Y - Holding its ground stubbornly, today it closed 62 cents off its best close of 2010. Volume totals have recently been drying up, a sign that only a few small investors are exiting. Disciplined investors will watch for subsequent gains above its pivot point with volume conviction that would trigger a new (or add-on) technical buy signal, and always limit losses if a stock falls more than -7% from the purchase price, per the system guidelines. Initial support to watch is defined by its 50 DMA line, then its prior chart low, where violations would trigger technical sell signals.
>>> The latest Featured Stock Update with an annotated graph appeared on 10/20/2010. Click here.
View all notes |
Alert me of new notes |
CANSLIM.net Company Profile |
SEC |
Zacks Reports |
StockTalk |
News |
Chart |
Request a new note
C
A N
S L
I M
|
SHOO
-
NASDAQ
Steven Madden Limited
CONSUMER NON-DURABLES - Textile - Apparel Footwear
|
$41.29
|
-0.10
-0.24% |
$41.57
|
263,602
76.25% of 50 DAV
50 DAV is 345,700
|
$44.85
-7.94%
|
9/15/2010
|
$38.94
|
PP = $40.27
|
|
MB = $42.28
|
Most Recent Note - 11/15/2010 4:48:43 PM
G - Still finding support just above its 50 DMA line and prior chart highs in the $40 area. More damaging losses leading to a close below its short-term average would raise concerns and trigger technical sell signals.
>>> The latest Featured Stock Update with an annotated graph appeared on 9/29/2010. Click here.
View all notes |
Alert me of new notes |
CANSLIM.net Company Profile |
SEC |
Zacks Reports |
StockTalk |
News |
Chart |
Request a new note
C
A N
S L
I M
|
SLW
-
NYSE
Silver Wheaton Corp
METALS and; MINING - Silver
|
$31.69
|
-1.30
-3.94% |
$31.90
|
18,597,909
214.28% of 50 DAV
50 DAV is 8,679,400
|
$37.20
-14.81%
|
8/25/2010
|
$21.40
|
PP = $21.99
|
|
MB = $23.09
|
Most Recent Note - 11/16/2010 10:24:48 AM
G - Gapped down today. Recently noted - "Very extended from any sound base, it has been sputtering since its worrisome negative reversal on 11/09/10. Its 50 DMA line and prior highs in the $28 area define the nearest chart support."
>>> The latest Featured Stock Update with an annotated graph appeared on 10/18/2010. Click here.
View all notes |
Alert me of new notes |
CANSLIM.net Company Profile |
SEC |
Zacks Reports |
StockTalk |
News |
Chart |
Request a new note
C
A N
S L
I M
|
UA
-
NYSE
Under Armour Inc Cl A
CONSUMER NON-DURABLES - Textile - Apparel Clothing
|
$50.00
|
+0.29
0.58% |
$51.39
|
723,179
93.80% of 50 DAV
50 DAV is 771,000
|
$52.30
-4.40%
|
9/9/2010
|
$39.99
|
PP = $40.10
|
|
MB = $42.11
|
Most Recent Note - 11/16/2010 4:34:02 PM
G - Extended from any sound base and support at its 50 DMA line, it posted a gain today and bucked a mostly negative market. It has not encountered any distributional pressure and could produce more climactic gains. Some fundamental flaws with respect to the fact-based investment system have been recently noted as concerns.
>>> The latest Featured Stock Update with an annotated graph appeared on 11/4/2010. Click here.
View all notes |
Alert me of new notes |
CANSLIM.net Company Profile |
SEC |
Zacks Reports |
StockTalk |
News |
Chart |
Request a new note
C
A N
S L
I M
|
ULTA
-
NASDAQ
Ulta Salon Cosm & Frag
SPECIALTY RETAIL - Specialty Retail, Other
|
$31.57
|
-0.23
-0.72% |
$31.72
|
367,983
66.87% of 50 DAV
50 DAV is 550,300
|
$33.50
-5.76%
|
9/3/2010
|
$26.36
|
PP = $25.89
|
|
MB = $27.18
|
Most Recent Note - 11/15/2010 4:50:38 PM
G - Volume totals have been continually drying up since its big gain on 10/12/10. It is within close striking distance of its 52-week highs and its all-time high of $35.63 in Nov '07. Its 50 DMA line defines initial support to watch above prior chart highs in the $26 area. It could produce more climactic gains, however it is currently extended from any sound base.
>>> The latest Featured Stock Update with an annotated graph appeared on 11/1/2010. Click here.
View all notes |
Alert me of new notes |
CANSLIM.net Company Profile |
SEC |
Zacks Reports |
StockTalk |
News |
Chart |
Request a new note
C
A N
S L
I M
|
Symbol/Exchange
Company Name
Industry Group |
PRICE |
CHANGE
(%Change) |
Day High |
Volume
(% DAV)
(% 50 day avg vol) |
52 Wk Hi
% From Hi |
Featured
Date |
Price
Featured |
Pivot Featured |
|
Max Buy |
VIT
-
NYSE
Vanceinfo Tech Inc Ads
COMPUTER SOFTWARE and SERVICES - Business Software and Services
|
$34.42
|
-0.72
-2.05% |
$34.77
|
425,430
70.04% of 50 DAV
50 DAV is 607,400
|
$38.43
-10.43%
|
7/8/2010
|
$25.20
|
PP = $26.58
|
|
MB = $27.91
|
Most Recent Note - 11/16/2010 4:11:16 PM
G - After mild distributional pressure it is consolidating near its 50 DMA line that defines important chart support to watch. It is not near any sound base.
>>> The latest Featured Stock Update with an annotated graph appeared on 10/21/2010. Click here.
View all notes |
Alert me of new notes |
CANSLIM.net Company Profile |
SEC |
Zacks Reports |
StockTalk |
News |
Chart |
Request a new note
C
A N
S L
I M
|