You are not logged in.
This means you
CAN ONLY VIEW reports that were published prior to Sunday, February 25, 2024.
You
MUST UPGRADE YOUR MEMBERSHIP if you want to see any current reports.
AFTER MARKET UPDATE - FRIDAY, NOVEMBER 15TH, 2019
Previous After Market Report Next After Market Report >>>
|
|
|
|
DOW |
+222.93 |
28,004.89 |
+0.80% |
|
Volume |
859,043,670 |
+19% |
|
Volume |
2,187,689,590 |
+5% |
|
NASDAQ |
+61.81 |
8,540.83 |
+0.73% |
|
Advancers |
1,787 |
63% |
|
Advancers |
1,862 |
60% |
|
S&P 500 |
+23.83 |
3,120.46 |
+0.77% |
|
Decliners |
1,070 |
37% |
|
Decliners |
1,223 |
40% |
|
Russell 2000 |
+7.66 |
1,596.45 |
+0.48% |
|
52 Wk Highs |
120 |
|
|
52 Wk Highs |
168 |
|
|
S&P 600 |
+4.83 |
982.71 |
+0.49% |
|
52 Wk Lows |
55 |
|
|
52 Wk Lows |
115 |
|
|
 |
Major Indices Rally With Greater Volume and More Leadership
Kenneth J. Gruneisen - Passed the CAN SLIM® Master's Exam
The S&P 500 rose 0.8%, posting a sixth-straight weekly gain, the longest such stretch since 2017. The Dow climbed 222 points, hitting the 28,000 level for the first time, while the Nasdaq Composite was up 0.7%. For the week, the Dow rallied 1.2%, the S&P gained 0.9%, and the Nasdaq Composite advanced 0.8%. Advancers led decliners by a 3-2 margin on the NYSE and on the Nasdaq exchange. Volume totals reported were higher than the prior session on both major exchanges, indicative of greater institutional buying demand. There were 74 high-ranked companies from the Leaders List that hit a new 52-week high and were listed on the BreakOuts Page, versus the total of 45 on the prior session. New 52-week highs totals solidly outnumbered new 52-week lows totals on the NYSE and on the Nasdaq exchange for the 2nd consecutive session. The major indices (M criteria) are in a "confirmed uptrend" after enduring distributional pressure in recent weeks. The Featured Stocks Page provides the most timely analysis on high-ranked leaders. Charts used courtesy of www.stockcharts.com
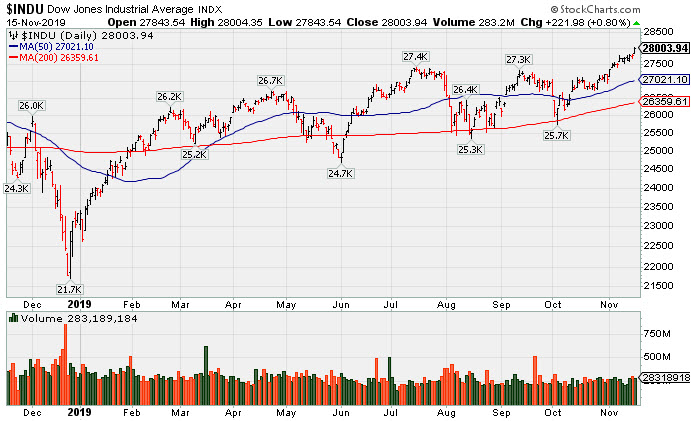
PICTURED: The Dow Jones Industrial Average hit a new record high.
Stocks finished higher Friday as positive trade comments propelled all three major averages to new record closing levels. White House economic advisor Larry Kudlow reported that Washington is “getting close” to solidifying an initial trade deal with Beijing. Separately, Commerce Secretary Wilbur Ross offered reassurance that the two sides remain likely to strike an accord, but the fine details still need to be worked out.
On the data front, retail sales rose 0.3% in October, rebounding from the prior month’s equivalent drop. However, the core measure was downwardly revised for September. Separately, industrial production fell 0.8% last month, worse than the forecasted 0.4% dip. Treasuries weakened slightly, with the yield on the 10-year note up one basis point to 1.83%. In commodities, WTI crude gained 1.7% to $57.72/barrel, notching a second-straight weekly advance as trade optimism overshadowed concerns of a supply glut.
Ten of 11 S&P 500 sectors closed in positive territory, with Materials the sole decliner. Health Care shares paced gains, adding more than 2%. In earnings, Applied Materials (AMAT +8.95%) hit a new all-time high following an earnings beat that included an increase in forward guidance. NVIDIA Corp. (NVDA -2.67%) fell after the chipmaker topped analyst profit estimates but offered a disappointing current-quarter forecast.
|
 Kenneth J. Gruneisen started out as a licensed stockbroker in August 1987, a couple of months prior to the historic stock market crash that took the Dow Jones Industrial Average down -22.6% in a single day. He has published daily fact-based fundamental and technical analysis on high-ranked stocks online for two decades. Through FACTBASEDINVESTING.COM, Kenneth provides educational articles, news, market commentary, and other information regarding proven investment systems that work in good times and bad.
Comments contained in the body of this report are technical opinions only and are not necessarily those of Gruneisen Growth Corp. The material herein has been obtained from sources believed to be reliable and accurate, however, its accuracy and completeness cannot be guaranteed. Our firm, employees, and customers may effect transactions, including transactions contrary to any recommendation herein, or have positions in the securities mentioned herein or options with respect thereto. Any recommendation contained in this report may not be suitable for all investors and it is not to be deemed an offer or solicitation on our part with respect to the purchase or sale of any securities. |
|
 |
Financial, Tech, and Energy-Linked Groups Rose
Kenneth J. Gruneisen - Passed the CAN SLIM® Master's Exam
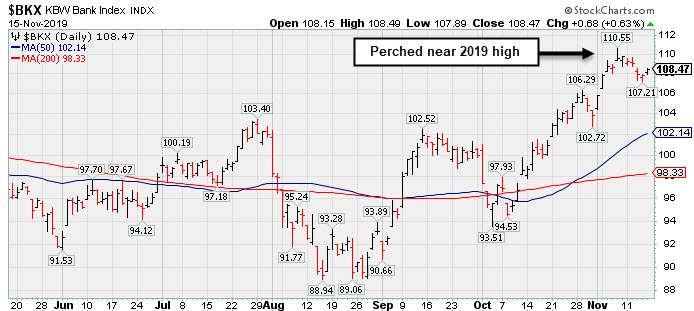
The Broker/Dealer Index ($XBD +1.08%) and the Bank Index ($BKX +0.63%) both ended the session with solid gains while the Retail Index ($RLX -0.02%) finished flat. The tech sector had a positive bias as the Biotech Index ($BTK +1.95%) outpaced the Networking Index ($NWX +1.00%) and the Semiconductor Index ($SOX +0.89%). The Oil Services Index ($OSX +1.91%) outpaced the Integrated Oil Index ($XOI +0.42%), meanwhile the Gold & Silver Index ($XAU -0.35%) edged lower.
PICTURED: The Bank Index ($BKX +0.63%) is perched near its 2019 high.
| Oil Services |
$OSX |
67.58 |
+1.27 |
+1.92% |
-16.15% |
| Integrated Oil |
$XOI |
1,241.21 |
+5.17 |
+0.42% |
+7.08% |
| Semiconductor |
$SOX |
1,742.93 |
+15.34 |
+0.89% |
+50.88% |
| Networking |
$NWX |
583.51 |
+5.79 |
+1.00% |
+19.41% |
| Broker/Dealer |
$XBD |
276.26 |
+2.95 |
+1.08% |
+16.40% |
| Retail |
$RLX |
2,383.30 |
-0.59 |
-0.02% |
+22.13% |
| Gold & Silver |
$XAU |
93.61 |
-0.33 |
-0.35% |
+32.48% |
| Bank |
$BKX |
108.47 |
+0.68 |
+0.63% |
+26.44% |
| Biotech |
$BTK |
4,670.23 |
+89.50 |
+1.95% |
+10.65% |
|
|
|
 |
Showing Resilience After Latest Quarter Missed Minimum Guidelines
Kenneth J. Gruneisen - Passed the CAN SLIM® Master's Exam
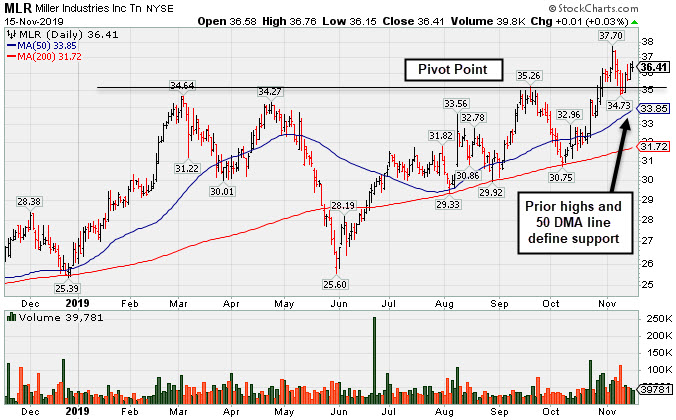
Miller Industries Inc (MLR +$0.01 or +0.03% to $36.41) remains perched near its all-time high. It reported earnings -7% on +0% sales revenues for the Sep '19 quarter versus the year ago period, below the +25% minimum guideline (C criteria) raising fundamental concerns. It retreated from its 52-week high with recent losses backed by above average volume. Prior highs in the $35 area define initial support above its 50-day moving average (DMA) line ($33.85).
MLR's annual earnings history (A criteria) has been good. The very small supply of only 11.4 million shares outstanding (S criteria) can contribute to greater price volatility in the event of institutional buying or selling. It returned to the Featured Stocks list on 9/24/19 when highlighted in yellow in the mid-day report (read here). It was last shown in this FSU section on 10/29/19 with an annotated graph under the headline, "Hit New High But Did Not Close Session Above Pivot Point"
The number of top-rated funds owning its shares rose from 196 in Mar '18 to 250 in Sep '19, a reassuring sign concerning the I criteria. The current Up/Down Volume Ratio of 1.1 is an unbiased indication its shares have been under only slight accumulation over the past 50 days. It has earned a B Timeliness rating and a E Sponsorship Rating.
Charts courtesy of www.stockcharts.com
 |
|
|
Color Codes Explained :
Y - Better candidates highlighted by our
staff of experts.
G - Previously featured
in past reports as yellow but may no longer be buyable under the
guidelines.
***Last / Change / Volume data in this table is the closing quote data***
Symbol/Exchange
Company Name
Industry Group |
PRICE |
CHANGE
(%Change) |
Day High |
Volume
(% DAV)
(% 50 day avg vol) |
52 Wk Hi
% From Hi |
Featured
Date |
Price
Featured |
Pivot Featured |
|
Max Buy |
 MLR
-
NYSE
MLR
-
NYSE
Miller Industries Inc
AUTOMOTIVE - Auto Parts
|
$36.41
|
+0.01
0.03% |
$36.76
|
39,781
92.51% of 50 DAV
50 DAV is 43,000
|
$37.70
-3.42%
|
9/24/2019
|
$34.00
|
PP = $35.36
|
|
MB = $37.13
|
 Most Recent Note - 11/15/2019 5:26:12 PM
Y - Showed resilience after recently reporting earnings which were below the fundamental guidelines of the fact-based investment system. Prior highs in the $35 area define initial support above its 50 DMA line ($33.85). See the latest FSU analysis for more details and a new annotated graph.
>>> FEATURED STOCK ARTICLE : Showing Resilience After Latest Quarter Missed Minimum Guidelines - 11/15/2019 |
View all notes |
Set NEW NOTE alert |
Company Profile |
SEC
News |
Chart |
Request a new note
C
A
S
I |
CCBG
-
NASDAQ
Capital City Bk Gp
BANKING - Regional - Mid-Atlantic Banks
|
$29.47
|
-0.28
-0.94% |
$29.98
|
34,229
95.08% of 50 DAV
50 DAV is 36,000
|
$30.85
-4.47%
|
9/13/2019
|
$27.03
|
PP = $27.05
|
|
MB = $28.40
|
Most Recent Note - 11/13/2019 5:31:23 PM
G - Sputtering since a noted "negative reversal" on 11/07/19 after hitting another new 52-week high. Extended from the prior base. Prior highs define important support to watch along with its 50 DMA line ($27.51).
>>> FEATURED STOCK ARTICLE : Noted "Positive Reversal" on Volatile Session After Earnings - 10/31/2019 |
View all notes |
Set NEW NOTE alert |
Company Profile |
SEC
News |
Chart |
Request a new note
C
A
S
I |
FTNT
-
NASDAQ
Fortinet Inc
Computer Sftwr-Security
|
$101.54
|
+1.42
1.42% |
$101.64
|
1,313,287
98.45% of 50 DAV
50 DAV is 1,334,000
|
$100.85
0.68%
|
11/11/2019
|
$97.14
|
PP = $97.06
|
|
MB = $101.91
|
Most Recent Note - 11/12/2019 5:44:40 PM
Y - Posted a solid gain above its new pivot point today backed by +85% above average volume triggering a new (or add-on) technical buy signal. Gapped up on 11/01/19 helping its outlook to improve. Bullish action came after it reported earnings +37% on +21% sales revenues for the Sep '19 quarter versus the year ago period. See the latest FSU analysis for more details and an annotated graph.
>>> FEATURED STOCK ARTICLE : Reversed Into Red Today After Touching New High - 11/11/2019 |
View all notes |
Set NEW NOTE alert |
Company Profile |
SEC
News |
Chart |
Request a new note
C
A
S
I |
AUDC
-
NASDAQ
Audiocodes Ltd
ELECTRONICS - Scientific and Technical Instrum
|
$23.42
|
+1.42
6.45% |
$23.95
|
924,622
359.78% of 50 DAV
50 DAV is 257,000
|
$22.50
4.09%
|
9/13/2019
|
$19.68
|
PP = $19.84
|
|
MB = $20.83
|
Most Recent Note - 11/15/2019 11:48:06 AM
G - Powering to a new all-time high with today's gap up and big gain backed by above average volume. Its 50 DMA line ($19.68) and recent low ($17.54 on 10/08/19) define important near-term support levels to watch. Bullish action came after it reported earnings +26% on +15% sales revenues for the Sep '19 quarter, continuing its strong earnings track record.
>>> FEATURED STOCK ARTICLE : Audiocodes is Quietly Perched Near its All-Time High - 11/7/2019 |
View all notes |
Set NEW NOTE alert |
Company Profile |
SEC
News |
Chart |
Request a new note
C
A
S
I |
CHDN
-
NASDAQ
Churchill Downs Inc
LEISURE - Gaming Activities
|
$126.51
|
+0.05
0.04% |
$127.32
|
171,898
61.61% of 50 DAV
50 DAV is 279,000
|
$135.32
-6.51%
|
10/8/2019
|
$129.77
|
PP = $132.83
|
|
MB = $139.47
|
Most Recent Note - 11/11/2019 11:46:18 AM
G - Technically, meeting resistance at its 50 DMA line ($126.53) when trying to rebound following damaging volume-driven losses last week. Reported Sep '19 earnings +4% on +38% sales revenues versus the year ago period, its 2nd consecutive quarterly comparison below the +25% minimum earnings guideline (C criteria), raising greater fundamental concerns.
>>> FEATURED STOCK ARTICLE : Perched at Record High at Time of Quarterly Report - 10/30/2019 |
View all notes |
Set NEW NOTE alert |
Company Profile |
SEC
News |
Chart |
Request a new note
C
A
S
I |
Symbol/Exchange
Company Name
Industry Group |
PRICE |
CHANGE
(%Change) |
Day High |
Volume
(% DAV)
(% 50 day avg vol) |
52 Wk Hi
% From Hi |
Featured
Date |
Price
Featured |
Pivot Featured |
|
Max Buy |
LULU
-
NASDAQ
Lululemon Athletica
MANUFACTURING - Textile Manufacturing
|
$215.91
|
+2.69
1.26% |
$216.05
|
1,483,007
79.60% of 50 DAV
50 DAV is 1,863,000
|
$213.64
1.06%
|
9/6/2019
|
$201.25
|
PP = $194.35
|
|
MB = $204.07
|
Most Recent Note - 11/11/2019 11:49:05 AM
G - After wedging higher with gains lacking great volume conviction it found prompt support again near its 50 DMA line ($197.41). The prior low ($185.36 on 10/03/19) defines the next important near-term support.
>>> FEATURED STOCK ARTICLE : Testing 50-Day Moving Average With Loss on Above Average Volume - 11/4/2019 |
View all notes |
Set NEW NOTE alert |
Company Profile |
SEC
News |
Chart |
Request a new note
C
A
S
I |
CPRT
-
NASDAQ
Copart Inc
SPECIALTY RETAIL - Auto Dealerships
|
$85.99
|
+0.17
0.20% |
$86.55
|
1,767,685
120.17% of 50 DAV
50 DAV is 1,471,000
|
$85.86
0.15%
|
9/5/2019
|
$79.13
|
PP = $79.84
|
|
MB = $83.83
|
Most Recent Note - 11/11/2019 11:47:40 AM
Y - Still consolidating below its "max buy" level and finding support above its 50 DMA line ($81.47). The 50 DMA line defines near-term support above the prior low ($76.35 on 10/03/19). Wedged to new all-time highs with recent gains lacking great volume conviction.
>>> FEATURED STOCK ARTICLE : Testing Support at 50-Day Moving Average - 11/6/2019 |
View all notes |
Set NEW NOTE alert |
Company Profile |
SEC
News |
Chart |
Request a new note
C
A
S
I |
NMIH
-
NASDAQ
N M I Holdings Inc Cl A
Finance-MrtgandRel Svc
|
$34.09
|
+0.20
0.59% |
$34.28
|
978,103
230.68% of 50 DAV
50 DAV is 424,000
|
$34.50
-1.19%
|
11/8/2019
|
$32.89
|
PP = $31.44
|
|
MB = $33.01
|
Most Recent Note - 11/12/2019 5:46:14 PM
G - Color code is changed to green after rising above its "max buy" level with today's gain backed by near average volume. Reported earnings +54% on +42% sales revenues for the Sep '19 quarter, and prior quarterly comparisons were also well above the +25% minimum guideline (C criteria). After years of losses it had profitable years for FY '16, '17, and '18.
>>> FEATURED STOCK ARTICLE : Hit New High With Volume-Driven Gains - 11/8/2019 |
View all notes |
Set NEW NOTE alert |
Company Profile |
SEC
News |
Chart |
Request a new note
C
A
S
I |
BLD
-
NYSE
Topbuild Corp
Bldg-Constr Prds/Misc
|
$107.29
|
-2.23
-2.04% |
$109.78
|
170,387
60.21% of 50 DAV
50 DAV is 283,000
|
$111.48
-3.76%
|
5/17/2019
|
$82.19
|
PP = $87.31
|
|
MB = $91.68
|
Most Recent Note - 11/12/2019 5:43:01 PM
G - Extended from any sound base and consolidating after volume-driven gains for new all-time highs. Reported earnings +24% on +5% sales revenues for the Sep '19 quarter versus the year ago period, just below the +25% minimum guideline (C criteria). Found prompt support near its 50 DMA line ($98.13) during its ongoing ascent. See the latest FSU analysis for more details and a new annotated graph.
>>> FEATURED STOCK ARTICLE : Perched Near High Following Recent Volume-Driven Gains - 11/12/2019 |
View all notes |
Set NEW NOTE alert |
Company Profile |
SEC
News |
Chart |
Request a new note
C
A
S
I |
GLOB
-
NYSE
Globant SA
Computer-Tech Services
|
$99.83
|
-9.43
-8.63% |
$109.00
|
692,335
307.70% of 50 DAV
50 DAV is 225,000
|
$112.33
-11.13%
|
11/14/2019
|
$106.87
|
PP = $112.43
|
|
MB = $118.05
|
Most Recent Note - 11/15/2019 11:57:13 AM
Y - Reported earnings +35% on +27% sales revenues for the Sep '19 quarter. Abruptly retreating today after an impressive streak of 12 consecutive gains. It was highlighted in yellow with new pivot point cited based on its 8/01/19 high plus 10 cents in the prior mid-day report and noted - "Subsequent volume-driven gains above the pivot point may trigger a technical buy signal. Due to report Sep '19 quarterly results. Volume and volatility often increase near earnings news. Found support near its 200 DMA line during the consolidation since dropped from the Featured Stocks list on 8/19/19. Reported earnings +33% on +23% sales revenues for the Jun '19 quarter continuing its strong earning track record." See the latest FSU analysis for more details and an annotated graph.
>>> FEATURED STOCK ARTICLE : Rallying Near High With 12th Consecutive Gain - 11/14/2019 |
View all notes |
Set NEW NOTE alert |
Company Profile |
SEC
News |
Chart |
Request a new note
C
A
S
I |
Symbol/Exchange
Company Name
Industry Group |
PRICE |
CHANGE
(%Change) |
Day High |
Volume
(% DAV)
(% 50 day avg vol) |
52 Wk Hi
% From Hi |
Featured
Date |
Price
Featured |
Pivot Featured |
|
Max Buy |
|
|
|
THESE ARE NOT BUY RECOMMENDATIONS!
Comments contained in the body of this report are technical
opinions only. The material herein has been obtained
from sources believed to be reliable and accurate, however,
its accuracy and completeness cannot be guaranteed.
This site is not an investment advisor, hence it does
not endorse or recommend any securities or other investments.
Any recommendation contained in this report may not
be suitable for all investors and it is not to be deemed
an offer or solicitation on our part with respect to
the purchase or sale of any securities. All trademarks,
service marks and trade names appearing in this report
are the property of their respective owners, and are
likewise used for identification purposes only.
This report is a service available
only to active Paid Premium Members.
You may opt-out of receiving report notifications
at any time. Questions or comments may be submitted
by writing to Premium Membership Services 665 S.E. 10 Street, Suite 201 Deerfield Beach, FL 33441-5634 or by calling 1-800-965-8307
or 954-785-1121.
|
|
|