You are not logged in.
This means you
CAN ONLY VIEW reports that were published prior to Thursday, March 20, 2025.
You
MUST UPGRADE YOUR MEMBERSHIP if you want to see any current reports.
AFTER MARKET UPDATE - TUESDAY, OCTOBER 29TH, 2019
Previous After Market Report Next After Market Report >>>
|
|
|
|
DOW |
-19.26 |
27,071.46 |
-0.07% |
|
Volume |
808,080,080 |
+4% |
|
Volume |
1,813,584,000 |
-7% |
|
NASDAQ |
-49.14 |
8,276.85 |
-0.59% |
|
Advancers |
1,494 |
52% |
|
Advancers |
1,545 |
50% |
|
S&P 500 |
-2.53 |
3,036.89 |
-0.08% |
|
Decliners |
1,357 |
48% |
|
Decliners |
1,527 |
50% |
|
Russell 2000 |
+5.14 |
1,577.07 |
+0.33% |
|
52 Wk Highs |
146 |
|
|
52 Wk Highs |
136 |
|
|
S&P 600 |
+3.82 |
980.36 |
+0.39% |
|
52 Wk Lows |
34 |
|
|
52 Wk Lows |
72 |
|
|
 |
Major Indices Dipped Ahead of Next Fed Decision
Kenneth J. Gruneisen - Passed the CAN SLIM® Master's Exam
The S&P 500 dipped 0.1%, pulling back from a fresh intra-day record high reached earlier in the session. The Dow lost 19 points, while the Nasdaq Composite fell 0.6%. Volume totals reported were mixed, lighter than the prior session total on the Nasdaq exchange and higher on the NYSE. Advancers led decliners by a narrow margin on the NYSE and on the Nasdaq exchange. There were 80 high-ranked companies from the Leaders List that hit a new 52-week high and were listed on the BreakOuts Page, versus the total of 79 on the prior session. New 52-week highs outnumbered new 52-week lows on the NYSE and on the Nasdaq exchange. The major indices (M criteria) are in a "confirmed uptrend" after enduring distributional pressure in recent weeks. The Featured Stocks Page provides the most timely analysis on high-ranked leaders. Charts used courtesy of www.stockcharts.com
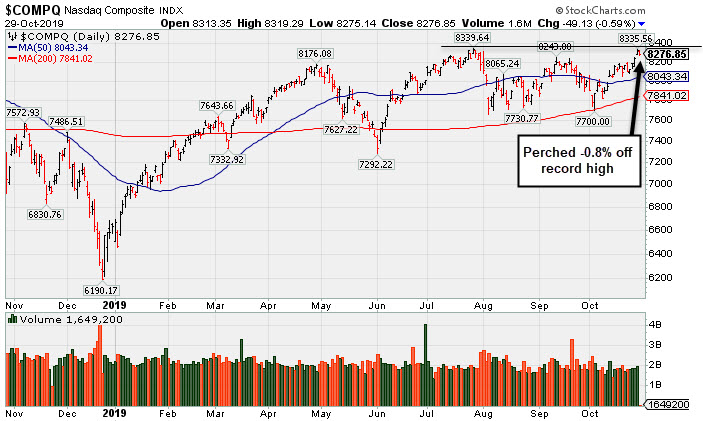
PICTURED: The Nasdaq Composite Index is perched -0.8% off its record high.
Stocks finished lower Tuesday, as investors digested a slew of third-quarter earnings reports and looked ahead to tomorrow’s Federal Reserve policy decision. The Health Care group outperformed with Pfizer (PFE +2.49%) and Merck (MRK +3.53%) both advancing following positive earnings releases that included a boost to their respective full-year outlooks. The Communication Services sector lagged with Google parent Alphabet (GOOGL -2.20%) retreating from their record high after its profit tally fell short of Wall Street expectations. Shares of BP Plc (BP -3.34%) fell after reporting a sharp decline in profits. General Motors (GM +4.28%) climbed as solid U.S. sales of trucks and SUVs outweighed the implications of a 40-day labor strike. GrubHub (GRUB -43.30%) sank after the food delivery service widely missed consensus earnings estimates, inciting a handful of analyst downgrades.
A report that the U.S. and China may not sign a partial deal next month tempered optimism a day after both sides noted progress of the “phase one” trade pact. Treasuries modestly advanced, with the yield on the 10-year note down one basis point to 1.83%. On the data front, the Conference Board’s consumer confidence index came in at 125.9 in October, missing expectations of 128.0. Separately, pending home sales advanced 1.5% in September, while another report from S&P CoreLogic Case Shiller showed home prices in 20 U.S. cities rose at an annualized 2.03% clip in August.
|
 Kenneth J. Gruneisen started out as a licensed stockbroker in August 1987, a couple of months prior to the historic stock market crash that took the Dow Jones Industrial Average down -22.6% in a single day. He has published daily fact-based fundamental and technical analysis on high-ranked stocks online for two decades. Through FACTBASEDINVESTING.COM, Kenneth provides educational articles, news, market commentary, and other information regarding proven investment systems that work in good times and bad.
Comments contained in the body of this report are technical opinions only and are not necessarily those of Gruneisen Growth Corp. The material herein has been obtained from sources believed to be reliable and accurate, however, its accuracy and completeness cannot be guaranteed. Our firm, employees, and customers may effect transactions, including transactions contrary to any recommendation herein, or have positions in the securities mentioned herein or options with respect thereto. Any recommendation contained in this report may not be suitable for all investors and it is not to be deemed an offer or solicitation on our part with respect to the purchase or sale of any securities. |
|
 |
Tech and Retail Indexes Fell; Commodity-Linked Groups Rose
Kenneth J. Gruneisen - Passed the CAN SLIM® Master's Exam
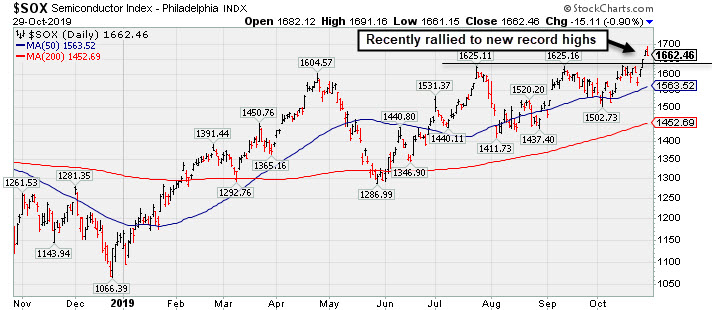
Financial shares had a slightly positive bias as the Broker/Dealer Index ($XBD +0.12%) and the Bank Index ($BKX +0.16%) inched higher, but the Retail Index ($RLX -0.93%) created a big drag on the major indices. The tech sector had a negative bias as the Semiconductor Index ($SOX -0.90%) and the Networking Index ($NWX -0.56%) both outpaced the Biotech Index ($BTK -0.13%) to the downside. Commodity-linked groups had a positive bias as the Oil Services Index ($OSX +2.63%) and the Integrated Oil Index ($XOI +0.46%) rose along with the Gold & Silver Index ($XAU +0.70%).
PICTURED: The Semiconductor Index ($SOX -0.90%) recently rallied to a new record high.
| Oil Services |
$OSX |
68.79 |
+1.76 |
+2.63% |
-14.65% |
| Integrated Oil |
$XOI |
1,252.71 |
+5.74 |
+0.46% |
+8.08% |
| Semiconductor |
$SOX |
1,662.46 |
-15.11 |
-0.90% |
+43.91% |
| Networking |
$NWX |
554.99 |
-3.11 |
-0.56% |
+13.57% |
| Broker/Dealer |
$XBD |
267.33 |
+0.32 |
+0.12% |
+12.64% |
| Retail |
$RLX |
2,389.48 |
-22.41 |
-0.93% |
+22.45% |
| Gold & Silver |
$XAU |
92.46 |
+0.64 |
+0.70% |
+30.85% |
| Bank |
$BKX |
105.77 |
+0.17 |
+0.16% |
+23.29% |
| Biotech |
$BTK |
4,467.75 |
-5.71 |
-0.13% |
+5.85% |
|
|
|
 |
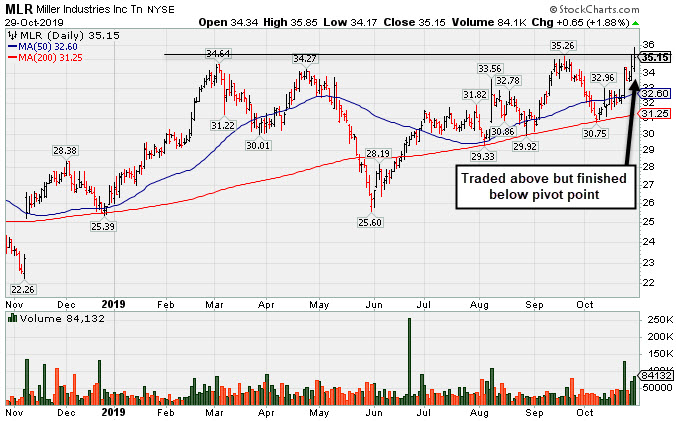
Hit New High But Did Not Close Session Above Pivot Point
Kenneth J. Gruneisen - Passed the CAN SLIM® Master's Exam
Miller Industries Inc (MLR +$0.65 or +1.88% to $35.15) traded above but finished the session below its pivot point. Subsequent gains and a close above the pivot point backed by at least +40% above average volume may trigger a technical buy signal.
Keep in mind it is due to report earnings news on November 7th. Volume and volatility often increase near earnings news. June '19 quarterly earnings rose +40% on +26% sales revenues versus the year ago period, and 3 of the past 4 comparisons were above the +25% minimum earnings guideline (C criteria). Annual earnings history (A criteria) has also been good. Very small supply of only 11.4 million shares outstanding (S criteria) can contribute to greater price volatility in the event of institutional buying or selling.
MLR returned to the Featured Stocks list on 9/24/19 when highlighted in yellow in the mid-day report (read here). It has shown bullish action since last shown in this FSU section on 10/09/19 with an annotated graph under the headline, "Tested Support at Long-Term 200-Day Moving Average"
The number of top-rated funds owning its shares rose from 196 in Mar '18 to 249 in Sep '19, a reassuring sign concerning the I criteria. The current Up/Down Volume Ratio of 1.2 is an unbiased indication its shares have been under accumulation over the past 50 days. It has earned a B Timeliness rating and a E Sponsorship Rating.
Charts courtesy of www.stockcharts.com
 |
|
|
Color Codes Explained :
Y - Better candidates highlighted by our
staff of experts.
G - Previously featured
in past reports as yellow but may no longer be buyable under the
guidelines.
***Last / Change / Volume data in this table is the closing quote data***
Symbol/Exchange
Company Name
Industry Group |
PRICE |
CHANGE
(%Change) |
Day High |
Volume
(% DAV)
(% 50 day avg vol) |
52 Wk Hi
% From Hi |
Featured
Date |
Price
Featured |
Pivot Featured |
|
Max Buy |
 MLR
-
NYSE
MLR
-
NYSE
Miller Industries Inc
AUTOMOTIVE - Auto Parts
|
$35.15
|
+0.65
1.88% |
$35.85
|
84,132
262.91% of 50 DAV
50 DAV is 32,000
|
$35.28
-0.37%
|
9/24/2019
|
$34.00
|
PP = $35.36
|
|
MB = $37.13
|
 Most Recent Note - 10/29/2019 5:13:20 PM
Y - Color code was changed to yellow while hitting a new high as it traded above the pivot point today but closed the session below it. Subsequent gains and a close above the pivot point backed by at least +40% above average volume may trigger a convincing technical buy signal. Fundamentals remain strong. See the latest FSU analysis for more details and a new annotated graph.
>>> FEATURED STOCK ARTICLE : Hit New High But Did Not Close Session Above Pivot Point - 10/29/2019 |
View all notes |
Set NEW NOTE alert |
Company Profile |
SEC
News |
Chart |
Request a new note
C
A
S
I |
CCBG
-
NASDAQ
Capital City Bk Gp
BANKING - Regional - Mid-Atlantic Banks
|
$28.82
|
+0.25
0.88% |
$29.07
|
31,982
106.61% of 50 DAV
50 DAV is 30,000
|
$29.17
-1.20%
|
9/13/2019
|
$27.03
|
PP = $27.05
|
|
MB = $28.40
|
Most Recent Note - 10/25/2019 12:27:31 PM
G - Hitting yet another new 52-week high with today's 7th consecutive gain, rallying further above its "max buy" level. Prior highs define initial support to watch above its 50 DMA line ($26.16). Due to report earnings news on 10/29/19.
>>> FEATURED STOCK ARTICLE : Perched Near High With Earnings News Due Next Week - 10/14/2019 |
View all notes |
Set NEW NOTE alert |
Company Profile |
SEC
News |
Chart |
Request a new note
C
A
S
I |
AUDC
-
NASDAQ
Audiocodes Ltd
ELECTRONICS - Scientific and Technical Instrum
|
$20.81
|
+1.51
7.82% |
$21.15
|
723,430
358.13% of 50 DAV
50 DAV is 202,000
|
$22.50
-7.51%
|
9/13/2019
|
$19.68
|
PP = $19.84
|
|
MB = $20.83
|
Most Recent Note - 10/29/2019 12:10:19 PM
Y - Reported earnings +26% on +15% sales revenues for the Sep '19 quarter. Color code is changed to yellow after gapping up today, rallying above the prior pivot point since slumping back into the prior base. Recent low ($17.54 on 10/08/19) defines the next important support.
>>> FEATURED STOCK ARTICLE : Consolidating Above 50-Day Average But Below Prior Pivot Point - 10/21/2019 |
View all notes |
Set NEW NOTE alert |
Company Profile |
SEC
News |
Chart |
Request a new note
C
A
S
I |
CHDN
-
NASDAQ
Churchill Downs Inc
LEISURE - Gaming Activities
|
$132.73
|
-1.03
-0.77% |
$134.85
|
191,944
75.27% of 50 DAV
50 DAV is 255,000
|
$135.32
-1.91%
|
10/8/2019
|
$129.77
|
PP = $132.83
|
|
MB = $139.47
|
Most Recent Note - 10/25/2019 3:25:25 PM
Y - Inching into new all-time high territory with gains lacking great volume conviction. Gains above a stock's pivot point must be backed by at least +40% above average volume to trigger a proper new (or add-on) technical buy signal. Its 50 DMA line ($125.41) acted as support in recent weeks during its consolidation. Jun '19 earnings +10% on +26% sales revenues versus the year ago period were below the +25% minimum earnings guideline (C criteria), noted recently raising fundamental concerns.
>>> FEATURED STOCK ARTICLE : Volume-Driven Gain for Record High Close - 10/8/2019 |
View all notes |
Set NEW NOTE alert |
Company Profile |
SEC
News |
Chart |
Request a new note
C
A
S
I |
LULU
-
NASDAQ
Lululemon Athletica
MANUFACTURING - Textile Manufacturing
|
$205.58
|
-0.39
-0.19% |
$207.48
|
1,171,334
63.08% of 50 DAV
50 DAV is 1,857,000
|
$209.02
-1.65%
|
9/6/2019
|
$201.25
|
PP = $194.35
|
|
MB = $204.07
|
Most Recent Note - 10/28/2019 12:31:21 PM
G - Holding its ground near its all-time high after wedging higher with gains lacking great volume conviction. Its 50 DMA line ($193.44) and recent low ($185.36 on 10/03/19) define important near-term support.
>>> FEATURED STOCK ARTICLE : LULU Stretches to Hit New Record High - 10/18/2019 |
View all notes |
Set NEW NOTE alert |
Company Profile |
SEC
News |
Chart |
Request a new note
C
A
S
I |
Symbol/Exchange
Company Name
Industry Group |
PRICE |
CHANGE
(%Change) |
Day High |
Volume
(% DAV)
(% 50 day avg vol) |
52 Wk Hi
% From Hi |
Featured
Date |
Price
Featured |
Pivot Featured |
|
Max Buy |
CPRT
-
NASDAQ
Copart Inc
SPECIALTY RETAIL - Auto Dealerships
|
$84.68
|
+0.70
0.83% |
$85.31
|
1,040,999
69.87% of 50 DAV
50 DAV is 1,490,000
|
$85.10
-0.49%
|
9/5/2019
|
$79.13
|
PP = $79.84
|
|
MB = $83.83
|
Most Recent Note - 10/25/2019 5:51:09 PM
G - Reversed and closed lower after it touched a new all-time high today and its color code is changed to green. Its 50 DMA line ($79.84) defines near-term support above the prior low ($76.35 on 10/03/19).
>>> FEATURED STOCK ARTICLE : Reversed Into Red Today After Hitting New All-Time High - 10/22/2019 |
View all notes |
Set NEW NOTE alert |
Company Profile |
SEC
News |
Chart |
Request a new note
C
A
S
I |
BLD
-
NYSE
Topbuild Corp
Bldg-Constr Prds/Misc
|
$97.59
|
-0.79
-0.80% |
$100.59
|
294,827
119.85% of 50 DAV
50 DAV is 246,000
|
$102.81
-5.08%
|
5/17/2019
|
$82.19
|
PP = $87.31
|
|
MB = $91.68
|
Most Recent Note - 10/28/2019 5:33:11 PM
G - Pulled back today with higher volume after wedging into all-time high territory with gains lacking great volume conviction. Earnings rose +39% on +9% sales revenues for the Jun '19 quarter versus the year ago period. Its 50 DMA line ($95) defines important support to watch along with its prior low ($91.31 on 10/03/19).
>>> FEATURED STOCK ARTICLE : Pulling Back After Recently Wedging Into New High Territory - 10/23/2019 |
View all notes |
Set NEW NOTE alert |
Company Profile |
SEC
News |
Chart |
Request a new note
C
A
S
I |
|
|
|
THESE ARE NOT BUY RECOMMENDATIONS!
Comments contained in the body of this report are technical
opinions only. The material herein has been obtained
from sources believed to be reliable and accurate, however,
its accuracy and completeness cannot be guaranteed.
This site is not an investment advisor, hence it does
not endorse or recommend any securities or other investments.
Any recommendation contained in this report may not
be suitable for all investors and it is not to be deemed
an offer or solicitation on our part with respect to
the purchase or sale of any securities. All trademarks,
service marks and trade names appearing in this report
are the property of their respective owners, and are
likewise used for identification purposes only.
This report is a service available
only to active Paid Premium Members.
You may opt-out of receiving report notifications
at any time. Questions or comments may be submitted
by writing to Premium Membership Services 665 S.E. 10 Street, Suite 201 Deerfield Beach, FL 33441-5634 or by calling 1-800-965-8307
or 954-785-1121.
|
|
|