You are not logged in.
This means you
CAN ONLY VIEW reports that were published prior to Sunday, March 23, 2025.
You
MUST UPGRADE YOUR MEMBERSHIP if you want to see any current reports.
AFTER MARKET UPDATE - THURSDAY, NOVEMBER 14TH, 2019
Previous After Market Report Next After Market Report >>>
|
|
|
|
DOW |
-1.63 |
27,781.96 |
-0.01% |
|
Volume |
718,982,390 |
-10% |
|
Volume |
2,088,858,227 |
-3% |
|
NASDAQ |
-3.08 |
8,479.02 |
-0.04% |
|
Advancers |
1,639 |
57% |
|
Advancers |
1,442 |
47% |
|
S&P 500 |
+2.59 |
3,096.63 |
+0.08% |
|
Decliners |
1,225 |
43% |
|
Decliners |
1,634 |
53% |
|
Russell 2000 |
-0.39 |
1,588.79 |
-0.02% |
|
52 Wk Highs |
98 |
|
|
52 Wk Highs |
97 |
|
|
S&P 600 |
-1.74 |
977.88 |
-0.18% |
|
52 Wk Lows |
75 |
|
|
52 Wk Lows |
120 |
|
|
 |
Major Indices Ended Perched Near Records and Little Changed
Kenneth J. Gruneisen - Passed the CAN SLIM® Master's Exam
The Dow ticked down one point, while the S&P 500 gained 0.1% to eke out its eighth record close in 14 sessions. The Nasdaq Composite fell less than 0.1%. Advancers led decliners by a 4-3 margin on the NYSE and 8-7 on the Nasdaq exchange. Volume totals reported were lighter than the prior session on both major exchanges. There were 45 high-ranked companies from the Leaders List that hit a new 52-week high and were listed on the BreakOuts Page, versus the total of 38 on the prior session. New 52-week highs totals solidly outnumbered new 52-week lows totals on the NYSE but new lows outnumbered new highs on the Nasdaq exchange for the 2nd consecutive session. The major indices (M criteria) are in a "confirmed uptrend" after enduring distributional pressure in recent weeks. The Featured Stocks Page provides the most timely analysis on high-ranked leaders. Charts used courtesy of www.stockcharts.com
 N N
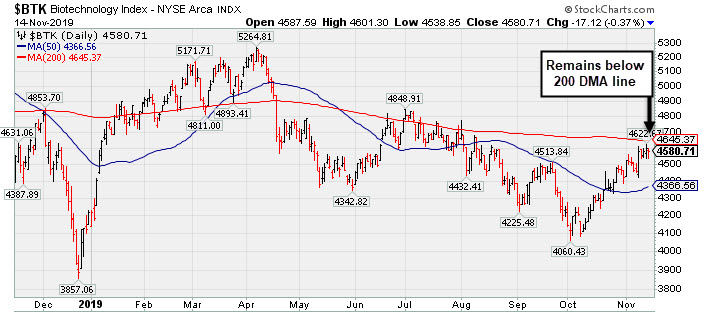
PICTURED: The Nasdaq Composite Index is perched near its record high.
UU.S. equities finished the session mixed Thursday as investors continue to monitor trade developments. The major averages fluctuated after China’s Commerce Ministry spokesman reported that Washington and Beijing are in the midst of “in-depth” discussions concerning an initial agreement, but reiterated the importance of the U.S. rescinding some existing tariffs in order to reach an accord. Meanwhile, China also announced it will permit imports of qualified poultry from the U.S. beginning today.
Seven of 11 S&P 500 sectors finished the session in positive territory with Real Estate and Consumer Discretionary outperforming. In earnings news, Cisco Systems (CSCO -7.33%) sank following a disappointing outlook, as the network gear maker cited rising global uncertainties. Walmart (WMT -0.27%) reversed an early gain and ended lower despite topping analyst estimates for profit and comparable-store sales. Viacom (VIA +1.08%) rose after 4th quarter profit and revenue topped analyst estimates. Department store Dillard’s (DDS +14.16%) jumped higher after crushing analyst profit expectations and reporting no decline in same store sales.
Economic data garnered attention with Core PPI, which excludes the more volatile food and energy components, advancing 1.6% year-over-year in October, slowing from the prior 2.00% pace, but higher than analysts’ forecasts of 1.5%. Separately, initial jobless claims came in at 225,000, the highest level since June, and above the previous 211,000 figure. Treasuries strengthened with the yield on the benchmark 10-year bond losing six basis points to 1.82%.
|
 Kenneth J. Gruneisen started out as a licensed stockbroker in August 1987, a couple of months prior to the historic stock market crash that took the Dow Jones Industrial Average down -22.6% in a single day. He has published daily fact-based fundamental and technical analysis on high-ranked stocks online for two decades. Through FACTBASEDINVESTING.COM, Kenneth provides educational articles, news, market commentary, and other information regarding proven investment systems that work in good times and bad.
Comments contained in the body of this report are technical opinions only and are not necessarily those of Gruneisen Growth Corp. The material herein has been obtained from sources believed to be reliable and accurate, however, its accuracy and completeness cannot be guaranteed. Our firm, employees, and customers may effect transactions, including transactions contrary to any recommendation herein, or have positions in the securities mentioned herein or options with respect thereto. Any recommendation contained in this report may not be suitable for all investors and it is not to be deemed an offer or solicitation on our part with respect to the purchase or sale of any securities. |
|
 |
Gold & Silver, Retail, and Broker/Dealer Indexes Rose
Kenneth J. Gruneisen - Passed the CAN SLIM® Master's Exam
The Retail Index ($RLX +0.51%) and Broker/Dealer Index ($XBD +0.65%) both posted gains but the Bank Index ($BKX -0.10%) ended slightly in the red. The tech sector had a negative bias as the Networking Index ($NWX -0.91%) and Semiconductor Index ($SOX -0.30%) both edged higher. Again commodity-linked groups were mixed as the Oil Services Index ($OSX -1.16%) outpaced the Integrated Oil Index ($XOI -0.29%) to the downside while the Gold & Silver Index ($XAU +0.73%) notched another standout gain.
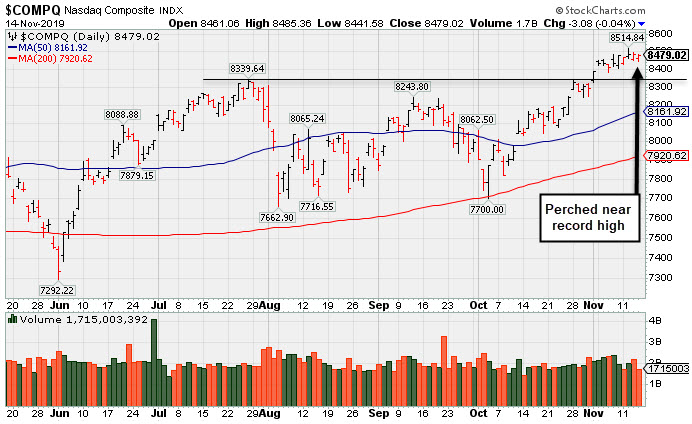
PICTURED: The Biotech Index ($BTK -0.37%) remains trading below its 200-day moving average (DMA) line.
| Oil Services |
$OSX |
66.31 |
-0.78 |
-1.16% |
-17.73% |
| Integrated Oil |
$XOI |
1,236.04 |
-3.65 |
-0.29% |
+6.64% |
| Semiconductor |
$SOX |
1,727.59 |
-5.27 |
-0.30% |
+49.55% |
| Networking |
$NWX |
577.71 |
-5.30 |
-0.91% |
+18.22% |
| Broker/Dealer |
$XBD |
273.31 |
+1.76 |
+0.65% |
+15.15% |
| Retail |
$RLX |
2,383.89 |
+12.04 |
+0.51% |
+22.16% |
| Gold & Silver |
$XAU |
93.94 |
+0.68 |
+0.73% |
+32.95% |
| Bank |
$BKX |
107.79 |
-0.10 |
-0.09% |
+25.64% |
| Biotech |
$BTK |
4,580.73 |
-17.11 |
-0.37% |
+8.53% |
|
|
|
 |
Rallying Near High With 12th Consecutive Gain
Kenneth J. Gruneisen - Passed the CAN SLIM® Master's Exam
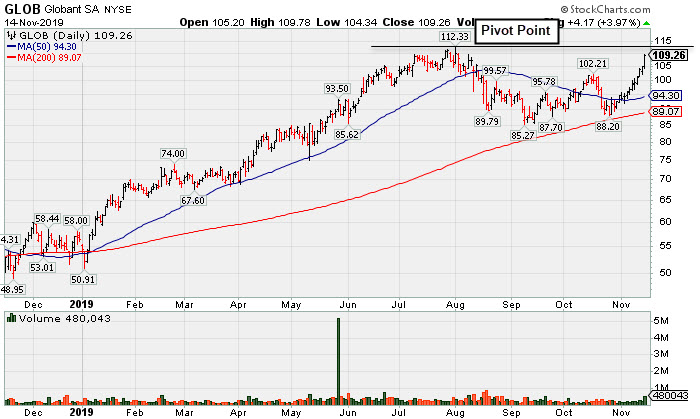
Globant SA (GLOB +$4.17 or +3.97% to $109.26) was highlighted in yellow with new pivot point cited based on its 8/01/19 high plus 10 cents in the earlier mid-day report (read here). It has rebounded near its all-time high with today's 12th consecutive gain. Subsequent volume-driven gains above the pivot point may trigger a technical buy signal. Keep in mind it is due to report Sep '19 quarterly results. Volume and volatility often increase near earnings news.
GLOB was last shown in this FSU section on 8/09/19 with an annotated graph under the headline, "Consolidating Above 50-Day Average With Earnings News Soon". It found support near its 200 DMA line during the consolidation since dropped from the Featured Stocks list on 8/19/19. It reported earnings +33% on +23% sales revenues for the Jun '19 quarter continuing its strong earning track record above the +25% minimum earnings guideline (C criteria). It has a strong annual earnings (A criteria) history and has a 97 Earnings Per Share Rating.
This Luxembourg-based Computer - Tech Services firm completed a Secondary Offering on 6/21/18. The number of top-rated funds owning its shares rose from 235 in Mar '18 to 527 in Sep '19, a reassuring sign concerning the I criteria. Its current Up/Down Volume Ratio of 1.4 is an unbiased indication its shares have been under accumulation over the past 50 days. It has a Timeliness rating of A and Sponsorship Rating of C. Its small supply of 36.3 million shares outstanding (S criteria) can contribute to greater volatility in the event of institutional buying or selling.
Charts courtesy of www.stockcharts.com
 |
|
|
Color Codes Explained :
Y - Better candidates highlighted by our
staff of experts.
G - Previously featured
in past reports as yellow but may no longer be buyable under the
guidelines.
***Last / Change / Volume data in this table is the closing quote data***
Symbol/Exchange
Company Name
Industry Group |
PRICE |
CHANGE
(%Change) |
Day High |
Volume
(% DAV)
(% 50 day avg vol) |
52 Wk Hi
% From Hi |
Featured
Date |
Price
Featured |
Pivot Featured |
|
Max Buy |
 MLR
-
NYSE
MLR
-
NYSE
Miller Industries Inc
AUTOMOTIVE - Auto Parts
|
$36.40
|
+0.72
2.02% |
$36.66
|
47,332
112.70% of 50 DAV
50 DAV is 42,000
|
$37.70
-3.45%
|
9/24/2019
|
$34.00
|
PP = $35.36
|
|
MB = $37.13
|
Most Recent Note - 11/13/2019 5:32:51 PM
Y - Retreated from its 52-week high with recent losses backed by above average volume. Prior highs in the $35 area define initial support above its 50 DMA line ($33.67). Fundamentals remain strong.
>>> FEATURED STOCK ARTICLE : Hit New High But Did Not Close Session Above Pivot Point - 10/29/2019 |
View all notes |
Set NEW NOTE alert |
Company Profile |
SEC
News |
Chart |
Request a new note
C
A
S
I |
CCBG
-
NASDAQ
Capital City Bk Gp
BANKING - Regional - Mid-Atlantic Banks
|
$29.75
|
+0.20
0.68% |
$29.92
|
30,524
84.79% of 50 DAV
50 DAV is 36,000
|
$30.85
-3.57%
|
9/13/2019
|
$27.03
|
PP = $27.05
|
|
MB = $28.40
|
Most Recent Note - 11/13/2019 5:31:23 PM
G - Sputtering since a noted "negative reversal" on 11/07/19 after hitting another new 52-week high. Extended from the prior base. Prior highs define important support to watch along with its 50 DMA line ($27.51).
>>> FEATURED STOCK ARTICLE : Noted "Positive Reversal" on Volatile Session After Earnings - 10/31/2019 |
View all notes |
Set NEW NOTE alert |
Company Profile |
SEC
News |
Chart |
Request a new note
C
A
S
I |
FTNT
-
NASDAQ
Fortinet Inc
Computer Sftwr-Security
|
$100.12
|
+0.45
0.45% |
$100.85
|
1,104,605
82.25% of 50 DAV
50 DAV is 1,343,000
|
$100.34
-0.22%
|
11/11/2019
|
$97.14
|
PP = $97.06
|
|
MB = $101.91
|
Most Recent Note - 11/12/2019 5:44:40 PM
Y - Posted a solid gain above its new pivot point today backed by +85% above average volume triggering a new (or add-on) technical buy signal. Gapped up on 11/01/19 helping its outlook to improve. Bullish action came after it reported earnings +37% on +21% sales revenues for the Sep '19 quarter versus the year ago period. See the latest FSU analysis for more details and an annotated graph.
>>> FEATURED STOCK ARTICLE : Reversed Into Red Today After Touching New High - 11/11/2019 |
View all notes |
Set NEW NOTE alert |
Company Profile |
SEC
News |
Chart |
Request a new note
C
A
S
I |
AUDC
-
NASDAQ
Audiocodes Ltd
ELECTRONICS - Scientific and Technical Instrum
|
$22.00
|
+0.65
3.04% |
$22.03
|
178,931
69.35% of 50 DAV
50 DAV is 258,000
|
$22.50
-2.22%
|
9/13/2019
|
$19.68
|
PP = $19.84
|
|
MB = $20.83
|
 Most Recent Note - 11/14/2019 5:06:26 PM
G - Posted a gain today with lighter than average volume for a best-ever close. Reported earnings +26% on +15% sales revenues for the Sep '19 quarter. Its 50 DMA line ($19.56) and recent low ($17.54 on 10/08/19) define important near-term support levels to watch.
>>> FEATURED STOCK ARTICLE : Audiocodes is Quietly Perched Near its All-Time High - 11/7/2019 |
View all notes |
Set NEW NOTE alert |
Company Profile |
SEC
News |
Chart |
Request a new note
C
A
S
I |
CHDN
-
NASDAQ
Churchill Downs Inc
LEISURE - Gaming Activities
|
$126.46
|
+0.51
0.40% |
$127.47
|
216,983
77.49% of 50 DAV
50 DAV is 280,000
|
$135.32
-6.55%
|
10/8/2019
|
$129.77
|
PP = $132.83
|
|
MB = $139.47
|
Most Recent Note - 11/11/2019 11:46:18 AM
G - Technically, meeting resistance at its 50 DMA line ($126.53) when trying to rebound following damaging volume-driven losses last week. Reported Sep '19 earnings +4% on +38% sales revenues versus the year ago period, its 2nd consecutive quarterly comparison below the +25% minimum earnings guideline (C criteria), raising greater fundamental concerns.
>>> FEATURED STOCK ARTICLE : Perched at Record High at Time of Quarterly Report - 10/30/2019 |
View all notes |
Set NEW NOTE alert |
Company Profile |
SEC
News |
Chart |
Request a new note
C
A
S
I |
Symbol/Exchange
Company Name
Industry Group |
PRICE |
CHANGE
(%Change) |
Day High |
Volume
(% DAV)
(% 50 day avg vol) |
52 Wk Hi
% From Hi |
Featured
Date |
Price
Featured |
Pivot Featured |
|
Max Buy |
LULU
-
NASDAQ
Lululemon Athletica
MANUFACTURING - Textile Manufacturing
|
$213.22
|
+2.11
1.00% |
$213.64
|
1,235,414
63.13% of 50 DAV
50 DAV is 1,957,000
|
$211.31
0.90%
|
9/6/2019
|
$201.25
|
PP = $194.35
|
|
MB = $204.07
|
Most Recent Note - 11/11/2019 11:49:05 AM
G - After wedging higher with gains lacking great volume conviction it found prompt support again near its 50 DMA line ($197.41). The prior low ($185.36 on 10/03/19) defines the next important near-term support.
>>> FEATURED STOCK ARTICLE : Testing 50-Day Moving Average With Loss on Above Average Volume - 11/4/2019 |
View all notes |
Set NEW NOTE alert |
Company Profile |
SEC
News |
Chart |
Request a new note
C
A
S
I |
CPRT
-
NASDAQ
Copart Inc
SPECIALTY RETAIL - Auto Dealerships
|
$85.82
|
+2.22
2.66% |
$85.86
|
1,141,375
75.34% of 50 DAV
50 DAV is 1,515,000
|
$85.31
0.60%
|
9/5/2019
|
$79.13
|
PP = $79.84
|
|
MB = $83.83
|
Most Recent Note - 11/11/2019 11:47:40 AM
Y - Still consolidating below its "max buy" level and finding support above its 50 DMA line ($81.47). The 50 DMA line defines near-term support above the prior low ($76.35 on 10/03/19). Wedged to new all-time highs with recent gains lacking great volume conviction.
>>> FEATURED STOCK ARTICLE : Testing Support at 50-Day Moving Average - 11/6/2019 |
View all notes |
Set NEW NOTE alert |
Company Profile |
SEC
News |
Chart |
Request a new note
C
A
S
I |
NMIH
-
NASDAQ
N M I Holdings Inc Cl A
Finance-MrtgandRel Svc
|
$33.89
|
-0.48
-1.40% |
$34.44
|
520,837
123.71% of 50 DAV
50 DAV is 421,000
|
$34.50
-1.77%
|
11/8/2019
|
$32.89
|
PP = $31.44
|
|
MB = $33.01
|
Most Recent Note - 11/12/2019 5:46:14 PM
G - Color code is changed to green after rising above its "max buy" level with today's gain backed by near average volume. Reported earnings +54% on +42% sales revenues for the Sep '19 quarter, and prior quarterly comparisons were also well above the +25% minimum guideline (C criteria). After years of losses it had profitable years for FY '16, '17, and '18.
>>> FEATURED STOCK ARTICLE : Hit New High With Volume-Driven Gains - 11/8/2019 |
View all notes |
Set NEW NOTE alert |
Company Profile |
SEC
News |
Chart |
Request a new note
C
A
S
I |
BLD
-
NYSE
Topbuild Corp
Bldg-Constr Prds/Misc
|
$109.52
|
+0.02
0.02% |
$110.84
|
184,408
64.48% of 50 DAV
50 DAV is 286,000
|
$111.48
-1.76%
|
5/17/2019
|
$82.19
|
PP = $87.31
|
|
MB = $91.68
|
Most Recent Note - 11/12/2019 5:43:01 PM
G - Extended from any sound base and consolidating after volume-driven gains for new all-time highs. Reported earnings +24% on +5% sales revenues for the Sep '19 quarter versus the year ago period, just below the +25% minimum guideline (C criteria). Found prompt support near its 50 DMA line ($98.13) during its ongoing ascent. See the latest FSU analysis for more details and a new annotated graph.
>>> FEATURED STOCK ARTICLE : Perched Near High Following Recent Volume-Driven Gains - 11/12/2019 |
View all notes |
Set NEW NOTE alert |
Company Profile |
SEC
News |
Chart |
Request a new note
C
A
S
I |
GLOB
-
NYSE
Globant SA
Computer-Tech Services
|
$109.26
|
+4.17
3.97% |
$109.78
|
478,652
217.57% of 50 DAV
50 DAV is 220,000
|
$112.33
-2.73%
|
11/14/2019
|
$106.87
|
PP = $112.43
|
|
MB = $118.05
|
Most Recent Note - 11/14/2019 5:05:08 PM
Y - Finished strong with above average volume behind today's 12th consecutive gain. It was highlighted in yellow with new pivot point cited based on its 8/01/19 high plus 10 cents in the mid-day report and noted - "Subsequent volume-driven gains above the pivot point may trigger a technical buy signal. Due to report Sep '19 quarterly results. Volume and volatility often increase near earnings news. Found support near its 200 DMA line during the consolidation since dropped from the Featured Stocks list on 8/19/19. Reported earnings +33% on +23% sales revenues for the Jun '19 quarter continuing its strong earning track record." See the latest FSU analysis for more details and a new annotated graph.
>>> FEATURED STOCK ARTICLE : Rallying Near High With 12th Consecutive Gain - 11/14/2019 |
View all notes |
Set NEW NOTE alert |
Company Profile |
SEC
News |
Chart |
Request a new note
C
A
S
I |
Symbol/Exchange
Company Name
Industry Group |
PRICE |
CHANGE
(%Change) |
Day High |
Volume
(% DAV)
(% 50 day avg vol) |
52 Wk Hi
% From Hi |
Featured
Date |
Price
Featured |
Pivot Featured |
|
Max Buy |
|
|
|
THESE ARE NOT BUY RECOMMENDATIONS!
Comments contained in the body of this report are technical
opinions only. The material herein has been obtained
from sources believed to be reliable and accurate, however,
its accuracy and completeness cannot be guaranteed.
This site is not an investment advisor, hence it does
not endorse or recommend any securities or other investments.
Any recommendation contained in this report may not
be suitable for all investors and it is not to be deemed
an offer or solicitation on our part with respect to
the purchase or sale of any securities. All trademarks,
service marks and trade names appearing in this report
are the property of their respective owners, and are
likewise used for identification purposes only.
This report is a service available
only to active Paid Premium Members.
You may opt-out of receiving report notifications
at any time. Questions or comments may be submitted
by writing to Premium Membership Services 665 S.E. 10 Street, Suite 201 Deerfield Beach, FL 33441-5634 or by calling 1-800-965-8307
or 954-785-1121.
|
|
|