***Last / Change / Volume data in this table is the closing quote data***
Symbol/Exchange
Company Name
Industry Group |
PRICE |
CHANGE
(%Change) |
Day High |
Volume
(% DAV)
(% 50 day avg vol) |
52 Wk Hi
% From Hi |
Featured
Date |
Price
Featured |
Pivot Featured |
|
Max Buy |
ALGN
-
NASDAQ
Align Technology Inc
HEALTH SERVICES - Medical Appliances and Equipment
|
$35.41
|
-2.86
-7.47% |
$38.43
|
6,522,728
771.01% of 50 DAV
50 DAV is 846,000
|
$39.82
-11.07%
|
10/17/2012
|
$37.31
|
PP = $39.92
|
|
MB = $41.92
|
 Most Recent Note - 10/17/2012 6:02:49 PM
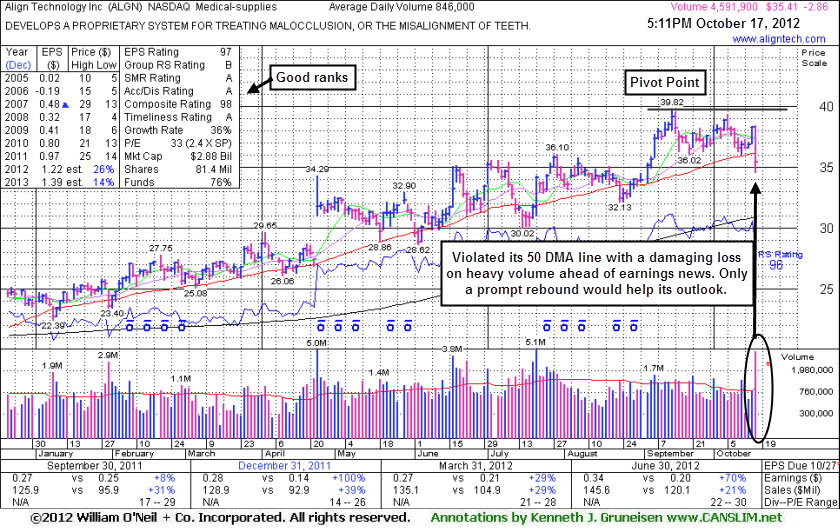
Y - Traded lower in after-hours action after reporting preliminary earnings after the close today. Volume and volatility often increase near earnings news. This high-ranked Medical - Supplies firm built an orderly base above its 50 DMA line and above prior highs in the $36 area, however it slumped under its 50 DMA line since highlighted in yellow with pivot point cited based on its 9/13/12 high plus 10 cents in today's earlier mid-day report (read here) while noted - "Disciplined investors may watch for volume-driven gains above its pivot point which are needed to trigger a new technical buy signal. Last noted in the 7/27/12 mid-day report - 'Earnings rose +70% on +21% sales revenues for the quarter ended June 30, 2012 versus the year ago period, marking a 3rd consecutive quarterly earnings increase above the +25% minimum guideline (C criteria). Its annual earnings (A criteria) history has been good following a downturn in FY '08. Patient and disciplined investors may watch for a proper base to form while it continues consolidating.'" See the latest FSU analysis for more details an a new annotated graph.
>>> The latest Featured Stock Update with an annotated graph appeared on 10/17/2012. Click here.
View all notes |
Alert me of new notes |
CANSLIM.net Company Profile |
SEC |
Zacks Reports |
StockTalk |
News |
Chart |
Request a new note
C
A N
S L
I M


|
ALXN
-
NASDAQ
Alexion Pharmaceuticals
DRUGS - Drug Manufacturers - Other
|
$114.59
|
+2.85
2.55% |
$115.06
|
860,909
95.04% of 50 DAV
50 DAV is 905,800
|
$119.54
-4.14%
|
8/23/2012
|
$103.70
|
PP = $110.06
|
|
MB = $115.56
|
Most Recent Note - 10/16/2012 1:03:11 PM
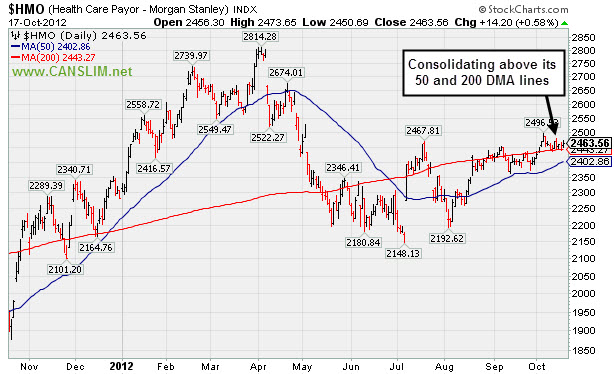
Y - Still consolidating above its 50 DMA line today after recently retreating below its "max buy" level. The prior highs in the $110 area define chart support along with its 50 DMA line where violations would raise concerns and trigger technical sell signals..
>>> The latest Featured Stock Update with an annotated graph appeared on 9/26/2012. Click here.
View all notes |
Alert me of new notes |
CANSLIM.net Company Profile |
SEC |
Zacks Reports |
StockTalk |
News |
Chart |
Request a new note
C
A N
S L
I M
|
ASPS
-
NASDAQ
Altisource Ptf Sltns Sa
REAL ESTATE - Property Management/Developmen
|
$117.05
|
-0.39
-0.33% |
$118.39
|
178,219
105.71% of 50 DAV
50 DAV is 168,600
|
$118.48
-1.21%
|
9/24/2012
|
$87.24
|
PP = $92.39
|
|
MB = $97.01
|
Most Recent Note - 10/16/2012 3:35:05 PM
G - Posting a gain today on below average volume for a new all-time high. Very extended from its prior base, it s prior highs in the $92 area define initial support to watch on pullbacks.
>>> The latest Featured Stock Update with an annotated graph appeared on 10/12/2012. Click here.
View all notes |
Alert me of new notes |
CANSLIM.net Company Profile |
SEC |
Zacks Reports |
StockTalk |
News |
Chart |
Request a new note
C
A N
S L
I M
|
BRLI
-
NASDAQ
Bio Reference Labs Inc
HEALTH SERVICES - Medical Laboratories and Researc
|
$32.00
|
-0.09
-0.28% |
$32.36
|
436,381
150.58% of 50 DAV
50 DAV is 289,800
|
$32.86
-2.62%
|
10/3/2012
|
$30.90
|
PP = $30.25
|
|
MB = $31.76
|
Most Recent Note - 10/17/2012 4:21:19 PM
G - Churned above average volume today yet held its ground. Prior highs in the $30 area define initial chart support above its 50 DMA line.
>>> The latest Featured Stock Update with an annotated graph appeared on 10/8/2012. Click here.
View all notes |
Alert me of new notes |
CANSLIM.net Company Profile |
SEC |
Zacks Reports |
StockTalk |
News |
Chart |
Request a new note
C
A N
S L
I M
|
CFNL
-
NASDAQ
Cardinal Financial Corp
BANKING - Regional - Southeast Banks
|
$14.24
|
+0.43
3.11% |
$14.24
|
113,243
139.29% of 50 DAV
50 DAV is 81,300
|
$14.79
-3.72%
|
8/17/2012
|
$12.84
|
PP = $13.31
|
|
MB = $13.98
|
Most Recent Note - 10/17/2012 4:23:24 PM
G - Posted a solid gain today with higher and above average volume. Consolidating above its 50 DMA line ($13.61 now) where violations would trigger technical sell signals.
>>> The latest Featured Stock Update with an annotated graph appeared on 9/25/2012. Click here.
View all notes |
Alert me of new notes |
CANSLIM.net Company Profile |
SEC |
Zacks Reports |
StockTalk |
News |
Chart |
Request a new note
C
A N
S L
I M
|
Symbol/Exchange
Company Name
Industry Group |
PRICE |
CHANGE
(%Change) |
Day High |
Volume
(% DAV)
(% 50 day avg vol) |
52 Wk Hi
% From Hi |
Featured
Date |
Price
Featured |
Pivot Featured |
|
Max Buy |
CMCSA
-
NASDAQ
Comcast Corp Cl A
MEDIA - CATV Systems
|
$37.12
|
+0.45
1.23% |
$37.22
|
10,123,015
85.86% of 50 DAV
50 DAV is 11,789,500
|
$36.98
0.38%
|
6/11/2012
|
$29.94
|
PP = $30.98
|
|
MB = $32.53
|
Most Recent Note - 10/15/2012 4:07:21 PM
G - Posted another gain today on average volume and finished within close striking distance of its best ever close. Found support while consolidating above prior highs in the $35 area and its 50 DMA line. Violations would trigger technical sell signals. Fundamental concerns have been repeatedly noted - "Due to sub par sales and earnings growth in the Jun '12 quarter."
>>> The latest Featured Stock Update with an annotated graph appeared on 9/21/2012. Click here.
View all notes |
Alert me of new notes |
CANSLIM.net Company Profile |
SEC |
Zacks Reports |
StockTalk |
News |
Chart |
Request a new note
C
A N
S L
I M
|
DVA
-
NYSE
Davita Inc
HEALTH SERVICES - Specialized Health Services
|
$110.54
|
+0.67
0.61% |
$110.89
|
641,052
84.89% of 50 DAV
50 DAV is 755,200
|
$111.34
-0.72%
|
9/5/2012
|
$102.92
|
PP = $100.62
|
|
MB = $105.65
|
Most Recent Note - 10/15/2012 4:08:54 PM
G - Reversed from its 52-week high today and closed near the session low with a loss on above average volume. Extended from its latest sound base. Prior highs near $100 and its 50 DMA line define near term support to watch on pullbacks where violations may trigger technical sell signals.
>>> The latest Featured Stock Update with an annotated graph appeared on 10/10/2012. Click here.
View all notes |
Alert me of new notes |
CANSLIM.net Company Profile |
SEC |
Zacks Reports |
StockTalk |
News |
Chart |
Request a new note
C
A N
S L
I M
|
GPX
-
NYSE
G P Strategies Corp
DIVERSIFIED SERVICES - Education and Training Services
|
$19.68
|
+0.12
0.61% |
$19.94
|
29,366
44.70% of 50 DAV
50 DAV is 65,700
|
$20.67
-4.79%
|
10/8/2012
|
$20.00
|
PP = $20.77
|
|
MB = $21.81
|
Most Recent Note - 10/16/2012 4:45:41 PM
G - Consolidating near its 50 DMA line today. Volume driven gains above the pivot point have not triggered a new (or add-on) technical buy signal. Losses exceeding last week's low $18.82 would raise more serious concerns and trigger technical sell signals. See latest FSU analysis for more details and a new annotated graph.
>>> The latest Featured Stock Update with an annotated graph appeared on 10/16/2012. Click here.
View all notes |
Alert me of new notes |
CANSLIM.net Company Profile |
SEC |
Zacks Reports |
StockTalk |
News |
Chart |
Request a new note
C
A N
S L
I M
|
LKQ
-
NASDAQ
L K Q Corp
WHOLESALE - Auto Parts
|
$20.87
|
+0.32
1.56% |
$21.05
|
2,554,444
179.33% of 50 DAV
50 DAV is 1,424,400
|
$20.59
1.36%
|
8/9/2012
|
$18.97
|
PP = $18.72
|
|
MB = $19.66
|
Most Recent Note - 10/16/2012 3:38:24 PM
G - Hitting new 52-week and all-time highs again today, wedging higher without great volume conviction. Rallying well above its "max buy" level with no resistance remaining due to overhead supply.
>>> The latest Featured Stock Update with an annotated graph appeared on 9/17/2012. Click here.
View all notes |
Alert me of new notes |
CANSLIM.net Company Profile |
SEC |
Zacks Reports |
StockTalk |
News |
Chart |
Request a new note
C
A N
S L
I M
|
LNKD
-
NYSE
Linkedin Corp Class A
INTERNET - Internet Information Providers
|
$109.42
|
-1.76
-1.58% |
$112.90
|
1,592,654
76.84% of 50 DAV
50 DAV is 2,072,800
|
$125.50
-12.81%
|
9/5/2012
|
$113.25
|
PP = $113.10
|
|
MB = $118.76
|
Most Recent Note - 10/15/2012 4:04:23 PM
G - Posted a small gain on light volume today, failing to rebound after a damaging volume-driven loss violated its 50 DMA line and triggered a technical sell signal on the prior session. Only a prompt rebound above that short-term average would help its outlook. Disciplined investors always limit losses if ever any stock falls more than -7% from where it was purchased.
>>> The latest Featured Stock Update with an annotated graph appeared on 10/9/2012. Click here.
View all notes |
Alert me of new notes |
CANSLIM.net Company Profile |
SEC |
Zacks Reports |
StockTalk |
News |
Chart |
Request a new note
C
A N
S L
I M
|
Symbol/Exchange
Company Name
Industry Group |
PRICE |
CHANGE
(%Change) |
Day High |
Volume
(% DAV)
(% 50 day avg vol) |
52 Wk Hi
% From Hi |
Featured
Date |
Price
Featured |
Pivot Featured |
|
Max Buy |
LULU
-
NASDAQ
Lululemon Athletica
MANUFACTURING - Textile Manufacturing
|
$75.35
|
-0.17
-0.23% |
$76.34
|
1,026,197
43.85% of 50 DAV
50 DAV is 2,340,100
|
$81.09
-7.08%
|
10/2/2012
|
$74.89
|
PP = $78.97
|
|
MB = $82.92
|
Most Recent Note - 10/16/2012 3:44:05 PM
Y - Volume totals have been cooling while consolidating since recently highlighted again in yellow. Volume-driven gains above its pivot point are still needed to confirm a technical buy signal before action may be justified by disciplined investors.
>>> The latest Featured Stock Update with an annotated graph appeared on 10/2/2012. Click here.
View all notes |
Alert me of new notes |
CANSLIM.net Company Profile |
SEC |
Zacks Reports |
StockTalk |
News |
Chart |
Request a new note
C
A N
S L
I M
|
MIDD
-
NASDAQ
Middleby Corp
MANUFACTURING - Diversified Machinery
|
$122.86
|
+1.87
1.55% |
$122.97
|
63,393
62.33% of 50 DAV
50 DAV is 101,700
|
$122.57
0.24%
|
10/8/2012
|
$118.46
|
PP = $122.67
|
|
MB = $128.80
|
Most Recent Note - 10/16/2012 3:46:22 PM
Y - Poised for a best-ever close with a quiet gain today and trading just -1.3% off its 52-week high. Volume totals have been below average in recent weeks while stubbornly holding its ground. Subsequent volume-driven gains above the pivot point may trigger a new (or add-on) technical buy signal. Its 50 DMA line and recent lows define near-term chart support to watch.
>>> The latest Featured Stock Update with an annotated graph appeared on 9/18/2012. Click here.
View all notes |
Alert me of new notes |
CANSLIM.net Company Profile |
SEC |
Zacks Reports |
StockTalk |
News |
Chart |
Request a new note
C
A N
S L
I M
|
N
-
NYSE
Netsuite Inc
DIVERSIFIED SERVICES - Business/Management Services
|
$62.07
|
-0.63
-1.00% |
$62.28
|
345,413
75.72% of 50 DAV
50 DAV is 456,200
|
$64.70
-4.06%
|
8/20/2012
|
$55.88
|
PP = $59.32
|
|
MB = $62.29
|
Most Recent Note - 10/17/2012 4:25:46 PM
Y - Quietly consolidating today just below its "max buy" level. Prior highs near $59 closely coincide with its 50 DMA line defining important chart support where subsequent violations would trigger technical sell signals.
>>> The latest Featured Stock Update with an annotated graph appeared on 9/24/2012. Click here.
View all notes |
Alert me of new notes |
CANSLIM.net Company Profile |
SEC |
Zacks Reports |
StockTalk |
News |
Chart |
Request a new note
C
A N
S L
I M
|
NSM
-
NYSE
Nationstar Mtg Hldgs Inc
FINANCIAL SERVICES - Credit Services
|
$33.81
|
+1.13
3.46% |
$33.98
|
1,151,264
96.33% of 50 DAV
50 DAV is 1,195,100
|
$37.20
-9.11%
|
8/29/2012
|
$27.96
|
PP = $28.85
|
|
MB = $30.29
|
Most Recent Note - 10/17/2012 4:27:23 PM
G - Tallied a 3rd consecutive gain today with near average volume. A steep upward trendline connecting July-September lows defines a near-term support level to watch above its 50 DMA line.
>>> The latest Featured Stock Update with an annotated graph appeared on 10/11/2012. Click here.
View all notes |
Alert me of new notes |
CANSLIM.net Company Profile |
SEC |
Zacks Reports |
StockTalk |
News |
Chart |
Request a new note
C
A N
S L
I M
|
OSIS
-
NASDAQ
O S I Systems Inc
ELECTRONICS - Semiconductor Equipment and Mate
|
$79.17
|
+1.38
1.77% |
$79.28
|
98,825
74.75% of 50 DAV
50 DAV is 132,200
|
$78.93
0.30%
|
9/5/2012
|
$74.39
|
PP = $75.10
|
|
MB = $78.86
|
Most Recent Note - 10/16/2012 3:41:06 PM
Y - Small gap up today, trading just -1.6% off its 52-week high. Volume totals have been cooling in recent weeks while holding its ground, a sign that very few investors have been heading for the exits. It remains below its "max buy" level after bullish action recently confirmed a technical buy signal. Near term support is at its 50 DMA line (now $74.41).
>>> The latest Featured Stock Update with an annotated graph appeared on 9/14/2012. Click here.
View all notes |
Alert me of new notes |
CANSLIM.net Company Profile |
SEC |
Zacks Reports |
StockTalk |
News |
Chart |
Request a new note
C
A N
S L
I M
|
Symbol/Exchange
Company Name
Industry Group |
PRICE |
CHANGE
(%Change) |
Day High |
Volume
(% DAV)
(% 50 day avg vol) |
52 Wk Hi
% From Hi |
Featured
Date |
Price
Featured |
Pivot Featured |
|
Max Buy |
RNF
-
NYSE
Rentech Nitrogen Ptnr Lp
CHEMICALS - Agricultural Chemicals
|
$37.11
|
+0.53
1.45% |
$37.25
|
260,961
60.05% of 50 DAV
50 DAV is 434,600
|
$40.05
-7.34%
|
7/27/2012
|
$29.58
|
PP = $30.60
|
|
MB = $32.13
|
Most Recent Note - 10/16/2012 12:58:19 PM
G - Considerable gain today, rallying from its 50 DMA line defining important near-term support after the previously noted upward trendline violation. Gains have lacked volume conviction after it halted its slide.
>>> The latest Featured Stock Update with an annotated graph appeared on 10/4/2012. Click here.
View all notes |
Alert me of new notes |
CANSLIM.net Company Profile |
SEC |
Zacks Reports |
StockTalk |
News |
Chart |
Request a new note
C
A N
S L
I M
|
SWI
-
NYSE
Solarwinds Inc
COMPUTER SOFTWARE and SERVICES - Application Software
|
$51.79
|
-2.30
-4.25% |
$54.37
|
954,146
120.69% of 50 DAV
50 DAV is 790,600
|
$60.95
-15.03%
|
7/25/2012
|
$47.82
|
PP = $47.89
|
|
MB = $50.28
|
Most Recent Note - 10/17/2012 3:22:34 PM
G - Slumping to 12-week lows today after recent gains lacked volume conviction. Due to report earnings on Thursday, October 25th. Caution is advised unless strength returns and it rises back above its 50 DMA line promptly. Prior highs in the $48 area define the next chart support level.
>>> The latest Featured Stock Update with an annotated graph appeared on 10/3/2012. Click here.
View all notes |
Alert me of new notes |
CANSLIM.net Company Profile |
SEC |
Zacks Reports |
StockTalk |
News |
Chart |
Request a new note
C
A N
S L
I M
|
TDG
-
NYSE
Transdigm Group Inc
AEROSPACE/DEFENSE - Aerospace/Defense Products and; Services
|
$149.00
|
-1.90
-1.26% |
$152.28
|
973,439
231.61% of 50 DAV
50 DAV is 420,300
|
$152.62
-2.37%
|
8/16/2012
|
$132.23
|
PP = $136.44
|
|
MB = $143.26
|
Most Recent Note - 10/16/2012 1:07:16 PM
G - Gain today on quiet volume has it potentially poised for its best-ever close, extended from its prior base. Its 50 DMA line and prior lows define near-term support to watch in the $138 area where violations may trigger technical sell signals.
>>> The latest Featured Stock Update with an annotated graph appeared on 9/20/2012. Click here.
View all notes |
Alert me of new notes |
CANSLIM.net Company Profile |
SEC |
Zacks Reports |
StockTalk |
News |
Chart |
Request a new note
C
A N
S L
I M
|
ULTA
-
NASDAQ
Ulta Salon Cosm & Frag
SPECIALTY RETAIL - Specialty Retail, Other
|
$96.34
|
-1.66
-1.69% |
$99.82
|
1,005,778
134.57% of 50 DAV
50 DAV is 747,400
|
$103.52
-6.94%
|
9/4/2012
|
$93.17
|
PP = $98.52
|
|
MB = $103.45
|
Most Recent Note - 10/16/2012 1:09:41 PM
Y - Undercut recent lows and violated its 50 DMA line with today's early weakness, yet it has managed a positive reversal after finding prompt support. Its Relative Strength Rating has slumped to 80, the minimum rank for ideal buy candidates under the fact-based investment system. The latest FSU analysis discussed its waning Relative Strength under the headline "Relative Strength Line Did Not Provide Confirmation - Friday, October 05, 2012".
>>> The latest Featured Stock Update with an annotated graph appeared on 10/5/2012. Click here.
View all notes |
Alert me of new notes |
CANSLIM.net Company Profile |
SEC |
Zacks Reports |
StockTalk |
News |
Chart |
Request a new note
C
A N
S L
I M
|
ULTI
-
NASDAQ
Ultimate Software Group
INTERNET - Internet Software and Services
|
$99.71
|
-2.04
-2.00% |
$101.84
|
146,219
100.22% of 50 DAV
50 DAV is 145,900
|
$106.40
-6.29%
|
8/27/2012
|
$98.36
|
PP = $99.19
|
|
MB = $104.15
|
Most Recent Note - 10/17/2012 4:19:50 PM
Y - Consolidating just above its 50 DMA line again, still perched within -6.3% of its 52-week high. Recent lows in the $96 area define near-term support to watch where violations would raise concerns and trigger technical sell signals.
>>> The latest Featured Stock Update with an annotated graph appeared on 9/27/2012. Click here.
View all notes |
Alert me of new notes |
CANSLIM.net Company Profile |
SEC |
Zacks Reports |
StockTalk |
News |
Chart |
Request a new note
C
A N
S L
I M
|
Symbol/Exchange
Company Name
Industry Group |
PRICE |
CHANGE
(%Change) |
Day High |
Volume
(% DAV)
(% 50 day avg vol) |
52 Wk Hi
% From Hi |
Featured
Date |
Price
Featured |
Pivot Featured |
|
Max Buy |
VSI
-
NYSE
Vitamin Shoppe Inc
SPECIALTY RETAIL - Specialty Retail, Other
|
$58.72
|
+0.88
1.52% |
$58.87
|
145,903
43.99% of 50 DAV
50 DAV is 331,700
|
$61.83
-5.02%
|
10/15/2012
|
$57.82
|
PP = $60.08
|
|
MB = $63.08
|
Most Recent Note - 10/15/2012 7:07:43 PM
Y - Volume totals have been below average in recent weeks while consolidating near its 50 DMA line. Color code is changed to yellow while still building on a new base, and subsequent volume-driven gains are needed to trigger a new technical buy signal. See latest FSU analysis for more details and a new annotated graph.
>>> The latest Featured Stock Update with an annotated graph appeared on 10/15/2012. Click here.
View all notes |
Alert me of new notes |
CANSLIM.net Company Profile |
SEC |
Zacks Reports |
StockTalk |
News |
Chart |
Request a new note
C
A N
S L
I M
|
WPI
-
NYSE
Watson Pharmaceuticals
DRUGS - Drugs - Generic
|
$88.03
|
-1.25
-1.40% |
$89.60
|
525,877
57.27% of 50 DAV
50 DAV is 918,300
|
$89.90
-2.08%
|
8/24/2012
|
$82.90
|
PP = $81.10
|
|
MB = $85.16
|
Most Recent Note - 10/16/2012 1:00:49 PM
G - Hitting new 52-week highs today with a big gain on below average volume. It is getting more extended from its prior base, and its 50 DMA line defines important support to watch on pullbacks.
>>> The latest Featured Stock Update with an annotated graph appeared on 9/28/2012. Click here.
View all notes |
Alert me of new notes |
CANSLIM.net Company Profile |
SEC |
Zacks Reports |
StockTalk |
News |
Chart |
Request a new note
C
A N
S L
I M
|