***Last / Change / Volume data in this table is the closing quote data***
Symbol/Exchange
Company Name
Industry Group |
PRICE |
CHANGE
(%Change) |
Day High |
Volume
(% DAV)
(% 50 day avg vol) |
52 Wk Hi
% From Hi |
Featured
Date |
Price
Featured |
Pivot Featured |
|
Max Buy |
ALGN
-
NASDAQ
Align Technology Inc
HEALTH SERVICES - Medical Appliances and Equipment
|
$28.18
|
-7.23
-20.42% |
$28.38
|
20,905,074
2,168.35% of 50 DAV
50 DAV is 964,100
|
$39.82
-29.23%
|
10/17/2012
|
$37.31
|
PP = $39.92
|
|
MB = $41.92
|
 Most Recent Note - 10/18/2012 9:59:10 AM
G - Gapped down today for a considerable loss after reporting earnings +4% on +8% sales for the Sep '12 quarter, well below the +25% minimum earnings guideline, and its color code is changed to green. This Medical - Supplies firm built an orderly base above its 50 DMA line and above prior highs in the $36 area, however it slumped under its 50 DMA line since highlighted in yellow with pivot point cited based on its 9/13/12 high plus 10 cents in the 10/17/12 mid-day report (read here) while noted - "Disciplined investors may watch for volume-driven gains above its pivot point which are needed to trigger a new technical buy signal. Last noted in the 7/27/12 mid-day report - 'Earnings rose +70% on +21% sales revenues for the quarter ended June 30, 2012 versus the year ago period, marking a 3rd consecutive quarterly earnings increase above the +25% minimum guideline (C criteria). Its annual earnings (A criteria) history has been good following a downturn in FY '08. Patient and disciplined investors may watch for a proper base to form while it continues consolidating.'" See the latest FSU analysis for more details an a new annotated graph.
>>> The latest Featured Stock Update with an annotated graph appeared on 10/17/2012. Click here.
View all notes |
Alert me of new notes |
CANSLIM.net Company Profile |
SEC |
Zacks Reports |
StockTalk |
News |
Chart |
Request a new note
C
A N
S L
I M


|
ALXN
-
NASDAQ
Alexion Pharmaceuticals
DRUGS - Drug Manufacturers - Other
|
$113.67
|
-0.92
-0.80% |
$116.85
|
821,496
90.68% of 50 DAV
50 DAV is 905,900
|
$119.54
-4.91%
|
8/23/2012
|
$103.70
|
PP = $110.06
|
|
MB = $115.56
|
Most Recent Note - 10/16/2012 1:03:11 PM
Y - Still consolidating above its 50 DMA line today after recently retreating below its "max buy" level. The prior highs in the $110 area define chart support along with its 50 DMA line where violations would raise concerns and trigger technical sell signals..
>>> The latest Featured Stock Update with an annotated graph appeared on 9/26/2012. Click here.
View all notes |
Alert me of new notes |
CANSLIM.net Company Profile |
SEC |
Zacks Reports |
StockTalk |
News |
Chart |
Request a new note
C
A N
S L
I M
|
ASPS
-
NASDAQ
Altisource Ptf Sltns Sa
REAL ESTATE - Property Management/Developmen
|
$111.84
|
-5.21
-4.45% |
$116.86
|
177,727
104.73% of 50 DAV
50 DAV is 169,700
|
$118.48
-5.60%
|
9/24/2012
|
$87.24
|
PP = $92.39
|
|
MB = $97.01
|
Most Recent Note - 10/18/2012 4:00:07 PM
G - Pulling back today on near average volume for 2nd consecutive loss while retreating from its all-time high. Very extended from its prior base, its prior highs in the $92 area define initial support to watch on pullbacks.
>>> The latest Featured Stock Update with an annotated graph appeared on 10/12/2012. Click here.
View all notes |
Alert me of new notes |
CANSLIM.net Company Profile |
SEC |
Zacks Reports |
StockTalk |
News |
Chart |
Request a new note
C
A N
S L
I M
|
BRLI
-
NASDAQ
Bio Reference Labs Inc
HEALTH SERVICES - Medical Laboratories and Researc
|
$32.12
|
+0.12
0.38% |
$32.38
|
457,477
155.13% of 50 DAV
50 DAV is 294,900
|
$32.86
-2.25%
|
10/3/2012
|
$30.90
|
PP = $30.25
|
|
MB = $31.76
|
Most Recent Note - 10/18/2012 12:20:56 PM
G - Churning above average volume without making meaningful price progress, yet still holding its ground stubbornly. Prior highs in the $30 area define initial chart support above its 50 DMA line.
>>> The latest Featured Stock Update with an annotated graph appeared on 10/8/2012. Click here.
View all notes |
Alert me of new notes |
CANSLIM.net Company Profile |
SEC |
Zacks Reports |
StockTalk |
News |
Chart |
Request a new note
C
A N
S L
I M
|
CFNL
-
NASDAQ
Cardinal Financial Corp
BANKING - Regional - Southeast Banks
|
$13.59
|
-0.65
-4.56% |
$14.31
|
171,556
210.24% of 50 DAV
50 DAV is 81,600
|
$14.79
-8.11%
|
8/17/2012
|
$12.84
|
PP = $13.31
|
|
MB = $13.98
|
Most Recent Note - 10/18/2012 4:34:23 PM
G - Damaging loss today with above average volume led to a close just below its 50 DMA line ($13.63 now) raising concerns and triggering a technical sell signal.
>>> The latest Featured Stock Update with an annotated graph appeared on 9/25/2012. Click here.
View all notes |
Alert me of new notes |
CANSLIM.net Company Profile |
SEC |
Zacks Reports |
StockTalk |
News |
Chart |
Request a new note
C
A N
S L
I M
|
Symbol/Exchange
Company Name
Industry Group |
PRICE |
CHANGE
(%Change) |
Day High |
Volume
(% DAV)
(% 50 day avg vol) |
52 Wk Hi
% From Hi |
Featured
Date |
Price
Featured |
Pivot Featured |
|
Max Buy |
CMCSA
-
NASDAQ
Comcast Corp Cl A
MEDIA - CATV Systems
|
$37.29
|
+0.17
0.46% |
$37.60
|
13,998,479
120.49% of 50 DAV
50 DAV is 11,618,100
|
$37.22
0.19%
|
6/11/2012
|
$29.94
|
PP = $30.98
|
|
MB = $32.53
|
Most Recent Note - 10/18/2012 4:36:01 PM
G - Posted a 5th consecutive gain today on higher volume and hit a new 52-week high. Found support while consolidating above prior highs in the $35 area and its 50 DMA line. Violations would trigger technical sell signals. Fundamental concerns have been repeatedly noted - "Due to sub par sales and earnings growth in the Jun '12 quarter."
>>> The latest Featured Stock Update with an annotated graph appeared on 9/21/2012. Click here.
View all notes |
Alert me of new notes |
CANSLIM.net Company Profile |
SEC |
Zacks Reports |
StockTalk |
News |
Chart |
Request a new note
C
A N
S L
I M
|
DVA
-
NYSE
Davita Inc
HEALTH SERVICES - Specialized Health Services
|
$113.07
|
+2.53
2.29% |
$113.48
|
940,073
125.43% of 50 DAV
50 DAV is 749,500
|
$111.34
1.55%
|
9/5/2012
|
$102.92
|
PP = $100.62
|
|
MB = $105.65
|
Most Recent Note - 10/18/2012 10:22:20 AM
G - Hitting another new 52-week high today, getting more extended from its latest sound base. Prior highs near $100 and its 50 DMA line define near-term support to watch on pullbacks where violations may trigger technical sell signals.
>>> The latest Featured Stock Update with an annotated graph appeared on 10/10/2012. Click here.
View all notes |
Alert me of new notes |
CANSLIM.net Company Profile |
SEC |
Zacks Reports |
StockTalk |
News |
Chart |
Request a new note
C
A N
S L
I M
|
GPX
-
NYSE
G P Strategies Corp
DIVERSIFIED SERVICES - Education and Training Services
|
$18.96
|
-0.72
-3.66% |
$19.80
|
26,701
41.92% of 50 DAV
50 DAV is 63,700
|
$20.67
-8.27%
|
10/8/2012
|
$20.00
|
PP = $20.77
|
|
MB = $21.81
|
Most Recent Note - 10/18/2012 4:39:01 PM
G - Slumped below its 50 DMA line today on light volume and finished at the session low and near recent lows. Losses exceeding its recent low ($18.82 on 10/04/12) would raise more serious concerns and trigger technical sell signals. Volume driven gains above the pivot point have not triggered a new (or add-on) technical buy signal.
>>> The latest Featured Stock Update with an annotated graph appeared on 10/16/2012. Click here.
View all notes |
Alert me of new notes |
CANSLIM.net Company Profile |
SEC |
Zacks Reports |
StockTalk |
News |
Chart |
Request a new note
C
A N
S L
I M
|
LKQ
-
NASDAQ
L K Q Corp
WHOLESALE - Auto Parts
|
$20.80
|
-0.07
-0.34% |
$21.22
|
1,687,322
115.80% of 50 DAV
50 DAV is 1,457,100
|
$21.05
-1.19%
|
8/9/2012
|
$18.97
|
PP = $18.72
|
|
MB = $19.66
|
Most Recent Note - 10/18/2012 4:40:15 PM
G - Held its ground near its all-time high today. Recently rallied well above its "max buy" level with no resistance remaining due to overhead supply.
>>> The latest Featured Stock Update with an annotated graph appeared on 9/17/2012. Click here.
View all notes |
Alert me of new notes |
CANSLIM.net Company Profile |
SEC |
Zacks Reports |
StockTalk |
News |
Chart |
Request a new note
C
A N
S L
I M
|
LNKD
-
NYSE
Linkedin Corp Class A
INTERNET - Internet Information Providers
|
$108.87
|
-0.55
-0.50% |
$109.99
|
3,193,573
157.46% of 50 DAV
50 DAV is 2,028,200
|
$125.50
-13.25%
|
9/5/2012
|
$113.25
|
PP = $113.10
|
|
MB = $118.76
|
Most Recent Note - 10/18/2012 4:44:00 PM
G - Posted a small loss on above average volume today, ending the session in the upper third of its intra-day range after deeper intra-day losses. A prompt rebound above its 50 DMA line still is needed to help its technical stance and help its outlook improve.
>>> The latest Featured Stock Update with an annotated graph appeared on 10/9/2012. Click here.
View all notes |
Alert me of new notes |
CANSLIM.net Company Profile |
SEC |
Zacks Reports |
StockTalk |
News |
Chart |
Request a new note
C
A N
S L
I M
|
Symbol/Exchange
Company Name
Industry Group |
PRICE |
CHANGE
(%Change) |
Day High |
Volume
(% DAV)
(% 50 day avg vol) |
52 Wk Hi
% From Hi |
Featured
Date |
Price
Featured |
Pivot Featured |
|
Max Buy |
LULU
-
NASDAQ
Lululemon Athletica
MANUFACTURING - Textile Manufacturing
|
$74.65
|
-0.70
-0.93% |
$75.85
|
944,942
40.85% of 50 DAV
50 DAV is 2,313,200
|
$81.09
-7.95%
|
10/2/2012
|
$74.89
|
PP = $78.97
|
|
MB = $82.92
|
Most Recent Note - 10/16/2012 3:44:05 PM
Y - Volume totals have been cooling while consolidating since recently highlighted again in yellow. Volume-driven gains above its pivot point are still needed to confirm a technical buy signal before action may be justified by disciplined investors.
>>> The latest Featured Stock Update with an annotated graph appeared on 10/2/2012. Click here.
View all notes |
Alert me of new notes |
CANSLIM.net Company Profile |
SEC |
Zacks Reports |
StockTalk |
News |
Chart |
Request a new note
C
A N
S L
I M
|
MIDD
-
NASDAQ
Middleby Corp
MANUFACTURING - Diversified Machinery
|
$123.75
|
+0.89
0.72% |
$123.95
|
49,634
48.90% of 50 DAV
50 DAV is 101,500
|
$122.97
0.63%
|
10/8/2012
|
$118.46
|
PP = $122.67
|
|
MB = $128.80
|
Most Recent Note - 10/16/2012 3:46:22 PM
Y - Poised for a best-ever close with a quiet gain today and trading just -1.3% off its 52-week high. Volume totals have been below average in recent weeks while stubbornly holding its ground. Subsequent volume-driven gains above the pivot point may trigger a new (or add-on) technical buy signal. Its 50 DMA line and recent lows define near-term chart support to watch.
>>> The latest Featured Stock Update with an annotated graph appeared on 9/18/2012. Click here.
View all notes |
Alert me of new notes |
CANSLIM.net Company Profile |
SEC |
Zacks Reports |
StockTalk |
News |
Chart |
Request a new note
C
A N
S L
I M
|
N
-
NYSE
Netsuite Inc
DIVERSIFIED SERVICES - Business/Management Services
|
$61.45
|
-0.62
-1.00% |
$62.73
|
326,821
72.51% of 50 DAV
50 DAV is 450,700
|
$64.70
-5.02%
|
8/20/2012
|
$55.88
|
PP = $59.32
|
|
MB = $62.29
|
Most Recent Note - 10/17/2012 4:25:46 PM
Y - Quietly consolidating today just below its "max buy" level. Prior highs near $59 closely coincide with its 50 DMA line defining important chart support where subsequent violations would trigger technical sell signals.
>>> The latest Featured Stock Update with an annotated graph appeared on 9/24/2012. Click here.
View all notes |
Alert me of new notes |
CANSLIM.net Company Profile |
SEC |
Zacks Reports |
StockTalk |
News |
Chart |
Request a new note
C
A N
S L
I M
|
NSM
-
NYSE
Nationstar Mtg Hldgs Inc
FINANCIAL SERVICES - Credit Services
|
$33.70
|
-0.11
-0.33% |
$33.86
|
392,710
32.44% of 50 DAV
50 DAV is 1,210,400
|
$37.20
-9.41%
|
8/29/2012
|
$27.96
|
PP = $28.85
|
|
MB = $30.29
|
Most Recent Note - 10/17/2012 4:27:23 PM
G - Tallied a 3rd consecutive gain today with near average volume. A steep upward trendline connecting July-September lows defines a near-term support level to watch above its 50 DMA line.
>>> The latest Featured Stock Update with an annotated graph appeared on 10/11/2012. Click here.
View all notes |
Alert me of new notes |
CANSLIM.net Company Profile |
SEC |
Zacks Reports |
StockTalk |
News |
Chart |
Request a new note
C
A N
S L
I M
|
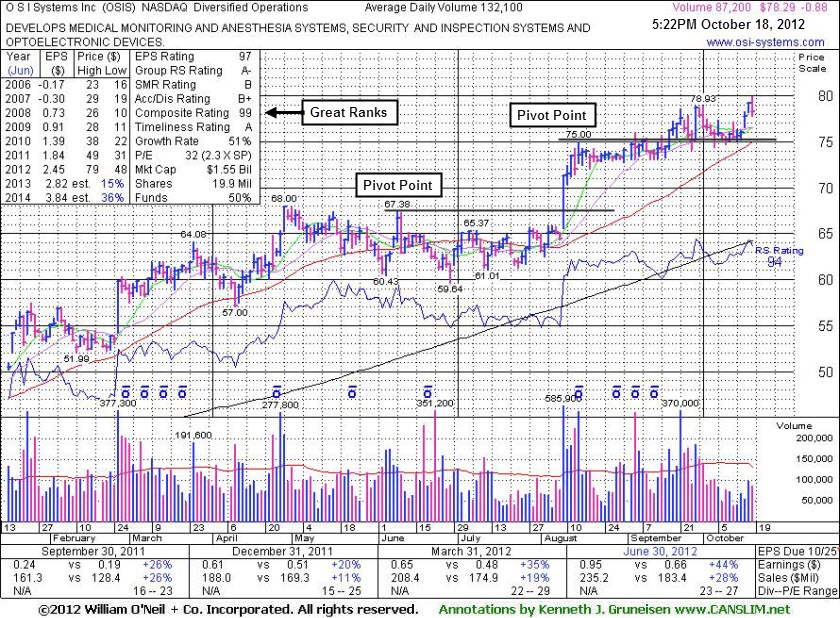
OSIS
-
NASDAQ
O S I Systems Inc
ELECTRONICS - Semiconductor Equipment and Mate
|
$78.29
|
-0.88
-1.11% |
$79.90
|
88,960
67.34% of 50 DAV
50 DAV is 132,100
|
$79.28
-1.25%
|
9/5/2012
|
$74.39
|
PP = $75.10
|
|
MB = $78.86
|
Most Recent Note - 10/18/2012 5:49:13 PM
Y - Touched a new 52-week high today and then reversed into the red for a quiet loss. See the latest FSU analysis for more details and a new annotated graph.
>>> The latest Featured Stock Update with an annotated graph appeared on 10/18/2012. Click here.
View all notes |
Alert me of new notes |
CANSLIM.net Company Profile |
SEC |
Zacks Reports |
StockTalk |
News |
Chart |
Request a new note
C
A N
S L
I M
|
Symbol/Exchange
Company Name
Industry Group |
PRICE |
CHANGE
(%Change) |
Day High |
Volume
(% DAV)
(% 50 day avg vol) |
52 Wk Hi
% From Hi |
Featured
Date |
Price
Featured |
Pivot Featured |
|
Max Buy |
RNF
-
NYSE
Rentech Nitrogen Ptnr Lp
CHEMICALS - Agricultural Chemicals
|
$37.26
|
+0.15
0.40% |
$37.50
|
276,207
66.86% of 50 DAV
50 DAV is 413,100
|
$40.05
-6.97%
|
7/27/2012
|
$29.58
|
PP = $30.60
|
|
MB = $32.13
|
Most Recent Note - 10/16/2012 12:58:19 PM
G - Considerable gain today, rallying from its 50 DMA line defining important near-term support after the previously noted upward trendline violation. Gains have lacked volume conviction after it halted its slide.
>>> The latest Featured Stock Update with an annotated graph appeared on 10/4/2012. Click here.
View all notes |
Alert me of new notes |
CANSLIM.net Company Profile |
SEC |
Zacks Reports |
StockTalk |
News |
Chart |
Request a new note
C
A N
S L
I M
|
SWI
-
NYSE
Solarwinds Inc
COMPUTER SOFTWARE and SERVICES - Application Software
|
$50.46
|
-1.33
-2.57% |
$51.66
|
1,087,862
137.37% of 50 DAV
50 DAV is 791,900
|
$60.95
-17.21%
|
7/25/2012
|
$47.82
|
PP = $47.89
|
|
MB = $50.28
|
Most Recent Note - 10/18/2012 4:47:11 PM
G - Slumped on higher (and above average) volume to 12-week lows today after recent gains lacked volume conviction. Due to report earnings on Thursday, October 25th. Caution is advised unless strength returns and it rises back above its 50 DMA line promptly. Prior highs in the $48 area define the next chart support level.
>>> The latest Featured Stock Update with an annotated graph appeared on 10/3/2012. Click here.
View all notes |
Alert me of new notes |
CANSLIM.net Company Profile |
SEC |
Zacks Reports |
StockTalk |
News |
Chart |
Request a new note
C
A N
S L
I M
|
TDG
-
NYSE
Transdigm Group Inc
AEROSPACE/DEFENSE - Aerospace/Defense Products and; Services
|
$148.75
|
-0.25
-0.17% |
$150.66
|
669,992
156.69% of 50 DAV
50 DAV is 427,600
|
$152.62
-2.54%
|
8/16/2012
|
$132.23
|
PP = $136.44
|
|
MB = $143.26
|
Most Recent Note - 10/18/2012 4:49:35 PM
G - Churned above average volume for a 3rd session in a row today without making meaningful price progress. Its 50 DMA line defines near-term support to watch above recent lows in the $138 area where violations may trigger technical sell signals.
>>> The latest Featured Stock Update with an annotated graph appeared on 9/20/2012. Click here.
View all notes |
Alert me of new notes |
CANSLIM.net Company Profile |
SEC |
Zacks Reports |
StockTalk |
News |
Chart |
Request a new note
C
A N
S L
I M
|
ULTA
-
NASDAQ
Ulta Salon Cosm & Frag
SPECIALTY RETAIL - Specialty Retail, Other
|
$95.55
|
-0.79
-0.82% |
$96.71
|
1,994,441
262.53% of 50 DAV
50 DAV is 759,700
|
$103.52
-7.70%
|
9/4/2012
|
$93.17
|
PP = $98.52
|
|
MB = $103.45
|
Most Recent Note - 10/18/2012 1:13:56 PM
G - Color code is changed to green while encountering distributional pressure and sputtering near its 50 DMA line. Its Relative Strength Rating has slumped to 77, below the 80+ minimum rank for ideal buy candidates under the fact-based investment system. The latest FSU analysis discussed its waning Relative Strength under the headline "Relative Strength Line Did Not Provide Confirmation - Friday, October 05, 2012".
>>> The latest Featured Stock Update with an annotated graph appeared on 10/5/2012. Click here.
View all notes |
Alert me of new notes |
CANSLIM.net Company Profile |
SEC |
Zacks Reports |
StockTalk |
News |
Chart |
Request a new note
C
A N
S L
I M
|
ULTI
-
NASDAQ
Ultimate Software Group
INTERNET - Internet Software and Services
|
$99.40
|
-0.31
-0.31% |
$99.91
|
95,335
66.20% of 50 DAV
50 DAV is 144,000
|
$106.40
-6.58%
|
8/27/2012
|
$98.36
|
PP = $99.19
|
|
MB = $104.15
|
Most Recent Note - 10/17/2012 4:19:50 PM
Y - Consolidating just above its 50 DMA line again, still perched within -6.3% of its 52-week high. Recent lows in the $96 area define near-term support to watch where violations would raise concerns and trigger technical sell signals.
>>> The latest Featured Stock Update with an annotated graph appeared on 9/27/2012. Click here.
View all notes |
Alert me of new notes |
CANSLIM.net Company Profile |
SEC |
Zacks Reports |
StockTalk |
News |
Chart |
Request a new note
C
A N
S L
I M
|
Symbol/Exchange
Company Name
Industry Group |
PRICE |
CHANGE
(%Change) |
Day High |
Volume
(% DAV)
(% 50 day avg vol) |
52 Wk Hi
% From Hi |
Featured
Date |
Price
Featured |
Pivot Featured |
|
Max Buy |
VSI
-
NYSE
Vitamin Shoppe Inc
SPECIALTY RETAIL - Specialty Retail, Other
|
$57.76
|
-0.96
-1.63% |
$58.96
|
137,394
43.56% of 50 DAV
50 DAV is 315,400
|
$61.83
-6.58%
|
10/15/2012
|
$57.82
|
PP = $60.08
|
|
MB = $63.08
|
Most Recent Note - 10/15/2012 7:07:43 PM
Y - Volume totals have been below average in recent weeks while consolidating near its 50 DMA line. Color code is changed to yellow while still building on a new base, and subsequent volume-driven gains are needed to trigger a new technical buy signal. See latest FSU analysis for more details and a new annotated graph.
>>> The latest Featured Stock Update with an annotated graph appeared on 10/15/2012. Click here.
View all notes |
Alert me of new notes |
CANSLIM.net Company Profile |
SEC |
Zacks Reports |
StockTalk |
News |
Chart |
Request a new note
C
A N
S L
I M
|
WPI
-
NYSE
Watson Pharmaceuticals
DRUGS - Drugs - Generic
|
$87.83
|
-0.20
-0.23% |
$88.22
|
444,144
48.67% of 50 DAV
50 DAV is 912,500
|
$89.90
-2.30%
|
8/24/2012
|
$82.90
|
PP = $81.10
|
|
MB = $85.16
|
Most Recent Note - 10/16/2012 1:00:49 PM
G - Hitting new 52-week highs today with a big gain on below average volume. It is getting more extended from its prior base, and its 50 DMA line defines important support to watch on pullbacks.
>>> The latest Featured Stock Update with an annotated graph appeared on 9/28/2012. Click here.
View all notes |
Alert me of new notes |
CANSLIM.net Company Profile |
SEC |
Zacks Reports |
StockTalk |
News |
Chart |
Request a new note
C
A N
S L
I M
|