You are not logged in.
This means you
CAN ONLY VIEW reports that were published prior to Monday, February 26, 2024.
You
MUST UPGRADE YOUR MEMBERSHIP if you want to see any current reports.
AFTER MARKET UPDATE - TUESDAY, OCTOBER 15TH, 2019
Previous After Market Report Next After Market Report >>>
|
|
|
|
DOW |
+237.44 |
27,024.80 |
+0.89% |
|
Volume |
733,742,270 |
+16% |
|
Volume |
1,830,674,770 |
+30% |
|
NASDAQ |
+100.06 |
8,148.71 |
+1.24% |
|
Advancers |
1,846 |
65% |
|
Advancers |
2,209 |
72% |
|
S&P 500 |
+29.53 |
2,995.68 |
+1.00% |
|
Decliners |
1,015 |
35% |
|
Decliners |
862 |
28% |
|
Russell 2000 |
+17.87 |
1,523.30 |
+1.19% |
|
52 Wk Highs |
102 |
|
|
52 Wk Highs |
68 |
|
|
S&P 600 |
+10.15 |
942.32 |
+1.09% |
|
52 Wk Lows |
21 |
|
|
52 Wk Lows |
72 |
|
|
 |
Volume Rose Behind Gains as Leadership Improved
Kenneth J. Gruneisen - Passed the CAN SLIM® Master's Exam
The Dow rose 237 points, while the Nasdaq Composite jumped 1.2%. The S&P 500 added 1.0%, while also finishing less than one percent from an all-time high. Volume totals reported were higher than the prior session totals on the Nasdaq exchange and on the NYSE, an encouraging sign of increased buying demand from the institutional crowd. Breadth was positive as advancers led decliners by a 9-5 margin on the NYSE and 11-4 on the Nasdaq exchange. Leadership improved as there were 28 high-ranked companies from the Leaders List that hit a new 52-week high and were listed on the BreakOuts Page, versus the total of 7 on the prior session. New 52-week highs outnumbered new 52-week lows on the NYSE, but new lows still narrowly outnumbered new highs on the Nasdaq exchange. The uptrend for the major indices (M criteria) had recently come under greater pressure, however, the strong finish last week avoided a more worrisome "correction" in the market . The Featured Stocks Page provides the most timely analysis on high-ranked leaders. Charts used courtesy of www.stockcharts.com
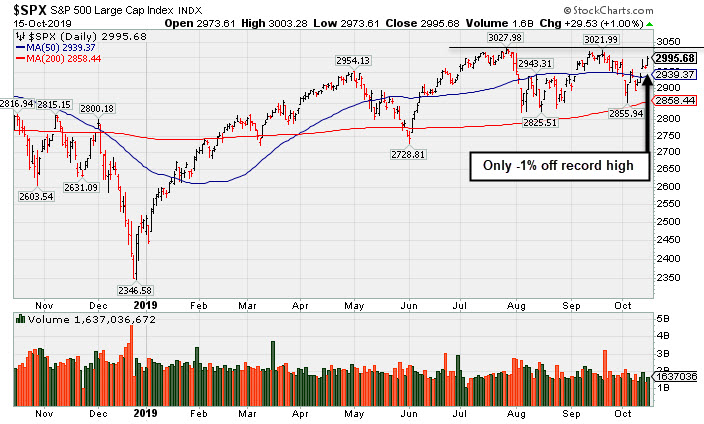
PICTURED: The S&P 500 Index is perched only -1% off its record high.
Stocks finished higher Tuesday as the unofficial start to earnings season kicked off with better than expected corporate results. Nine of 11 S&P 500 sectors ended the day in positive territory with Financials and Health Care stocks leading the way.
JP Morgan Chase & Co (JPM +3.01%) hit an all-time high after posting its seventh-straight quarter of rising profits. Citigroup’s (C +1.40%) quarterly report also exceeded Wall Street expectations. Goldman Sachs (GS +0.31%) inched higher despite a 26% year-over-year drop in earnings. Elsewhere in Financials, Charles Schwab (SCHW +5.36%) rose after reporting record client assets on the heels of the discount broker’s move to charge zero commissions. In the Health Care space, Johnson and Johnson (JNJ +1.62%) rose following its top and bottom line beat. UnitedHealth Group (UNH +8.16%) was higher, recording its best daily gain in three years after besting profit and revenue projections, as well as raising its full-year guidance amid steadying medical costs. NVIDIA (NVDA +5.28%) rose to a 11-month high after receiving a price target boost.
In geopolitical news, reports indicated Beijing would have a difficult time purchasing the $50 billion of U.S. agricultural products cited in Friday’s outline of an initial trade agreement unless retaliatory tariffs are removed. The U.K. and European Union are finding middle ground amid optimistic reports of a draft for a Brexit deal. Treasuries declined with the yield on the 10-year note up four basis points to 1.77%.
|
 Kenneth J. Gruneisen started out as a licensed stockbroker in August 1987, a couple of months prior to the historic stock market crash that took the Dow Jones Industrial Average down -22.6% in a single day. He has published daily fact-based fundamental and technical analysis on high-ranked stocks online for two decades. Through FACTBASEDINVESTING.COM, Kenneth provides educational articles, news, market commentary, and other information regarding proven investment systems that work in good times and bad.
Comments contained in the body of this report are technical opinions only and are not necessarily those of Gruneisen Growth Corp. The material herein has been obtained from sources believed to be reliable and accurate, however, its accuracy and completeness cannot be guaranteed. Our firm, employees, and customers may effect transactions, including transactions contrary to any recommendation herein, or have positions in the securities mentioned herein or options with respect thereto. Any recommendation contained in this report may not be suitable for all investors and it is not to be deemed an offer or solicitation on our part with respect to the purchase or sale of any securities. |
|
 |
Financial, Retail, and Tech Groups Rose
Kenneth J. Gruneisen - Passed the CAN SLIM® Master's Exam
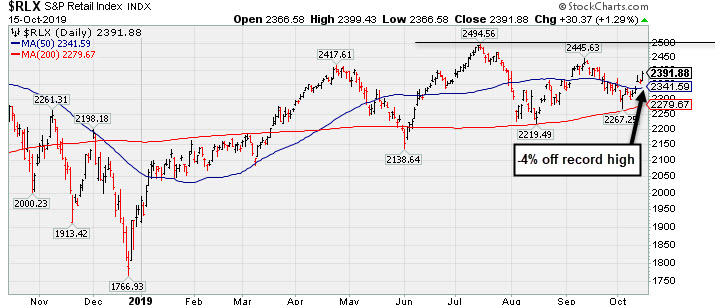
The Broker/Dealer Index ($XBD +1.48%) and the Bank Index ($BKX +1.83%) both posted solid gains while the Retail Index ($RLX +1.29%) rose. The tech sector had a positive bias as the Semiconductor Index ($SOX +2.22%) and the Biotech Index ($BTK +1.74%) both outpaced the Networking Index ($NWX +0.84%). The Oil Services Index ($OSX -0.03%) finished flat and the Integrated Oil Index ($XOI +0.38%) edged higher, meanwhile, the Gold & Silver Index ($XAU -2.71%) was a standout decliner.
PICTURED: The Retail Index ($RLX +1.29%) recently rebounded above its 50-day moving average (DMA) lines and it is perched only -4% off its record high.
| Oil Services |
$OSX |
65.01 |
-0.02 |
-0.03% |
-19.34% |
| Integrated Oil |
$XOI |
1,201.91 |
+4.55 |
+0.38% |
+3.69% |
| Semiconductor |
$SOX |
1,625.69 |
+35.29 |
+2.22% |
+40.73% |
| Networking |
$NWX |
552.27 |
+4.62 |
+0.84% |
+13.02% |
| Broker/Dealer |
$XBD |
257.88 |
+3.77 |
+1.48% |
+8.66% |
| Retail |
$RLX |
2,391.88 |
+30.37 |
+1.29% |
+22.57% |
| Gold & Silver |
$XAU |
86.87 |
-2.42 |
-2.71% |
+22.94% |
| Bank |
$BKX |
100.49 |
+1.81 |
+1.83% |
+17.13% |
| Biotech |
$BTK |
4,301.84 |
+73.49 |
+1.74% |
+1.92% |
|
|
|
 |
Featured Stocks
Kenneth J. Gruneisen - Passed the CAN SLIM® Master's Exam
See the Featured Stocks with most recent note below. Feel free to contact us if you have a need for any additional information. |
|
|
Color Codes Explained :
Y - Better candidates highlighted by our
staff of experts.
G - Previously featured
in past reports as yellow but may no longer be buyable under the
guidelines.
***Last / Change / Volume data in this table is the closing quote data***
Symbol/Exchange
Company Name
Industry Group |
PRICE |
CHANGE
(%Change) |
Day High |
Volume
(% DAV)
(% 50 day avg vol) |
52 Wk Hi
% From Hi |
Featured
Date |
Price
Featured |
Pivot Featured |
|
Max Buy |
 MLR
-
NYSE
MLR
-
NYSE
Miller Industries Inc
AUTOMOTIVE - Auto Parts
|
$32.63
|
+0.80
2.51% |
$32.87
|
21,064
63.83% of 50 DAV
50 DAV is 33,000
|
$35.26
-7.46%
|
9/24/2019
|
$34.00
|
PP = $35.36
|
|
MB = $37.13
|
 Most Recent Note - 10/15/2019 1:45:03 PM
G - Halted its slide recently at its 200 DMA line, and a rebound above its 50 DMA line ($32.36) may help its outlook to improve. Subsequent gains above the pivot point backed by at least +40% above average volume may trigger a technical buy signal. Fundamentals remain strong.
>>> FEATURED STOCK ARTICLE : Tested Support at Long-Term 200-Day Moving Average - 10/9/2019 |
View all notes |
Set NEW NOTE alert |
Company Profile |
SEC
News |
Chart |
Request a new note
C
A
S
I |
CCBG
-
NASDAQ
Capital City Bk Gp
BANKING - Regional - Mid-Atlantic Banks
|
$26.89
|
+0.14
0.52% |
$27.29
|
28,450
105.37% of 50 DAV
50 DAV is 27,000
|
$28.00
-3.96%
|
9/13/2019
|
$27.03
|
PP = $27.05
|
|
MB = $28.40
|
Most Recent Note - 10/14/2019 5:16:50 PM
Y - Still hovering near its 52-week high. Prior highs define initial support to watch above its 50 DMA line ($25.58). Due to report earnings news on 10/21/19. See the latest FSU analysis for more details,
>>> FEATURED STOCK ARTICLE : Perched Near High With Earnings News Due Next Week - 10/14/2019 |
View all notes |
Set NEW NOTE alert |
Company Profile |
SEC
News |
Chart |
Request a new note
C
A
S
I |
EPAM
-
NYSE
Epam Systems Inc
COMPUTER SOFTWARE and SERVICES - Information Technology Service
|
$189.95
|
+1.75
0.93% |
$190.74
|
137,360
39.93% of 50 DAV
50 DAV is 344,000
|
$201.00
-5.50%
|
5/9/2019
|
$169.25
|
PP = $180.55
|
|
MB = $189.58
|
Most Recent Note - 10/15/2019 1:37:57 PM
G - Consolidating above its 50 DMA line ($186.58). Faces little resistance due to overhead supply up to the $201 level. Prior lows in the $174-175 area define the next important support level. Reported earnings +27% on +24% sales revenues for the Jun '19 quarter.
>>> FEATURED STOCK ARTICLE : Slumped and Sputtered Below 50-Day Moving Average - 9/30/2019 |
View all notes |
Set NEW NOTE alert |
Company Profile |
SEC
News |
Chart |
Request a new note
C
A
S
I |
AUDC
-
NASDAQ
Audiocodes Ltd
ELECTRONICS - Scientific and Technical Instrum
|
$18.16
|
+0.37
2.08% |
$18.36
|
122,034
61.63% of 50 DAV
50 DAV is 198,000
|
$22.50
-19.29%
|
9/13/2019
|
$19.68
|
PP = $19.84
|
|
MB = $20.83
|
Most Recent Note - 10/15/2019 1:18:50 PM
G - A rebound above its 50 DMA line ($18.43) is needed for its outlook to improve. That short-term average may act as resistance. Prior lows in the $16.50 area define the next important support.
>>> FEATURED STOCK ARTICLE : Sank Below 50-Day Average as 7 Straight Losses Follow Reversal - 10/2/2019 |
View all notes |
Set NEW NOTE alert |
Company Profile |
SEC
News |
Chart |
Request a new note
C
A
S
I |
CHDN
-
NASDAQ
Churchill Downs Inc
LEISURE - Gaming Activities
|
$129.87
|
-0.52
-0.40% |
$131.43
|
304,700
136.03% of 50 DAV
50 DAV is 224,000
|
$132.73
-2.15%
|
10/8/2019
|
$129.77
|
PP = $132.83
|
|
MB = $139.47
|
Most Recent Note - 10/15/2019 12:38:09 PM
Y - Stubbornly holding its ground near its all-time high following volume-driven gains last week. Subsequent gains above the pivot point backed by at least +40% above average volume may trigger a new (or add-on) technical buy signal. Its 50 DMA line ($123.42) acted as support in recent weeks during its consolidation. Jun '19 earnings +10% on +26% sales revenues versus the year ago period were below the +25% minimum earnings guideline (C criteria), noted recently raising fundamental concerns.
>>> FEATURED STOCK ARTICLE : Volume-Driven Gain for Record High Close - 10/8/2019 |
View all notes |
Set NEW NOTE alert |
Company Profile |
SEC
News |
Chart |
Request a new note
C
A
S
I |
Symbol/Exchange
Company Name
Industry Group |
PRICE |
CHANGE
(%Change) |
Day High |
Volume
(% DAV)
(% 50 day avg vol) |
52 Wk Hi
% From Hi |
Featured
Date |
Price
Featured |
Pivot Featured |
|
Max Buy |
LULU
-
NASDAQ
Lululemon Athletica
MANUFACTURING - Textile Manufacturing
|
$203.89
|
+0.85
0.42% |
$205.40
|
2,062,777
112.78% of 50 DAV
50 DAV is 1,829,000
|
$205.11
-0.59%
|
9/6/2019
|
$201.25
|
PP = $194.35
|
|
MB = $204.07
|
Most Recent Note - 10/15/2019 1:40:44 PM
Y - Quietly touching new all-time highs this week and trading near its "max buy" level. Its 50 DMA line ($188.75) and recent low ($185.36 on 10/03/19) define important near-term support where more damaging losses would raise serious concerns and trigger technical sell signals.
>>> FEATURED STOCK ARTICLE : Found Support After Undercutting 50-Day Moving Average - 10/3/2019 |
View all notes |
Set NEW NOTE alert |
Company Profile |
SEC
News |
Chart |
Request a new note
C
A
S
I |
CPRT
-
NASDAQ
Copart Inc
SPECIALTY RETAIL - Auto Dealerships
|
$81.74
|
+0.06
0.07% |
$82.48
|
933,836
64.99% of 50 DAV
50 DAV is 1,437,000
|
$83.70
-2.34%
|
9/5/2019
|
$79.13
|
PP = $79.84
|
|
MB = $83.83
|
Most Recent Note - 10/9/2019 5:52:19 PM
Y - Color code is changed to yellow after finding support above its 50 DMA line ($78.16) and trading back above its pivot point helping its outlook improve.
>>> FEATURED STOCK ARTICLE : Found Prompt Support Near 50-Day Moving Average - 10/4/2019 |
View all notes |
Set NEW NOTE alert |
Company Profile |
SEC
News |
Chart |
Request a new note
C
A
S
I |
PFPT
-
NASDAQ
Proofpoint Inc
Computer Sftwr-Security
|
$131.76
|
+2.12
1.64% |
$131.87
|
490,227
67.62% of 50 DAV
50 DAV is 725,000
|
$133.58
-1.36%
|
10/1/2019
|
$129.59
|
PP = $132.95
|
|
MB = $139.60
|
Most Recent Note - 10/15/2019 1:43:09 PM
Y - Perched at its all-time high, it has met stubborn resistance in the $132 area in recent months. Its 50 DMA line ($122.38) defines near-term support. Subsequent gains above the pivot point backed by at least +40% above average volume may trigger a technical buy signal.
>>> FEATURED STOCK ARTICLE : Challenging Previously Stubborn Resistance - 10/1/2019 |
View all notes |
Set NEW NOTE alert |
Company Profile |
SEC
News |
Chart |
Request a new note
C
A
S
I |
BLD
-
NYSE
Topbuild Corp
Bldg-Constr Prds/Misc
|
$99.52
|
+0.89
0.90% |
$99.98
|
204,794
79.69% of 50 DAV
50 DAV is 257,000
|
$99.26
0.26%
|
5/17/2019
|
$82.19
|
PP = $87.31
|
|
MB = $91.68
|
Most Recent Note - 10/9/2019 5:49:29 PM
G - Posted a quiet gain today for a best-ever close. Stayed above its 50 DMA line, and challenging its all-time high, it is extended from the prior base after wedging higher with gains lacking great volume conviction. Earnings rose +39% on +9% sales revenues for the Jun '19 quarter versus the year ago period. Its 50 DMA line ($92.186) defines important support to watch along with its prior low ($86.53 on 8/28/19).
>>> FEATURED STOCK ARTICLE : Near High After Finding Support at 50-Day Average - 10/7/2019 |
View all notes |
Set NEW NOTE alert |
Company Profile |
SEC
News |
Chart |
Request a new note
C
A
S
I |
PAGS
-
NYSE
Pagseguro Digital Cl A
Finance-CrdtCard/PmtPr
|
$40.60
|
-5.69
-12.29% |
$41.58
|
14,565,015
914.89% of 50 DAV
50 DAV is 1,592,000
|
$53.43
-24.01%
|
6/25/2019
|
$37.69
|
PP = $40.07
|
|
MB = $42.07
|
Most Recent Note - 10/15/2019 1:16:26 PM
G - Gapped down today violating prior lows in the $42-43 area triggering a worrisome technical sell signal. A rebound above the 50 DMA line ($47.29) still is needed for its outlook to improve.
>>> FEATURED STOCK ARTICLE : Rebound Above 50-Day Average Needed for Outlook to Improve - 10/10/2019 |
View all notes |
Set NEW NOTE alert |
Company Profile |
SEC
News |
Chart |
Request a new note
C
A
S
I |
Symbol/Exchange
Company Name
Industry Group |
PRICE |
CHANGE
(%Change) |
Day High |
Volume
(% DAV)
(% 50 day avg vol) |
52 Wk Hi
% From Hi |
Featured
Date |
Price
Featured |
Pivot Featured |
|
Max Buy |
|
|
|
THESE ARE NOT BUY RECOMMENDATIONS!
Comments contained in the body of this report are technical
opinions only. The material herein has been obtained
from sources believed to be reliable and accurate, however,
its accuracy and completeness cannot be guaranteed.
This site is not an investment advisor, hence it does
not endorse or recommend any securities or other investments.
Any recommendation contained in this report may not
be suitable for all investors and it is not to be deemed
an offer or solicitation on our part with respect to
the purchase or sale of any securities. All trademarks,
service marks and trade names appearing in this report
are the property of their respective owners, and are
likewise used for identification purposes only.
This report is a service available
only to active Paid Premium Members.
You may opt-out of receiving report notifications
at any time. Questions or comments may be submitted
by writing to Premium Membership Services 665 S.E. 10 Street, Suite 201 Deerfield Beach, FL 33441-5634 or by calling 1-800-965-8307
or 954-785-1121.
|
|
|