You are not logged in.
This means you
CAN ONLY VIEW reports that were published prior to Monday, February 26, 2024.
You
MUST UPGRADE YOUR MEMBERSHIP if you want to see any current reports.
AFTER MARKET UPDATE - MONDAY, OCTOBER 14TH, 2019
Previous After Market Report Next After Market Report >>>
|
|
|
|
DOW |
-29.23 |
26,787.36 |
-0.11% |
|
Volume |
631,486,290 |
-27% |
|
Volume |
1,404,643,331 |
-36% |
|
NASDAQ |
-8.39 |
8,048.65 |
-0.10% |
|
Advancers |
1,275 |
45% |
|
Advancers |
1,238 |
40% |
|
S&P 500 |
-4.12 |
2,966.15 |
-0.14% |
|
Decliners |
1,569 |
55% |
|
Decliners |
1,823 |
60% |
|
Russell 2000 |
-6.47 |
1,505.43 |
-0.43% |
|
52 Wk Highs |
74 |
|
|
52 Wk Highs |
35 |
|
|
S&P 600 |
-3.43 |
932.17 |
-0.37% |
|
52 Wk Lows |
47 |
|
|
52 Wk Lows |
116 |
|
|
 |
Major Indices Dip With Lighter Volume Totals
Kenneth J. Gruneisen - Passed the CAN SLIM® Master's Exam
The Dow dipped 29 points, snapping a three-day winning streak. The S&P 500 and Nasdaq Composite each lost 0.1%.. Volume totals reported were lighter than the prior session totals on the Nasdaq exchange and on the NYSE. Breadth was slightly negative as decliners led advancers by a 4-3 margin on the NYSE and 3-2 on the Nasdaq exchange. Leadership thinned abruptly as there were only 7 high-ranked companies from the Leaders List that hit a new 52-week high and were listed on the BreakOuts Page, versus the total of 41 on the prior session. New 52-week highs outnumbered new 52-week lows on the NYSE, but new lows still outnumbered new highs on the Nasdaq exchange. The uptrend for the major indices (M criteria) had recently come under greater pressure, however, the strong finish last week avoided a more worrisome "correction" in the market . The Featured Stocks Page provides the most timely analysis on high-ranked leaders. Charts used courtesy of www.stockcharts.com
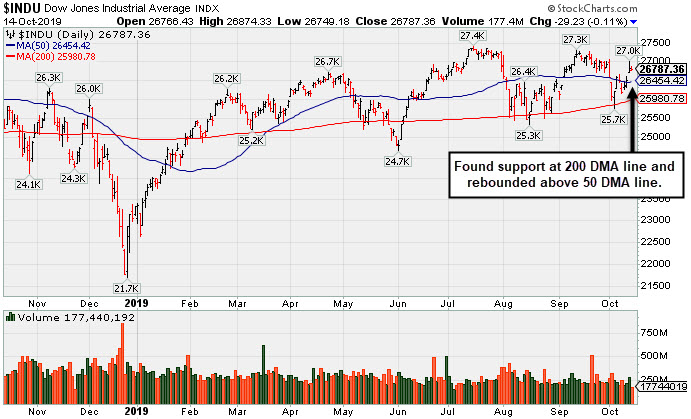
PICTURED: The Dow Jones Industrial Average rebounded above its 50-day moving average (DMA) line last week after finding support at its 200 DMA line and above prior lows. It is perched only -2.2% off its record high.
Stocks edged lower Monday amid fading U.S.-China trade optimism. Reports indicated Beijing would need to engage in further talks before signing an initial trade deal announced Friday. Treasury Secretary Mnuchin commented this morning that both parties had made “substantial progress,” though the pact is still “subject to documentation.” Mnuchin also admitted that the tariffs are still set to rise in December if no deal is reached by then.
The S&P 500 ended a three-week losing streak last Friday on news the U.S. and China agreed to a “phase one” trade agreement. Washington canceled a tariff hike on Chinese imports that was due to be implemented this week, while Beijing conceded to increase purchases of U.S. agricultural products.
Nine of 11 S&P 500 sectors closed in negative territory Monday, with Materials and Utilities leading decliners. Financials outperformed ahead of Tuesday’s unofficial start of third-quarter earnings season. Some of Wall Street’s biggest banks will report before the opening bell, including JP Morgan Chase & Co (JPM +0.27%) , Goldman Sachs (GS +0.56%) , and Citigroup (C +0.20%) .
The U.S. Treasury market was closed due to the Columbus Day federal holiday, with the yield on the 10-year note ending Friday at 1.73%. On the data front, an early release of the Empire Manufacturing survey revealed business activity in New York State grew slightly in October. In commodities, WTI crude shed 2% to $53.59/barrel, while COMEX gold was up 0.5% to $1490.00/ounce despite a stronger dollar.
|
 Kenneth J. Gruneisen started out as a licensed stockbroker in August 1987, a couple of months prior to the historic stock market crash that took the Dow Jones Industrial Average down -22.6% in a single day. He has published daily fact-based fundamental and technical analysis on high-ranked stocks online for two decades. Through FACTBASEDINVESTING.COM, Kenneth provides educational articles, news, market commentary, and other information regarding proven investment systems that work in good times and bad.
Comments contained in the body of this report are technical opinions only and are not necessarily those of Gruneisen Growth Corp. The material herein has been obtained from sources believed to be reliable and accurate, however, its accuracy and completeness cannot be guaranteed. Our firm, employees, and customers may effect transactions, including transactions contrary to any recommendation herein, or have positions in the securities mentioned herein or options with respect thereto. Any recommendation contained in this report may not be suitable for all investors and it is not to be deemed an offer or solicitation on our part with respect to the purchase or sale of any securities. |
|
 |
Gold & Silver and Biotech Index Posted Small Gains
Kenneth J. Gruneisen - Passed the CAN SLIM® Master's Exam
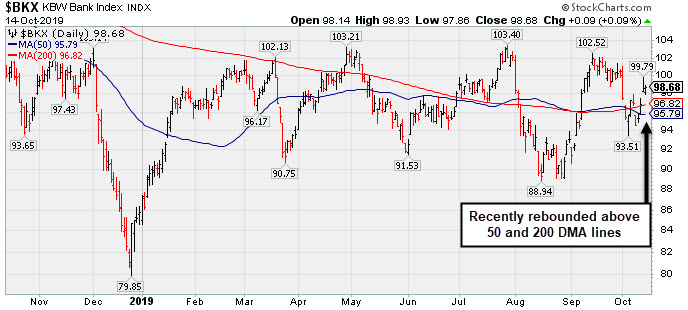
The Broker/Dealer Index ($XBD +0.12%) and the Bank Index ($BKX +0.09%) both eked out tiny gains while the Retail Index ($RLX -0.08%) finished barley in the red. The tech sector was mixed as the Networking Index ($NWX -0.39%) edged lower, the Semiconductor Index ($SOX -0.05%) finished flat, and the Biotech Index ($BTK +0.29%) posted a small gain. Commodity-linked groups were mixed as the Oil Services Index ($OSX -0.52%) and the Integrated Oil Index ($XOI -0.19%) edged lower,meanwhile the Gold & Silver Index ($XAU +0.42%) posted a small gain.
PICTURED: The Bank Index ($BKX +0.09%) recently rebounded above its 50-day and 200-day moving average (DMA) lines.
| Oil Services |
$OSX |
65.03 |
-0.34 |
-0.52% |
-19.32% |
| Integrated Oil |
$XOI |
1,197.36 |
-2.31 |
-0.19% |
+3.30% |
| Semiconductor |
$SOX |
1,590.40 |
-0.73 |
-0.05% |
+37.68% |
| Networking |
$NWX |
547.66 |
-2.14 |
-0.39% |
+12.07% |
| Broker/Dealer |
$XBD |
254.11 |
+0.30 |
+0.12% |
+7.07% |
| Retail |
$RLX |
2,361.51 |
-1.83 |
-0.08% |
+21.02% |
| Gold & Silver |
$XAU |
89.29 |
+0.37 |
+0.42% |
+26.37% |
| Bank |
$BKX |
98.68 |
+0.09 |
+0.09% |
+15.03% |
| Biotech |
$BTK |
4,228.35 |
+12.29 |
+0.29% |
+0.18% |
|
|
|
 |
Perched Near High With Earnings News Due Next Week
Kenneth J. Gruneisen - Passed the CAN SLIM® Master's Exam
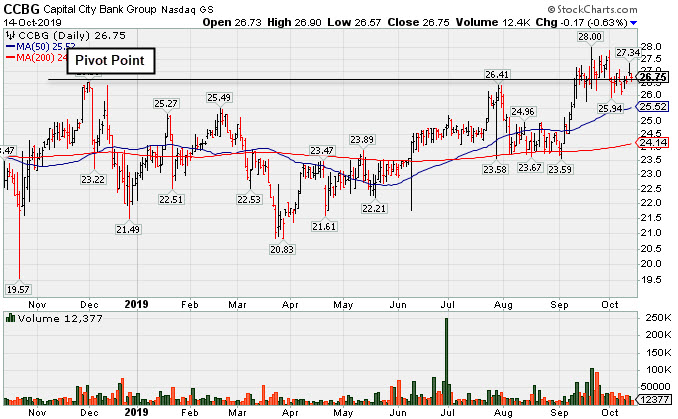
Capital City Bk Gp (CCBG -$0.17 or -0.63% to $26.75) is still hovering near its 52-week high. Prior highs define initial support to watch above its 50-day moving average (DMA) line ($25.58).
CCBG was highlighted in yellow with pivot point cited based on its 12/03/18 high plus 10 cents in the 9/13/19 mid-day report (read here). It hit a new 52-week high on 9/20/19 with a solid gain above the pivot point backed by +339% above average volume triggering a technical buy signal. It was last shown in this FSU section on 9/27/19 with an annotated graph under the headline, "Stalled After Recent Rally for New High".
Keep in mind it is due to report earnings news on 10/21/19. Volume and volatility often increase near earnings news. Earnings increases in the 3 latest quarterly comparisons through Jun '19 were above the +25% minimum guideline (C criteria) as its sales revenues growth rate was in the 12-13% range in the Dec '18, Mar and Jun '19 quarters versus the year ago periods. It has a Timeliness Rating of A, but a Sponsorship Rating of E.
Its small supply of only 16.7 million shares outstanding (S criteria) can contribute to greater price volatility in the event of institutional buying or selling. The number of top-rated funds owning its shares rose from 159 on Sep '18 to 188 in Sep '19, a reassuring sign concerning the I criteria. Its current Up/Down Volume Ratio of 1.3 is an unbiased indication its shares have been under accumulation over the past 50 days.
|
|
|
Color Codes Explained :
Y - Better candidates highlighted by our
staff of experts.
G - Previously featured
in past reports as yellow but may no longer be buyable under the
guidelines.
***Last / Change / Volume data in this table is the closing quote data***
Symbol/Exchange
Company Name
Industry Group |
PRICE |
CHANGE
(%Change) |
Day High |
Volume
(% DAV)
(% 50 day avg vol) |
52 Wk Hi
% From Hi |
Featured
Date |
Price
Featured |
Pivot Featured |
|
Max Buy |
 MLR
-
NYSE
MLR
-
NYSE
Miller Industries Inc
AUTOMOTIVE - Auto Parts
|
$31.83
|
+0.04
0.13% |
$31.92
|
16,742
49.24% of 50 DAV
50 DAV is 34,000
|
$35.26
-9.73%
|
9/24/2019
|
$34.00
|
PP = $35.36
|
|
MB = $37.13
|
Most Recent Note - 10/9/2019 5:47:46 PM
G - Halted its slide at its 200 DMA line today following a streak of 9 consecutive losses. A rebound above its 50 DMA line ($32.24) is needed for its outlook to improve. Subsequent gains above the pivot point backed by at least +40% above average volume may trigger a technical buy signal. Fundamentals remain strong. See the latest FSU analysis for more details and a new annotated graph.
>>> FEATURED STOCK ARTICLE : Tested Support at Long-Term 200-Day Moving Average - 10/9/2019 |
View all notes |
Set NEW NOTE alert |
Company Profile |
SEC
News |
Chart |
Request a new note
C
A
S
I |
CCBG
-
NASDAQ
Capital City Bk Gp
BANKING - Regional - Mid-Atlantic Banks
|
$26.75
|
-0.17
-0.63% |
$26.90
|
12,377
45.84% of 50 DAV
50 DAV is 27,000
|
$28.00
-4.46%
|
9/13/2019
|
$27.03
|
PP = $27.05
|
|
MB = $28.40
|
 Most Recent Note - 10/14/2019 5:16:50 PM
Y - Still hovering near its 52-week high. Prior highs define initial support to watch above its 50 DMA line ($25.58). Due to report earnings news on 10/21/19. See the latest FSU analysis for more details,
>>> FEATURED STOCK ARTICLE : Perched Near High With Earnings News Due Next Week - 10/14/2019 |
View all notes |
Set NEW NOTE alert |
Company Profile |
SEC
News |
Chart |
Request a new note
C
A
S
I |
EPAM
-
NYSE
Epam Systems Inc
COMPUTER SOFTWARE and SERVICES - Information Technology Service
|
$188.20
|
-0.82
-0.43% |
$188.98
|
171,657
49.04% of 50 DAV
50 DAV is 350,000
|
$201.00
-6.37%
|
5/9/2019
|
$169.25
|
PP = $180.55
|
|
MB = $189.58
|
Most Recent Note - 10/8/2019 5:52:43 PM
G - Slumped back below its 50 DMA line ($186.83) again hurting its outlook. Faces resistance due to overhead supply up to the $201 level. Prior lows in the $174-175 area define the next important support level. Reported earnings +27% on +24% sales revenues for the Jun '19 quarter.
>>> FEATURED STOCK ARTICLE : Slumped and Sputtered Below 50-Day Moving Average - 9/30/2019 |
View all notes |
Set NEW NOTE alert |
Company Profile |
SEC
News |
Chart |
Request a new note
C
A
S
I |
AUDC
-
NASDAQ
Audiocodes Ltd
ELECTRONICS - Scientific and Technical Instrum
|
$17.79
|
-0.16
-0.89% |
$18.06
|
135,879
68.28% of 50 DAV
50 DAV is 199,000
|
$22.50
-20.93%
|
9/13/2019
|
$19.68
|
PP = $19.84
|
|
MB = $20.83
|
Most Recent Note - 10/8/2019 5:49:16 PM
G - Color code is changed to green after slumping back below its 50 DMA line ($18.51) again. Prior lows in the $16.50 area define the next important support.
>>> FEATURED STOCK ARTICLE : Sank Below 50-Day Average as 7 Straight Losses Follow Reversal - 10/2/2019 |
View all notes |
Set NEW NOTE alert |
Company Profile |
SEC
News |
Chart |
Request a new note
C
A
S
I |
CHDN
-
NASDAQ
Churchill Downs Inc
LEISURE - Gaming Activities
|
$130.39
|
-0.86
-0.66% |
$131.35
|
235,341
103.67% of 50 DAV
50 DAV is 227,000
|
$132.73
-1.76%
|
10/8/2019
|
$129.77
|
PP = $132.83
|
|
MB = $139.47
|
Most Recent Note - 10/9/2019 12:41:28 PM
Y - Posted a 4th consecutive gain with higher volume on the prior session and finished at a record high close. Color code was changed to yellow with new pivot point cited based on its 8/01/19 high plus 10 cents. Subsequent gains above the pivot point backed by at least +40% above average volume may trigger a new (or add-on) technical buy signal. Its 50 DMA line ($122.63) acted as support in recent weeks during its consolidation. Jun '19 earnings +10% on +26% sales revenues versus the year ago period were below the +25% minimum earnings guideline (C criteria), noted recently raising fundamental concerns. See the latest FSU analysis for more details and an annotated graph.
>>> FEATURED STOCK ARTICLE : Volume-Driven Gain for Record High Close - 10/8/2019 |
View all notes |
Set NEW NOTE alert |
Company Profile |
SEC
News |
Chart |
Request a new note
C
A
S
I |
Symbol/Exchange
Company Name
Industry Group |
PRICE |
CHANGE
(%Change) |
Day High |
Volume
(% DAV)
(% 50 day avg vol) |
52 Wk Hi
% From Hi |
Featured
Date |
Price
Featured |
Pivot Featured |
|
Max Buy |
LULU
-
NASDAQ
Lululemon Athletica
MANUFACTURING - Textile Manufacturing
|
$203.04
|
+1.42
0.70% |
$205.11
|
1,826,125
99.79% of 50 DAV
50 DAV is 1,830,000
|
$204.44
-0.68%
|
9/6/2019
|
$201.25
|
PP = $194.35
|
|
MB = $204.07
|
Most Recent Note - 10/11/2019 12:59:19 PM
Y - Rising within striking distance of its all-time high and "max buy" level with today's gain. Finished near the session high with a solid volume-driven gain on the prior session. Its 50 DMA line ($187.69) and recent low ($185.36 on 10/03/19) define important near-term support where more damaging losses would raise serious concerns and trigger technical sell signals.
>>> FEATURED STOCK ARTICLE : Found Support After Undercutting 50-Day Moving Average - 10/3/2019 |
View all notes |
Set NEW NOTE alert |
Company Profile |
SEC
News |
Chart |
Request a new note
C
A
S
I |
CPRT
-
NASDAQ
Copart Inc
SPECIALTY RETAIL - Auto Dealerships
|
$81.68
|
+0.31
0.38% |
$82.06
|
643,481
44.32% of 50 DAV
50 DAV is 1,452,000
|
$83.70
-2.41%
|
9/5/2019
|
$79.13
|
PP = $79.84
|
|
MB = $83.83
|
Most Recent Note - 10/9/2019 5:52:19 PM
Y - Color code is changed to yellow after finding support above its 50 DMA line ($78.16) and trading back above its pivot point helping its outlook improve.
>>> FEATURED STOCK ARTICLE : Found Prompt Support Near 50-Day Moving Average - 10/4/2019 |
View all notes |
Set NEW NOTE alert |
Company Profile |
SEC
News |
Chart |
Request a new note
C
A
S
I |
PFPT
-
NASDAQ
Proofpoint Inc
Computer Sftwr-Security
|
$129.64
|
-0.50
-0.38% |
$133.58
|
614,444
85.58% of 50 DAV
50 DAV is 718,000
|
$133.00
-2.53%
|
10/1/2019
|
$129.59
|
PP = $132.95
|
|
MB = $139.60
|
Most Recent Note - 10/8/2019 5:51:10 PM
Y - Retreated from its all-time high with another volume-driven loss today. Its 50 DMA line ($121.91) defines near-term support. Met stubborn resistance in the $132 area in recent months. Subsequent gains above the pivot point backed by at least +40% above average volume may trigger a technical buy signal.
>>> FEATURED STOCK ARTICLE : Challenging Previously Stubborn Resistance - 10/1/2019 |
View all notes |
Set NEW NOTE alert |
Company Profile |
SEC
News |
Chart |
Request a new note
C
A
S
I |
BLD
-
NYSE
Topbuild Corp
Bldg-Constr Prds/Misc
|
$98.63
|
+0.96
0.98% |
$99.26
|
183,484
69.24% of 50 DAV
50 DAV is 265,000
|
$99.19
-0.56%
|
5/17/2019
|
$82.19
|
PP = $87.31
|
|
MB = $91.68
|
Most Recent Note - 10/9/2019 5:49:29 PM
G - Posted a quiet gain today for a best-ever close. Stayed above its 50 DMA line, and challenging its all-time high, it is extended from the prior base after wedging higher with gains lacking great volume conviction. Earnings rose +39% on +9% sales revenues for the Jun '19 quarter versus the year ago period. Its 50 DMA line ($92.186) defines important support to watch along with its prior low ($86.53 on 8/28/19).
>>> FEATURED STOCK ARTICLE : Near High After Finding Support at 50-Day Average - 10/7/2019 |
View all notes |
Set NEW NOTE alert |
Company Profile |
SEC
News |
Chart |
Request a new note
C
A
S
I |
PAGS
-
NYSE
Pagseguro Digital Cl A
Finance-CrdtCard/PmtPr
|
$46.29
|
+0.61
1.34% |
$46.94
|
1,101,061
68.64% of 50 DAV
50 DAV is 1,604,000
|
$53.43
-13.36%
|
6/25/2019
|
$37.69
|
PP = $40.07
|
|
MB = $42.07
|
Most Recent Note - 10/10/2019 5:34:54 PM
G - A rebound above the 50 DMA line ($47.33) still is needed for its outlook to improve. Recently testing prior lows in the $42-43 area noted as important near-term chart support to watch where violations may trigger a worrisome technical sell signal. See the latest FSU analysis for more details and a new annotated graph.
>>> FEATURED STOCK ARTICLE : Rebound Above 50-Day Average Needed for Outlook to Improve - 10/10/2019 |
View all notes |
Set NEW NOTE alert |
Company Profile |
SEC
News |
Chart |
Request a new note
C
A
S
I |
Symbol/Exchange
Company Name
Industry Group |
PRICE |
CHANGE
(%Change) |
Day High |
Volume
(% DAV)
(% 50 day avg vol) |
52 Wk Hi
% From Hi |
Featured
Date |
Price
Featured |
Pivot Featured |
|
Max Buy |
|
|
|
THESE ARE NOT BUY RECOMMENDATIONS!
Comments contained in the body of this report are technical
opinions only. The material herein has been obtained
from sources believed to be reliable and accurate, however,
its accuracy and completeness cannot be guaranteed.
This site is not an investment advisor, hence it does
not endorse or recommend any securities or other investments.
Any recommendation contained in this report may not
be suitable for all investors and it is not to be deemed
an offer or solicitation on our part with respect to
the purchase or sale of any securities. All trademarks,
service marks and trade names appearing in this report
are the property of their respective owners, and are
likewise used for identification purposes only.
This report is a service available
only to active Paid Premium Members.
You may opt-out of receiving report notifications
at any time. Questions or comments may be submitted
by writing to Premium Membership Services 665 S.E. 10 Street, Suite 201 Deerfield Beach, FL 33441-5634 or by calling 1-800-965-8307
or 954-785-1121.
|
|
|