You are not logged in.
This means you
CAN ONLY VIEW reports that were published prior to Wednesday, March 12, 2025.
You
MUST UPGRADE YOUR MEMBERSHIP if you want to see any current reports.
AFTER MARKET UPDATE - TUESDAY, SEPTEMBER 27TH, 2022
Previous After Market Report Next After Market Report >>>
|
|
|
|
DOW |
-125.82 |
29,134.99 |
-0.43% |
|
Volume |
1,007,173,518 |
-6% |
|
Volume |
4,395,518,700 |
-6% |
|
NASDAQ |
+26.58 |
10,829.50 |
+0.25% |
|
Advancers |
1,511 |
49% |
|
Advancers |
2,143 |
48% |
|
S&P 500 |
-7.75 |
3,647.29 |
-0.21% |
|
Decliners |
1,571 |
51% |
|
Decliners |
2,282 |
52% |
|
Russell 2000 |
+6.63 |
1,662.51 |
+0.40% |
|
52 Wk Highs |
15 |
|
|
52 Wk Highs |
31 |
|
|
S&P 600 |
+0.88 |
1,065.33 |
+0.08% |
|
52 Wk Lows |
893 |
|
|
52 Wk Lows |
912 |
|
|
The market (M criteria) is in a correction. A caution flag has been raised by the technical damage in the major indices coupled with a shrinking list of stocks hitting new highs. Disciplined investors know to raise cash by selling weakening stocks on a case-by-case basis, and to protect that cash by avoiding any new buys until a new rally is confirmed with a follow-through day.
|
 |
Market Indecisive as Major Averages Ended Mixed
Kenneth J. Gruneisen - Passed the CAN SLIM® Master's Exam
The Dow ended 125 points lower to remain in bear market territory, while the Nasdaq Composite advanced 0.3%. The S&P 500 dipped 0.2%, notching a new low for 2022. The volume totals reported were lighter than the prior session on the NYSE and on the Nasdaq exchange. Advancers and decliners were evenly mixed on the NYSE and on the Nasdaq exchange. There was 1 high-ranked company from the Leaders List that hit a new 52-week high and was listed on the BreakOuts Page after zero on the two prior sessions. New 52-week lows totals again solidly outnumbered new 52-week highs on both the NYSE and the Nasdaq exchange. The market is now in a correction (M criteria).
Chart courtesy of www.stockcharts.com%20on%20Tuesday.%20Yesterday,%20the%20broad%20benchmark%20eclipsed%20the%204,300%20level%20for%20the%20first%20time%20since%20late%20April.%20The%20Nasdaq%20Composite%20fell%201.3%%20amid%20weakness%20in%20mega-cap%20tech%20shares.%20The%20volume%20totals%20reported%20were%20mixed,%20lighter%20than%20the%20prior%20session%20on%20the%20NYSE%20and%20higher%20on%20the%20Nasdaq%20exchange.%20Decliners%20led%20advancers%20by%20a%204-1%20margin%20on%20the%20NYSE%20ad%20by%20a%203-1%20margin%20on%20the%20Nasdaq%20exchange.%20There%20were%2017%20high-ranked%20companies%20from%20the%20Leaders%20List%20that%20hit%20new%2052-week%20highs%20and%20were%20listed%20on%20the%20BreakOuts%20Page,%20down%20from%20the%20total%20of%2045%20on%20the%20prior%20session.%20New%2052-week%20highs%20outnumbered%20new%2052-week%20lows%20on%20the%20NYSE,%20but%20new%20lows%20outnumbered%20new%20highs%20on%20the%20Nasdaq%20exchange.%20The%20market%20is%20in%20a%20confirmed%20uptrend%20(M%20criteria).%20Any%20sustainable%20rally%20requires%20a%20healthy%20crop%20of%20leading%20stocks%20hitting%20new%20highs,%20so%20the%20recent%20improvement%20in%20leadership%20was%20a%20reassuring%20sign.) 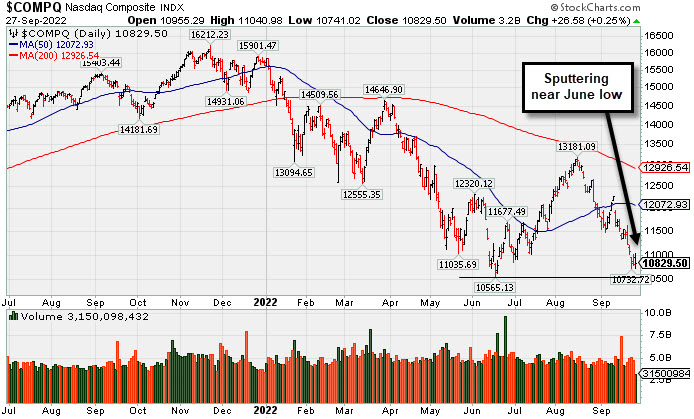 PICTURED: The Nasdaq Composite Index is sputtering near the June low.
U.S. equities finished mixed Tuesday as investors digested a slew of economic data and the latest commentary from U.S. Federal Reserve (Fed) officials. This morning, St. Louis Fed president James Bullard said inflation is a “serious problem” that the central bank must address, while Minneapolis Fed President Neel Kashkari reiterated the need for convincing evidence of falling inflation before cutting rates. In contrast, Chicago Fed President Charles Evans signaled concern over the fast pace of rate hikes by the central bank.
On the data front, durable goods orders fell 0.2% in August, while capital goods orders climbed 1.3% for the month, its fastest pace since January. September’s Conference Board Consumer Confidence Index print climbed to 108.0 amid a resilient labor market and falling gasoline prices. Elsewhere, new home sales unexpectedly climbed 28.8% in August after falling 8.6% in July. The FHFA House Price Index declined 0.6% month-over-month in July, its first decline since March 2012. S&P CoreLogic Case-Schiller’s House Price Index climbed 15.77% year-over-year, easing slightly from June’s upwardly revised 18.08% print.
Longer-dated Treasuries weakened, with the yield on the benchmark 10-year note adding eight basis points (0.08%) to 3.98%, while the 30-year bond yield climbed 14 basis points (0.14%) to 3.86%. The two-year note yield was little changed at 4.31%. In commodities, West Texas Intermediate (WTI) crude added 2.4% to $78.51/barrel amid tight supply conditions. A gauge of the U.S. dollar reversed losses to end 0.1% higher, hovering just below its 20-year high. |
 Kenneth J. Gruneisen started out as a licensed stockbroker in August 1987, a couple of months prior to the historic stock market crash that took the Dow Jones Industrial Average down -22.6% in a single day. He has published daily fact-based fundamental and technical analysis on high-ranked stocks online for two decades. Through FACTBASEDINVESTING.COM, Kenneth provides educational articles, news, market commentary, and other information regarding proven investment systems that work in good times and bad.
Comments contained in the body of this report are technical opinions only and are not necessarily those of Gruneisen Growth Corp. The material herein has been obtained from sources believed to be reliable and accurate, however, its accuracy and completeness cannot be guaranteed. Our firm, employees, and customers may effect transactions, including transactions contrary to any recommendation herein, or have positions in the securities mentioned herein or options with respect thereto. Any recommendation contained in this report may not be suitable for all investors and it is not to be deemed an offer or solicitation on our part with respect to the purchase or sale of any securities. |
|
 |
Bank Index Fell While Tech and Commodity-Linked Groups Rose
Kenneth J. Gruneisen - Passed the CAN SLIM® Master's Exam
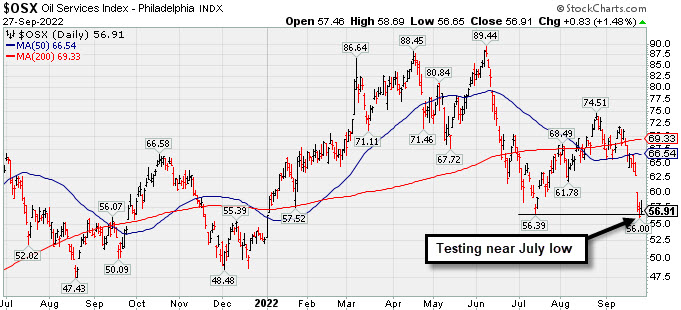
The Bank Index ($BKX -0.94%) created a drag on the major averages and the Broker/Dealer Index ($XBD -0.25%) and Retail Index ($RLX -0.13%) both ended slightly in the red. The Semiconductor Index ($SOX +1.04%) and Biotech Index ($BTK +0.78%) led the tech sector while the Networking Index ($NWX +0.09%) finished flat. The Oil Services Index ($OSX +1.48%) and Integrated Oil Index ($XOI +1.52%) both posted solid gains and the Gold & Silver Index ($XAU +0.72%) also edged higher.
PICTURED: The Oil Services Index ($OSX +1.48%) posted a gain today, but it has been testing near the July low.
| Oil Services |
$OSX |
56.91 |
+0.83 |
+1.48% |
+7.96% |
| Integrated Oil |
$XOI |
1,437.18 |
+21.58 |
+1.52% |
+21.98% |
| Semiconductor |
$SOX |
2,398.04 |
+24.58 |
+1.04% |
-39.23% |
| Networking |
$NWX |
717.08 |
+0.65 |
+0.09% |
-26.16% |
| Broker/Dealer |
$XBD |
411.22 |
-1.03 |
-0.25% |
-15.54% |
| Retail |
$RLX |
2,974.62 |
-3.95 |
-0.13% |
-29.62% |
| Gold & Silver |
$XAU |
92.06 |
+0.66 |
+0.72% |
-30.50% |
| Bank |
$BKX |
96.17 |
-0.91 |
-0.94% |
-27.27% |
| Biotech |
$BTK |
4,424.48 |
+34.38 |
+0.78% |
-19.82% |
|
|
|
 |
Found Support After Undercutting 50 DMA and Prior Low
Kenneth J. Gruneisen - Passed the CAN SLIM® Master's Exam
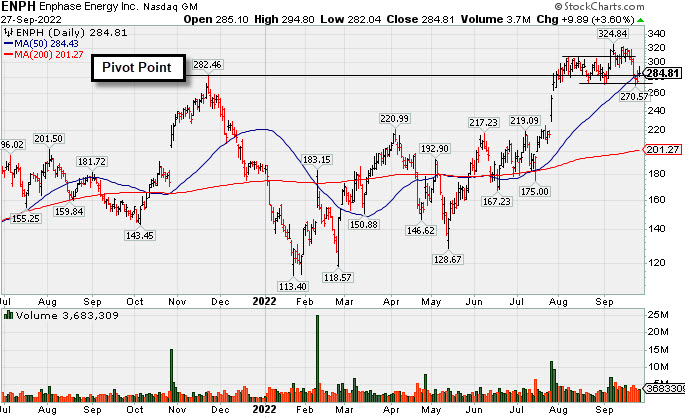
Enphase Energy Inc (ENPH +$9.89 or +3.60% to $284.81) posted a gain as it found support near its 50-day moving average (DMA) line ($284.43) after briefly undercutting prior lows in the $271-272 area. More damaging losses would raise greater concerns. Fundamentals remain strong. Members have been repeatedly reminded, "The market is in a correction (M criteria) and disciplined investors know to avoid new buying efforts until a new rally confirmed with a follow-through day."
ENPH was highlighted in yellow in the 7/28/22 mid-day report (read here). It was last shown with an annotated graph on 9/13/22 under the headline, "High-Ranked Solar Energy Firm Hovering Near All-Time High". It has an Earnings Per Share Rating of 98. The company has reported very strong sales revenues and earnings increases in quarterly comparisons through Jun '22 versus the year ago periods, above the +25% minimum guideline (C criteria). It has a strong annual earnings (A criteria) history since FY '18 after years of losses.
The company hails from the Energy-Solar group which is currently ranked 1st of the 197 Industry Groups (L criteria). The number of top-rated funds owning its shares rose from 1,068 in Dec '20 to 1,863 in Jun '22, a reassuring sign concerning the I criteria. Its current Up/Down Volume Ratio of 1.4 is an unbiased indication its shares have been under accumulation over the past 50 days.
|
|
|
Color Codes Explained :
Y - Better candidates highlighted by our
staff of experts.
G - Previously featured
in past reports as yellow but may no longer be buyable under the
guidelines.
***Last / Change / Volume data in this table is the closing quote data***
Symbol/Exchange
Company Name
Industry Group |
PRICE |
CHANGE
(%Change) |
Day High |
Volume
(% DAV)
(% 50 day avg vol) |
52 Wk Hi
% From Hi |
Featured
Date |
Price
Featured |
Pivot Featured |
|
Max Buy |
 CI
-
NYSE
CI
-
NYSE
Cigna Corp
Medical-Managed Care
|
$277.62
|
+0.82
0.30% |
$282.35
|
2,190,831
114.46% of 50 DAV
50 DAV is 1,914,000
|
$296.29
-6.30%
|
7/7/2022
|
$276.55
|
PP = $273.68
|
|
MB = $287.36
|
 Most Recent Note - 9/27/2022 5:25:51 PM
G - Posted a small gain today. Remains below its 50 DMA line ($283) following a streak of 6 consecutive damaging losses. Reported earnings for the Jun '22 quarter rose +19% on +5% sales revenues versus the year ago period, breaking a streak of 3 quarterly earnings increases above the +25% minimum guideline (C criteria), raising fundamental concerns.
>>> FEATURED STOCK ARTICLE : Found Support Above 50-Day Moving Average Line This Week - 9/16/2022 |
View all notes |
Set NEW NOTE alert |
Company Profile |
SEC
News |
Chart |
Request a new note
C
A
S
I |
ESQ
-
NASDAQ
Esquire Financial Hldgs
Finance-Commercial Loans
|
$37.82
|
-0.50
-1.30% |
$38.39
|
9,397
36.14% of 50 DAV
50 DAV is 26,000
|
$41.68
-9.26%
|
7/26/2022
|
$37.74
|
PP = $39.19
|
|
MB = $41.15
|
Most Recent Note - 9/27/2022 5:27:23 PM
Y - Testing support at its 50 DMA line ($37.85) while sputtering below the pivot point. More damaging losses would raise greater concernsThe market is in a correction (M criteria) and disciplined investors know to avoid new buying efforts until a new rally confirmed with a follow-through day.
>>> FEATURED STOCK ARTICLE : Thinly-Traded Esquire Still Perched Near High - 9/20/2022 |
View all notes |
Set NEW NOTE alert |
Company Profile |
SEC
News |
Chart |
Request a new note
C
A
S
I |
ENPH
-
NASDAQ
Enphase Energy Inc
Energy-Solar
|
$284.81
|
+9.89
3.60% |
$294.80
|
3,683,336
99.77% of 50 DAV
50 DAV is 3,692,000
|
$324.84
-12.32%
|
7/28/2022
|
$276.66
|
PP = $282.55
|
|
MB = $296.68
|
Most Recent Note - 9/27/2022 5:19:54 PM
Y - Found support today near its 50 DMA line ($284.43) after briefly undercutting prior lows in the $271-272 area. More damaging losses would raise greater concerns. Fundamentals remain strong. The market is in a correction (M criteria) and disciplined investors know to avoid new buying efforts until a new rally confirmed with a follow-through day. See the latest FSU analysis for more details and a new annotated graph.
>>> FEATURED STOCK ARTICLE : Found Support After Undercutting 50 DMA and Prior Low - 9/27/2022 |
View all notes |
Set NEW NOTE alert |
Company Profile |
SEC
News |
Chart |
Request a new note
C
A
S
I |
CASY
-
NASDAQ
Caseys General Stores
RETAIL - Super/Mini Markets
|
$198.20
|
-3.73
-1.85% |
$203.30
|
239,413
96.15% of 50 DAV
50 DAV is 249,000
|
$223.90
-11.48%
|
9/8/2022
|
$217.81
|
PP = $222.40
|
|
MB = $233.52
|
Most Recent Note - 9/27/2022 5:23:19 PM
Ended lower today for a 6th consecutive loss, testing its 200 DMA line ($198). It will be dropped from the Featured Stocks list tonight. Only a prompt rebound above the 50 DMA line would help its outlook improve.
>>> FEATURED STOCK ARTICLE : Damaging Slump Below 50-Day Moving Average Hurt Outlook - 9/26/2022 |
View all notes |
Set NEW NOTE alert |
Company Profile |
SEC
News |
Chart |
Request a new note
C
A
S
I |
CCRN
-
NASDAQ
Cross Country Healthcare
DIVERSIFIED SERVICES - Staffing and Outsourcing Service
|
$27.76
|
+0.12
0.43% |
$28.19
|
569,904
63.25% of 50 DAV
50 DAV is 901,000
|
$30.51
-9.01%
|
9/9/2022
|
$27.32
|
PP = $30.61
|
|
MB = $32.14
|
Most Recent Note - 9/26/2022 5:34:30 PM
Y - Its 50 DMA line ($26) defines important near-term support where a violation would raise concerns and trigger a technical sell signal. Volume totals have been cooling while still consolidating within striking distance of prior highs in the $30 area. Recently reported insider buying is a reassuring sign.The market is in a correction (M criteria) and disciplined investors know to avoid new buying efforts until a new rally confirmed with a follow-through day.
>>> FEATURED STOCK ARTICLE : Positive Reversal While Consolidating Above 50-Day Moving Average - 9/12/2022 |
View all notes |
Set NEW NOTE alert |
Company Profile |
SEC
News |
Chart |
Request a new note
C
A
S
I |
Symbol/Exchange
Company Name
Industry Group |
PRICE |
CHANGE
(%Change) |
Day High |
Volume
(% DAV)
(% 50 day avg vol) |
52 Wk Hi
% From Hi |
Featured
Date |
Price
Featured |
Pivot Featured |
|
Max Buy |
|
|
|
THESE ARE NOT BUY RECOMMENDATIONS!
Comments contained in the body of this report are technical
opinions only. The material herein has been obtained
from sources believed to be reliable and accurate, however,
its accuracy and completeness cannot be guaranteed.
This site is not an investment advisor, hence it does
not endorse or recommend any securities or other investments.
Any recommendation contained in this report may not
be suitable for all investors and it is not to be deemed
an offer or solicitation on our part with respect to
the purchase or sale of any securities. All trademarks,
service marks and trade names appearing in this report
are the property of their respective owners, and are
likewise used for identification purposes only.
This report is a service available
only to active Paid Premium Members.
You may opt-out of receiving report notifications
at any time. Questions or comments may be submitted
by writing to Premium Membership Services 665 S.E. 10 Street, Suite 201 Deerfield Beach, FL 33441-5634 or by calling 1-800-965-8307
or 954-785-1121.
|
|
|